. 2017 May 10;840(2):115.
doi: 10.3847/1538-4357/aa6e4f. Epub 2017 May 15.

Solution of Heliospheric Propagation: Unveiling the Local Interstellar Spectra of Cosmic-ray Species

Affiliations

Solution of Heliospheric Propagation: Unveiling the Local Interstellar Spectra of Cosmic-ray Species

M J Boschini et al. Astrophys J. .

Abstract

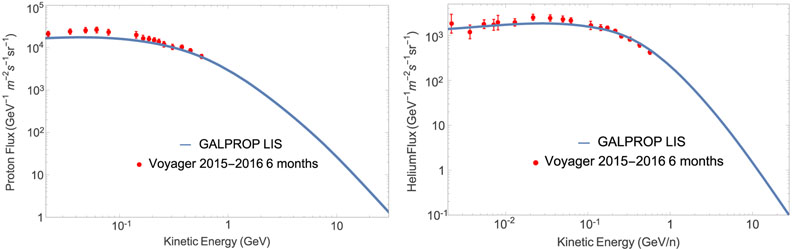
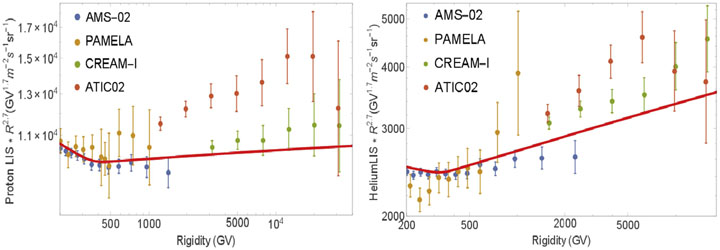
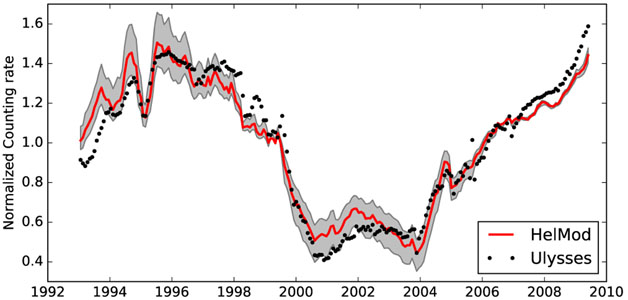
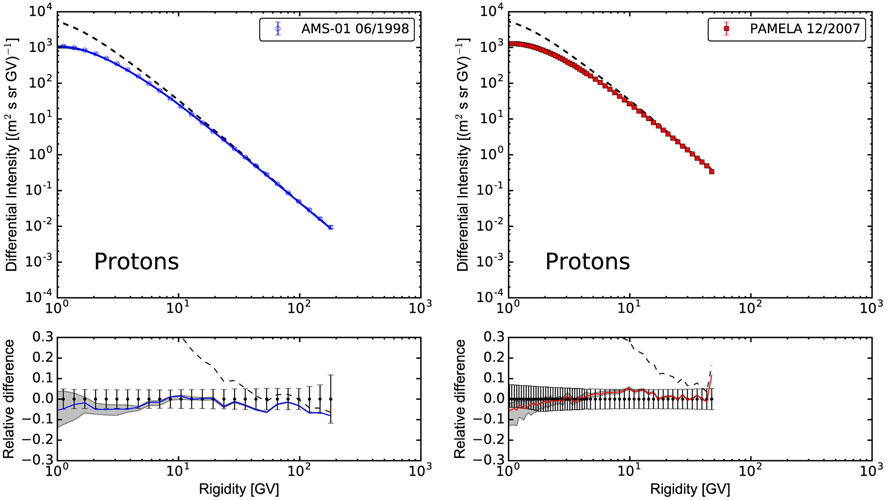
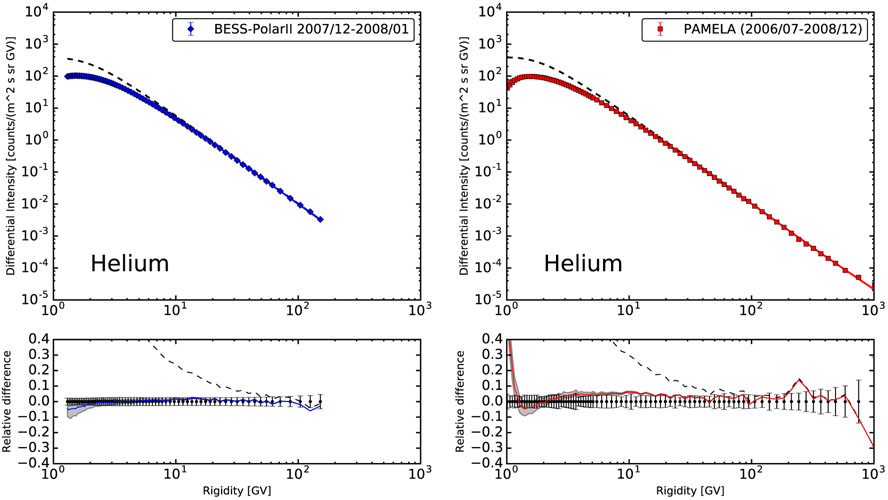
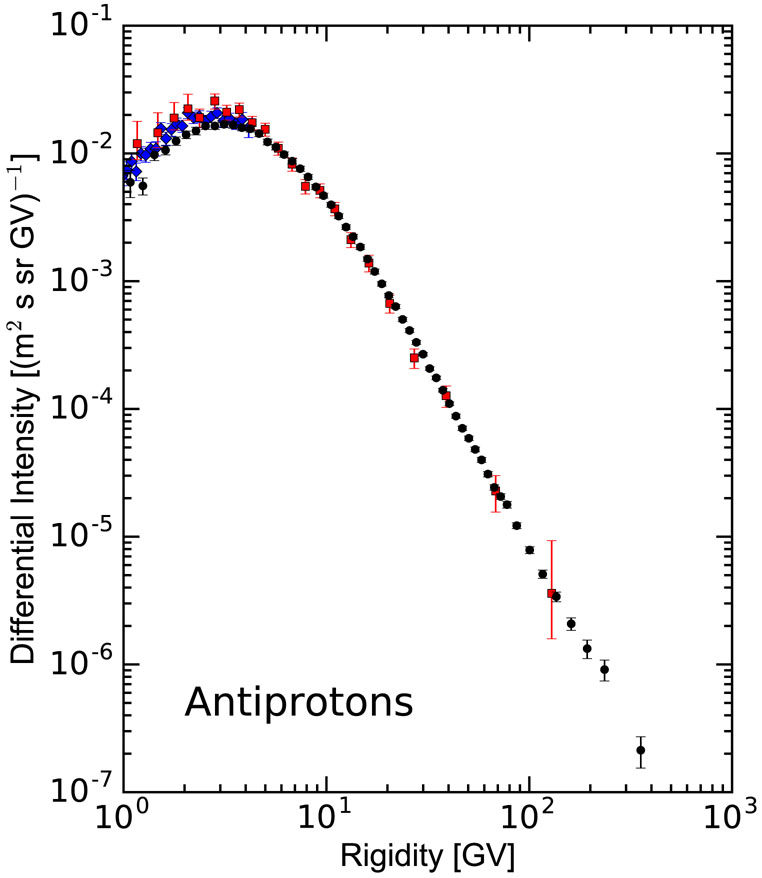
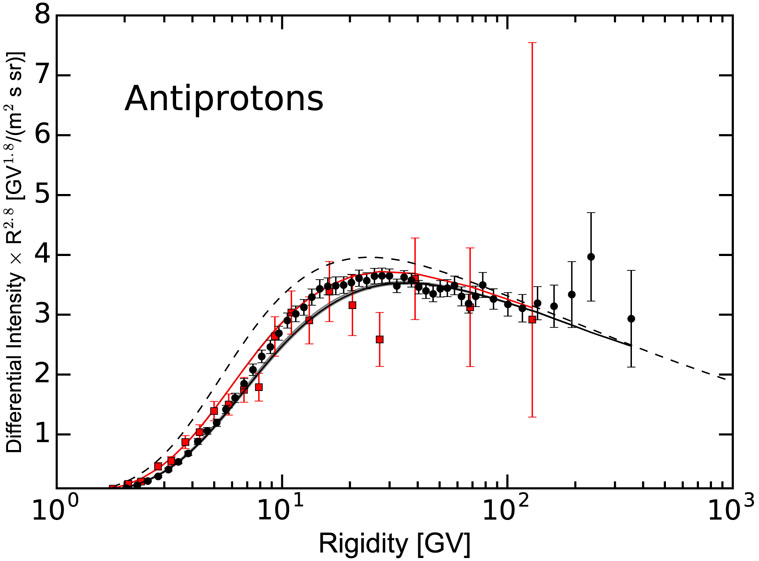
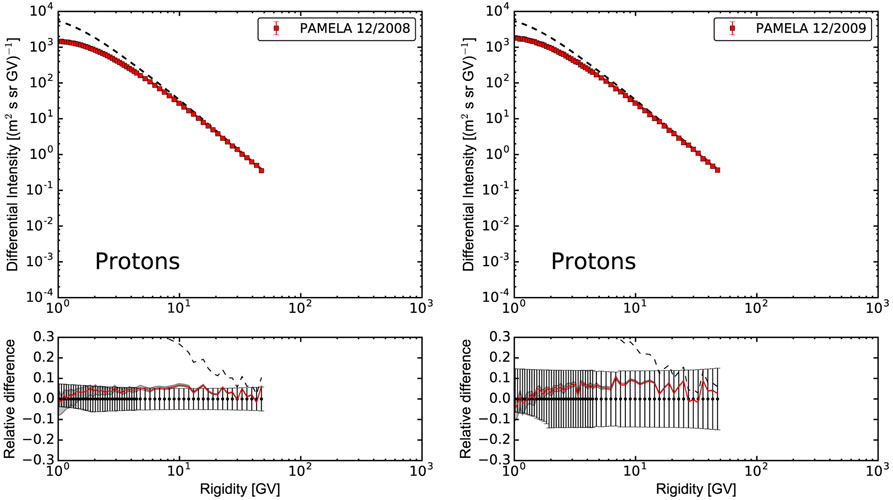
Local interstellar spectra (LIS) for protons, helium, and antiprotons are built using the most recent experimental results combined with state-of-the-art models for propagation in the Galaxy and heliosphere. Two propagation packages, GALPROP and HelMod, are combined to provide a single framework that is run to reproduce direct measurements of cosmic-ray (CR) species at different modulation levels and at both polarities of the solar magnetic field. To do so in a self-consistent way, an iterative procedure was developed, where the GALPROP LIS output is fed into HelMod, providing modulated spectra for specific time periods of selected experiments to compare with the data; the HelMod parameter optimization is performed at this stage and looped back to adjust the LIS using the new GALPROP run. The parameters were tuned with the maximum likelihood procedure using an extensive data set of proton spectra from 1997 to 2015. The proposed LIS accommodate both the low-energy interstellar CR spectra measured by Voyager 1 and the high-energy observations by BESS, Pamela, AMS-01, and AMS-02 made from the balloons and near-Earth payloads; it also accounts for Ulysses counting rate features measured out of the ecliptic plane. The found solution is in a good agreement with proton, helium, and antiproton data by AMS-02, BESS, and PAMELA in the whole energy range.

Keywords: ISM: general; Sun: heliosphere; cosmic rays; diffusion; elementary particles; interplanetary medium.


Figures

Figure 1.
Figure 1.
MCMC matrix of 2D constraints for the main propagation parameters. In off-diagonal panels, the inner contours denote 1σ (blue) and 2σ (light blue). The diagonal plots are the 1D probability distributions of the corresponding parameters.
Figure 2.
Figure 2.
Computed normalized probability function G(R0R) for R0 = 1.1, 5.1, and 9.7 GV (left to right) evaluated for AMS-02 proton binning during the period 2011–2014; see the text for details.
Figure 3.
Figure 3.
Local interstellar spectra of CR protons (blue solid line), helium (green dashed line), and antiprotons (red dot-dashed line) as derived from the MCMC procedure (see text).
Figure 4.
Figure 4.
DCR best-fit proton LIS (left) and He LIS (right), shown with blue curves, compared with Voyager 1 2015–2016 monthly averaged data.
Figure 5.
Figure 5.
Best-fit proton LIS (left) and He LIS (right) compared with high-energy data by AMS-02, CREAM-I, ATIC-02, and PAMELA.
Figure 6.
Figure 6.
Ulysses counting rate normalized to the average value for the KET coincidence channel K12 (proton in energy range 0.25–2.2 GeV/nucleon) as a function of time in units of Carrington rotation. Each point was averaged over a Carrington rotation. The solid line is the HelMod result provided for protons at 2.2 GeV for each Carrington rotation at the same distance and solar latitude as the Ulysses spacecraft.
Figure 7.
Figure 7.
Proton differential intensities for 1998 June (AMS-01; left) and 2007 December (PAMELA; right). Circles represent experimental data, the dashed line is the GALPROP LIS, and the solid line is the computed modulated spectrum. The bottom panel is the relative difference between the numerical solution and experimental data.
Figure 8.
Figure 8.
Helium differential intensity for 2007 December (BESS; left) and averaged for 2006–2009 (PAMELA; right). Circles represent experimental data, the dashed line is the GALPROP LIS, and the solid line is the computed modulated spectrum. The bottom panel is the relative difference between the numerical solution and experimental data.
Figure 9.
Figure 9.
Antiproton differential intensities for 2007 December (BESS; left) and averaged for 2006–2009 (PAMELA; right). Circles represent experimental data, the dashed line is the GALPROP LIS, and the solid line is the computed modulated spectrum. The bottom panel is the relative difference between the numerical solution and experimental data.
Figure 10.
Figure 10.
Antiproton differential intensity as measured by AMS-02 (black circles), BESS-Polar II (red squares), and PAMELA (blue diamonds).
Figure 11.
Figure 11.
Differential intensities of CR protons (left) and helium (right) measured by AMS-02. Circles represent experimental data, the dashed line is the GALPROP LIS, and the solid line is the computed modulated spectrum. The bottom panel is the relative difference between the numerical solution and experimental data.
Figure 12.
Figure 12.
Differential intensity of CR antiprotons measured by AMS-02. Circles represent experimental data, the dashed line is the GALPROP LIS, and the solid line is the computed modulated spectrum. The bottom panel is the relative difference between the numerical solution and experimental data. The antiproton calculations include a contribution from nuclei through nickel.
Figure 13.
Figure 13.
Differential intensities of CR antiprotons measured by PAMELA (red squares) and AMS-02 (black circles). The antiproton LIS is shown by the dashed line. Solid lines correspond to the modulated spectra with HelMod: the lower one in black corresponds to that for AMS-02; the upper one in red corresponds to that for PAMELA.
Figure 14.
Figure 14.
Left: helium differential intensities for 1998 July (BESS). Right: proton differential intensities for 2006 December (PAMELA). Circles represent experimental measurements, the dashed line is the GALPROP LIS, and the solid line is the computed modulated spectrum. The bottom panel is the relative difference between numerical solution and experimental data.
Figure 15.
Figure 15.
Left: proton differential intensities for 2008 December (PAMELA). Right: proton differential intensities for December 2009 (PAMELA). See Figure 14 for legend.

References

    1. Abe K, Fuke H, Haino S, et al. 2016, ApJ, 822, 65
    1. Abeysekara AU, Alfaro R, Alvarez C, et al. 2013, APh, 50, 26
    1. Accardo L, et al. 2014, PhRvL, 113, 121101 - PubMed
    1. Acharya BS, Aguilar M, Aisa D, et al. 2013, APh, 43, 3
    1. Ackermann M, Ajello M, Atwood WB, et al. 2012, ApJ, 750, 3

LinkOut - more resources