

Knee Acoustic Emissions as a Digital Biomarker of Disease Status in Juvenile Idiopathic Arthritis
- PMID: 34713044
- PMCID: PMC8521909
- DOI: 10.3389/fdgth.2020.571839
Knee Acoustic Emissions as a Digital Biomarker of Disease Status in Juvenile Idiopathic Arthritis
Abstract
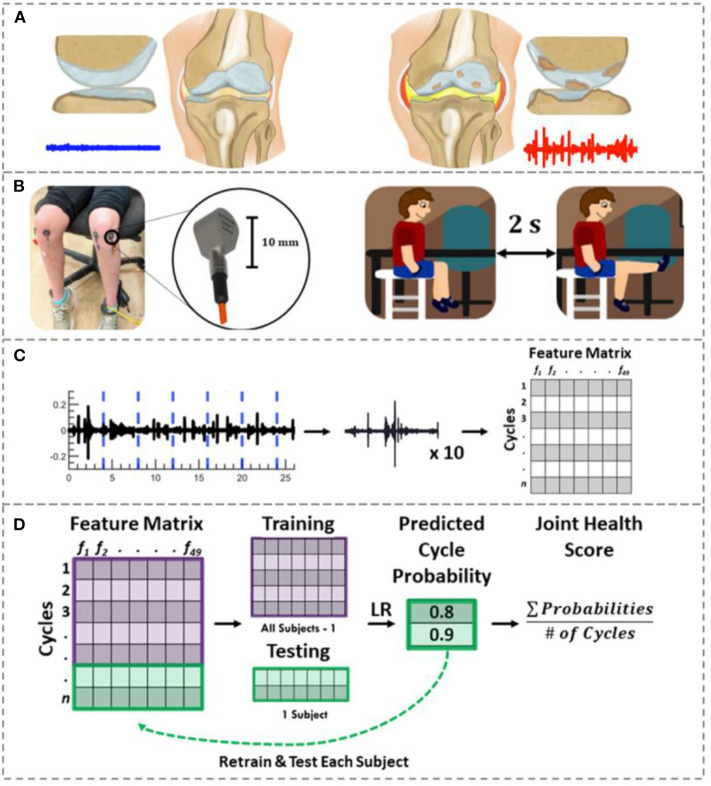
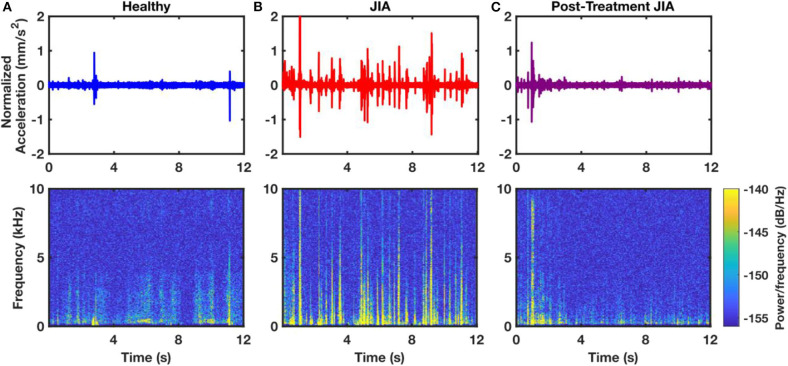
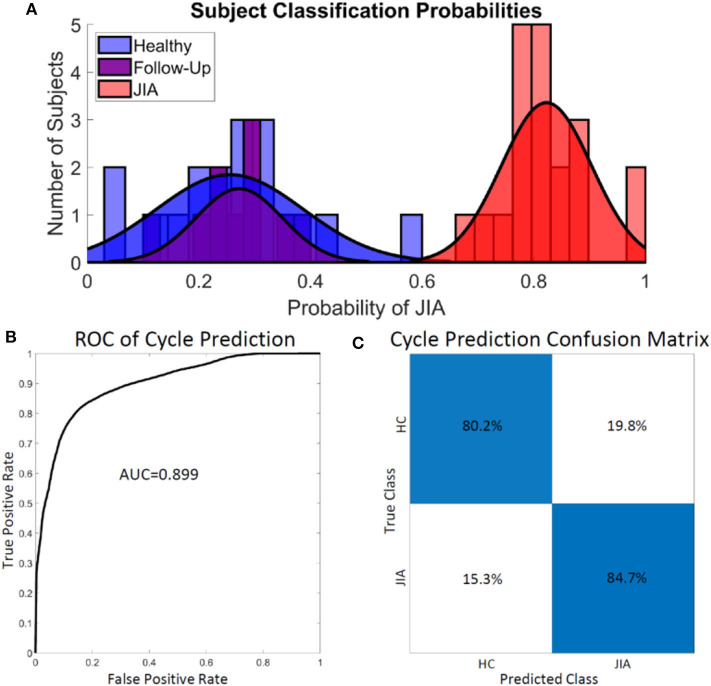
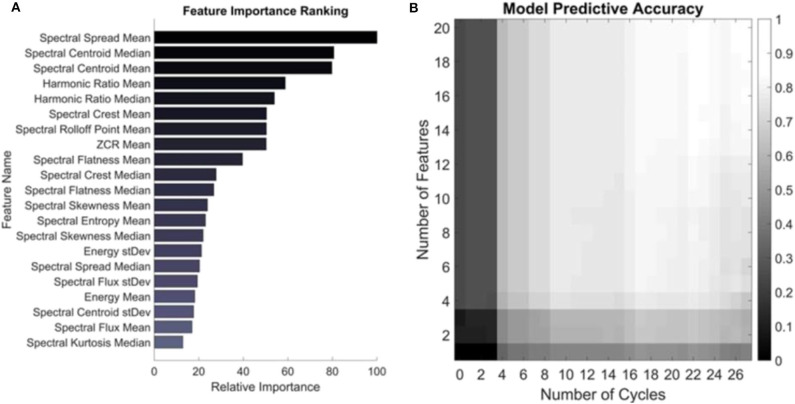
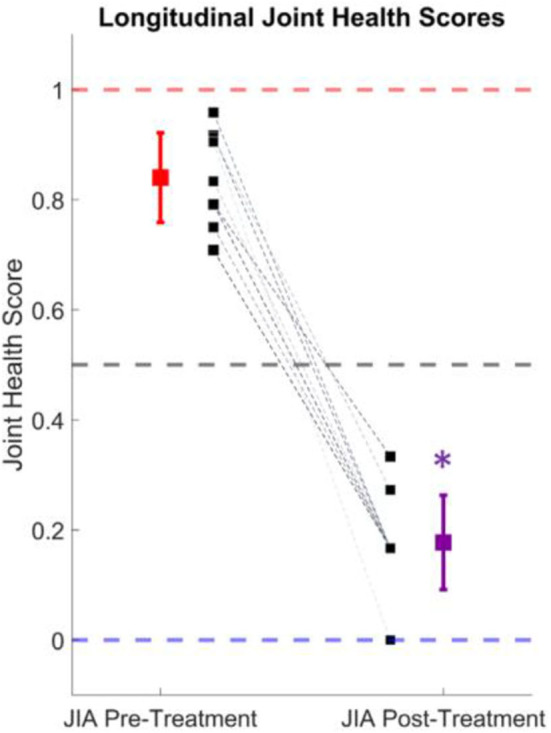
In this paper, we quantify the joint acoustic emissions (JAEs) from the knees of children with juvenile idiopathic arthritis (JIA) and support their use as a novel biomarker of the disease. JIA is the most common rheumatic disease of childhood; it has a highly variable presentation, and few reliable biomarkers which makes diagnosis and personalization of care difficult. The knee is the most commonly affected joint with hallmark synovitis and inflammation that can extend to damage the underlying cartilage and bone. During movement of the knee, internal friction creates JAEs that can be non-invasively measured. We hypothesize that these JAEs contain clinically relevant information that could be used for the diagnosis and personalization of treatment of JIA. In this study, we record and compare the JAEs from 25 patients with JIA-10 of whom were recorded a second time 3-6 months later-and 18 healthy age- and sex-matched controls. We compute signal features from each of those record cycles of flexion/extension and train a logistic regression classification model. The model classified each cycle as having JIA or being healthy with 84.4% accuracy using leave-one-subject-out cross validation (LOSO-CV). When assessing the full JAE recording of a subject (which contained at least 8 cycles of flexion/extension), a majority vote of the cycle labels accurately classified the subjects as having JIA or being healthy 100% of the time. Using the output probabilities of a JIA class as a basis for a joint health score and test it on the follow-up patient recordings. In all 10 of our 6-week follow-up recordings, the score accurately tracked with successful treatment of the condition. Our proposed JAE-based classification model of JIA presents a compelling case for incorporating this novel joint health assessment technique into the clinical work-up and monitoring of JIA.
Keywords: acoustic sensing; juvenile idiopathic arthiritis; machine learning; signal processing; wearable sensors.
Copyright © 2020 Whittingslow, Zia, Gharehbaghi, Gergely, Ponder, Prahalad and Inan.
Figures
Similar articles
-
Knee acoustic emissions as a noninvasive biomarker of articular health in patients with juvenile idiopathic arthritis: a clinical validation in an extended study population.Pediatr Rheumatol Online J. 2023 Jun 20;21(1):59. doi: 10.1186/s12969-023-00842-7. Pediatr Rheumatol Online J. 2023. PMID: 37340311 Free PMC article.
-
Acoustic Emissions From Loaded and Unloaded Knees to Assess Joint Health in Patients With Juvenile Idiopathic Arthritis.IEEE J Biomed Health Inform. 2021 Sep;25(9):3618-3626. doi: 10.1109/JBHI.2021.3081429. Epub 2021 Sep 3. IEEE J Biomed Health Inform. 2021. PMID: 34003759
-
Using Knee Acoustical Emissions for Sensing Joint Health in Patients with Juvenile Idiopathic Arthritis: A Pilot Study.IEEE Sens J. 2018 Nov;18(22):9128-9136. doi: 10.1109/JSEN.2018.2869990. Epub 2018 Sep 24. IEEE Sens J. 2018. PMID: 31097924 Free PMC article.
-
Imaging of the knee in juvenile idiopathic arthritis.Pediatr Radiol. 2018 Jun;48(6):818-827. doi: 10.1007/s00247-017-4015-6. Epub 2018 May 8. Pediatr Radiol. 2018. PMID: 29766248 Free PMC article. Review.
-
Magnetic resonance imaging of the knee joint in juvenile idiopathic arthritis.Reumatologia. 2020;58(6):416-423. doi: 10.5114/reum.2020.102007. Epub 2020 Dec 23. Reumatologia. 2020. PMID: 33456085 Free PMC article. Review.
Cited by
-
Knee acoustic emissions as a noninvasive biomarker of articular health in patients with juvenile idiopathic arthritis: a clinical validation in an extended study population.Pediatr Rheumatol Online J. 2023 Jun 20;21(1):59. doi: 10.1186/s12969-023-00842-7. Pediatr Rheumatol Online J. 2023. PMID: 37340311 Free PMC article.
-
Quantifying Signal Quality for Joint Acoustic Emissions Using Graph-Based Spectral Embedding.IEEE Sens J. 2021 Jun 15;21(12):13676-13684. doi: 10.1109/jsen.2021.3071664. Epub 2021 Apr 7. IEEE Sens J. 2021. PMID: 34658673 Free PMC article.
-
Classifying Pre-Radiographic Osteoarthritis of the Knee Using Wearable Acoustics Sensing at the Point of Care.IEEE Sens J. 2023 Oct 23;23(23):29619-21629. doi: 10.1109/jsen.2023.3325153. IEEE Sens J. 2023. PMID: 39507235 Free PMC article.
-
Validating Joint Acoustic Emissions Models as a Generalizable Predictor of Joint Health.IEEE Sens J. 2024 Apr 2;24(10):17219-17230. doi: 10.1109/jsen.2024.3382613. IEEE Sens J. 2024. PMID: 39507379 Free PMC article.
-
Quantitative ultrasound classification of healthy and chemically degraded ex-vivo cartilage.Sci Rep. 2025 Jul 1;15(1):20760. doi: 10.1038/s41598-025-07827-4. Sci Rep. 2025. PMID: 40596644 Free PMC article.
References
Grants and funding
LinkOut - more resources
Full Text Sources