. 2021 Dec;78(23):7709-7732.
doi: 10.1007/s00018-021-03997-2. Epub 2021 Oct 28.

GRP78 facilitates M2 macrophage polarization and tumour progression

Affiliations

GRP78 facilitates M2 macrophage polarization and tumour progression

Heng Zhang et al. Cell Mol Life Sci. 2021 Dec.

Abstract

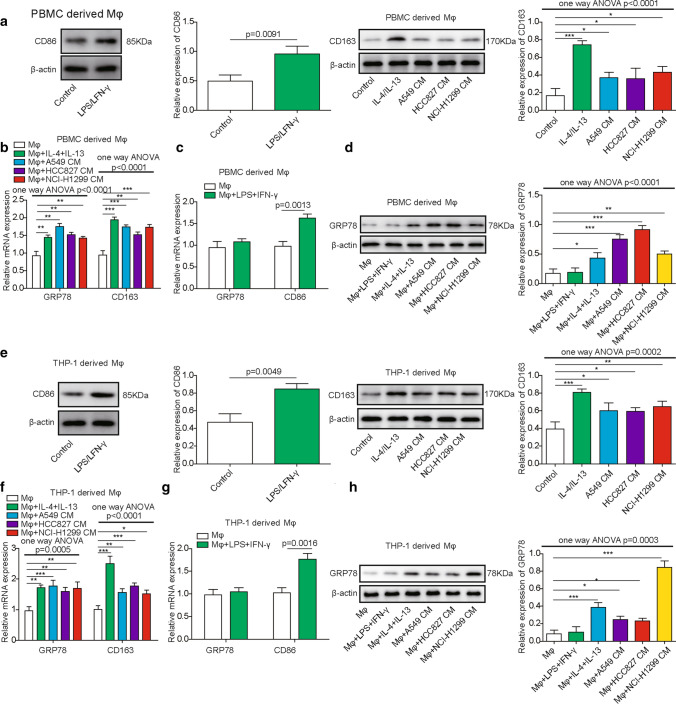
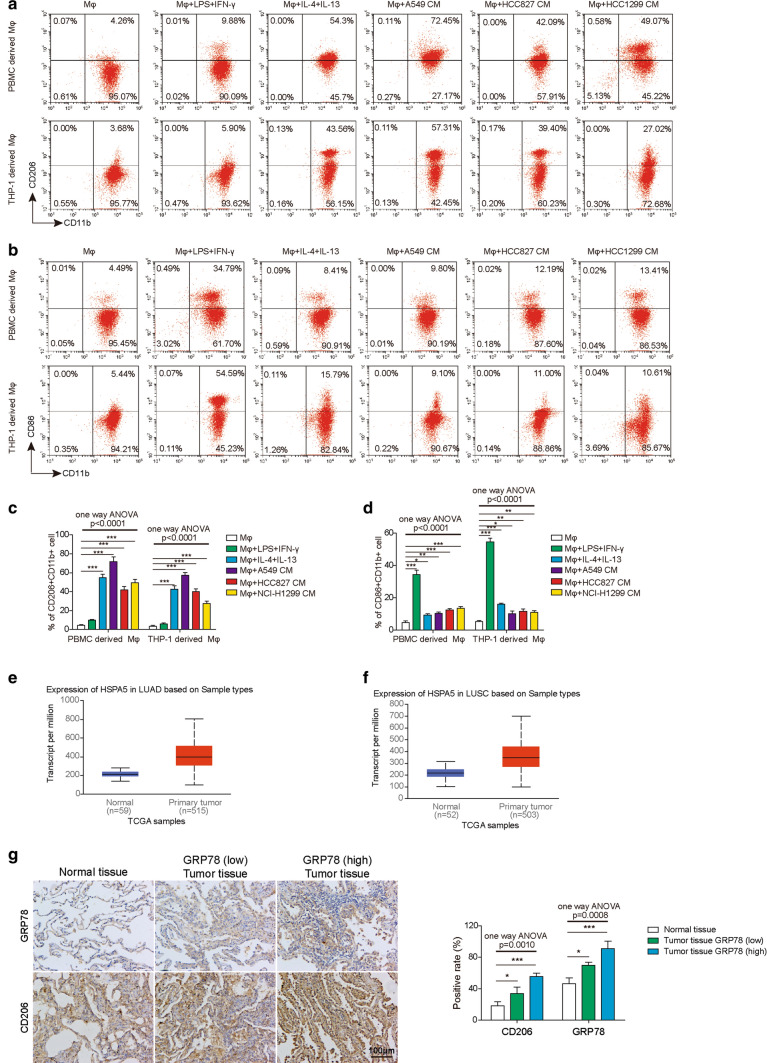
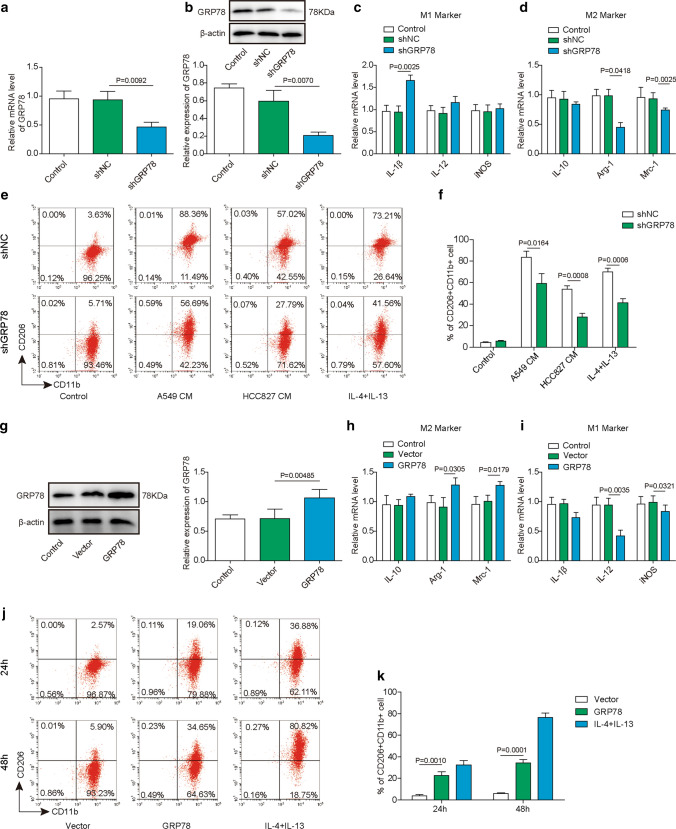
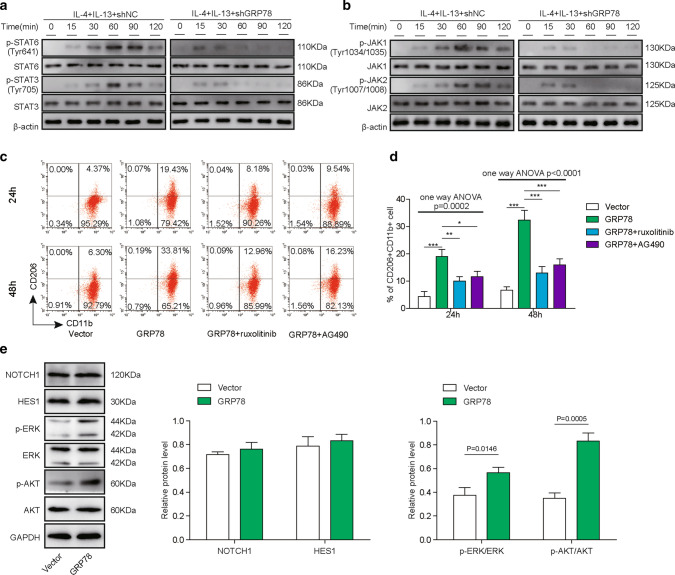
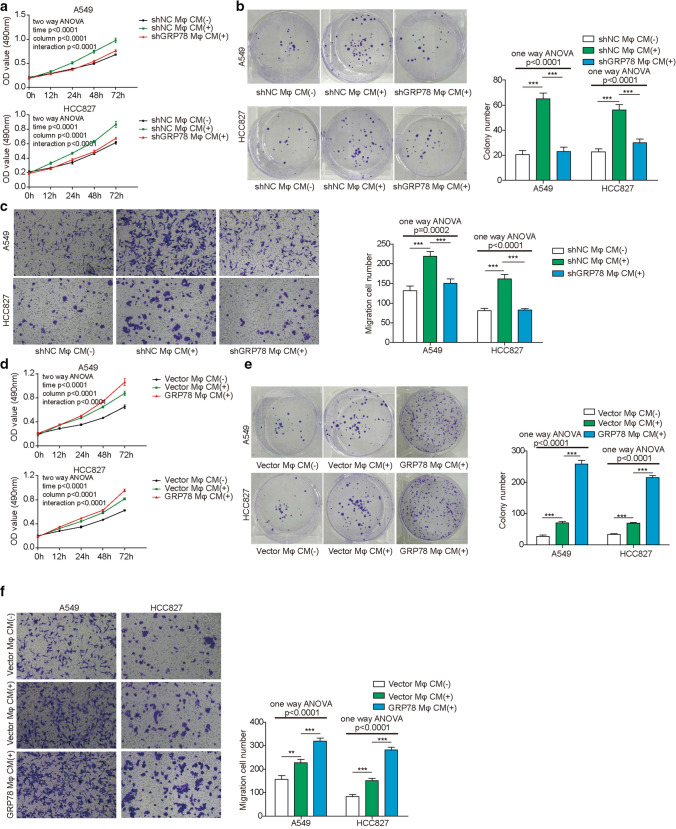
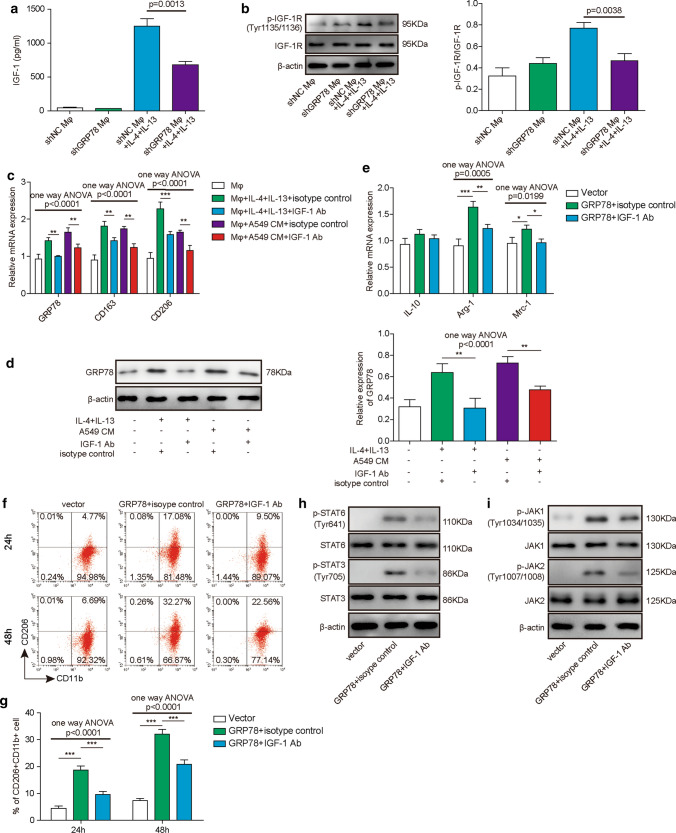
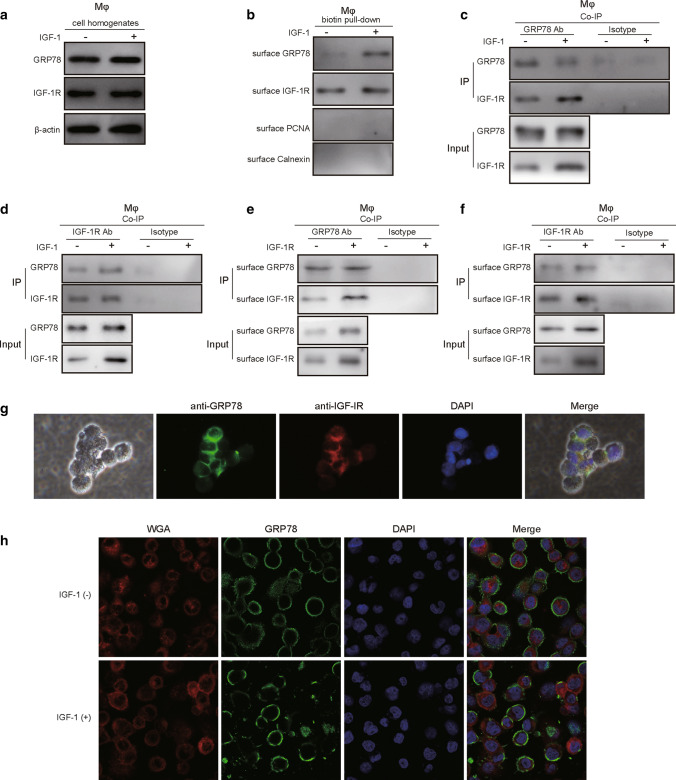
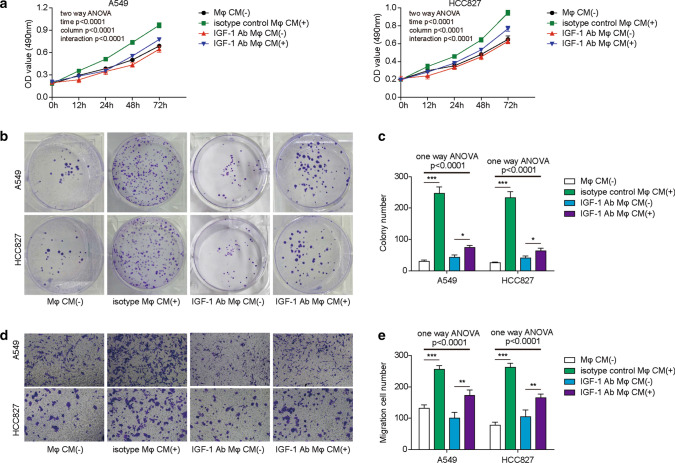
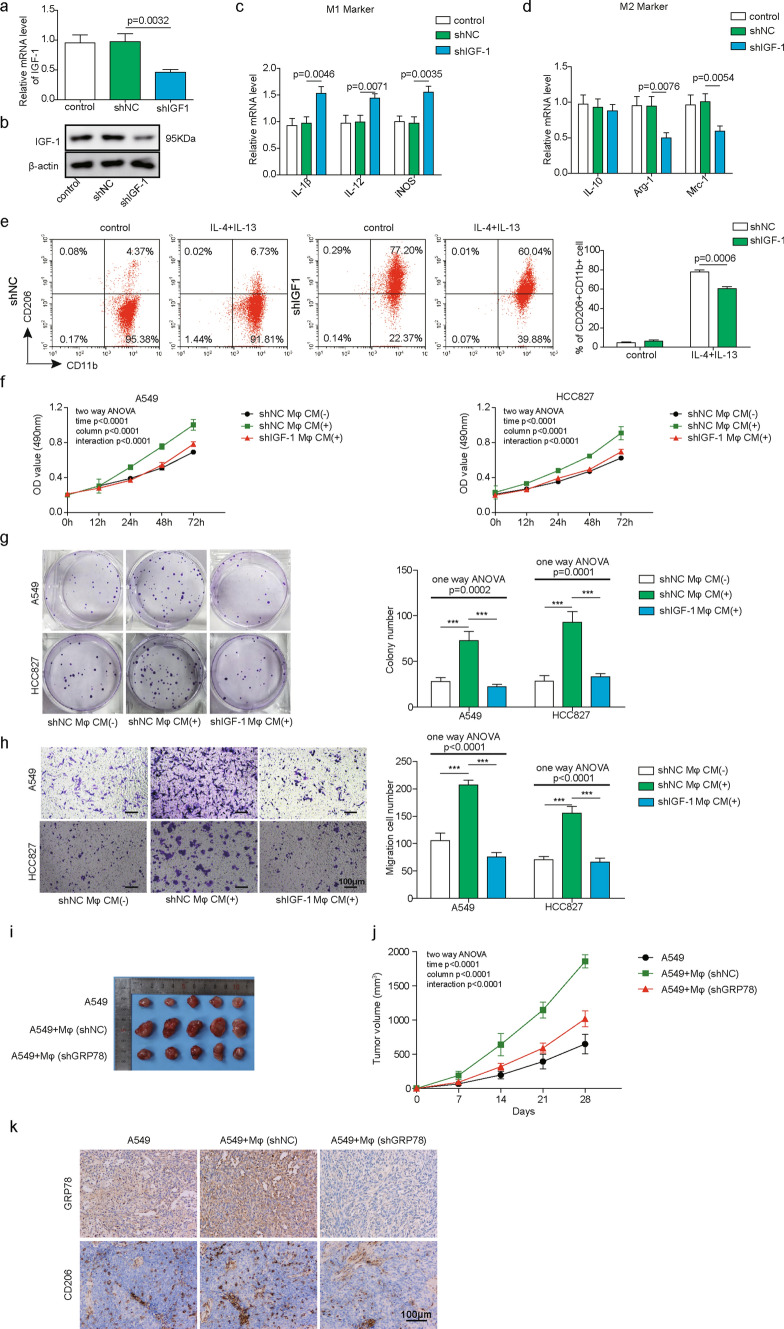
This study investigated the regulation of GRP78 in tumour-associated macrophage polarization in lung cancer. First, our results showed that GRP78 was upregulated in macrophages during M2 polarization and in a conditioned medium derived from lung cancer cells. Next, we found that knocking down GRP78 in macrophages promoted M1 differentiation and suppressed M2 polarization via the Janus kinase/signal transducer and activator of transcription signalling. Moreover, conditioned medium from GRP78- or insulin-like growth factor 1-knockdown macrophages attenuated the survival, proliferation, and migration of lung cancer cells, while conditioned medium from GRP78-overexpressing macrophages had the opposite effects. Additionally, GRP78 knockdown reduced both the secretion of insulin-like growth factor 1 and the phosphorylation of the insulin-like growth factor 1 receptor. Interestingly, insulin-like growth factor 1 neutralization downregulated GRP78 and suppressed GRP78 overexpression-induced M2 polarization. Mechanistically, insulin-like growth factor 1 treatment induced the translocation of GRP78 to the plasma membrane and promoted its association with the insulin-like growth factor 1 receptor. Finally, IGF-1 blockade and knockdown as well as GRP78 knockdown in macrophages inhibited M2 macrophage-induced survival, proliferation, and migration of lung cancer cells both in vitro and in vivo.

Keywords: JAK1/2; NSCLC; STAT3/6; TAM.


Conflict of interest statement

The authors declare that they have no conflict of interest.

Figures

Fig. 1
Fig. 1
Upregulation of GRP78 in macrophages upon M2 polarization. AD Human PBMC-derived macrophages were generated from CD14+ monocytes and then polarized to M1 or M2 macrophages for 48 h. In parallel, tumour cell-derived CM was used to culture macrophages, which were pretreated with GM-CSF or M-CSF, for 48 h. A After M1 or M2 polarization, the expression of CD86 or CD163 in M1 or M2 macrophages was assessed by western blotting. β-actin was used as the loading control. N = 6. B The relative expression of GRP78 and CD163 in PBMC-derived macrophages in response to the indicated treatments was assessed by qPCR. N = 6. C The relative expression of GRP78 and CD86 in macrophages treated without or with LPS/IFN-γ was measured by qPCR. N = 6. D The expression of GRP78 in PBMC-derived macrophages in response to the indicated treatments was determined by western blotting, and β-actin was used as the loading control. N = 6. EH THP-1 cells were first differentiated into Mφs for 24 h and were then polarized to M1 or M2 macrophages for 48 h. E The expression of CD86 or CD163 in M1 or M2 macrophages was assessed by western blotting. β-actin was used as the loading control. N = 6. The normalized expression of CD86 or CD163 to β-actin in macrophages in response to the indicated treatments is shown on the right in histograms. F Tumour cell-derived CM was used to culture macrophages, which were pretreated with GM-CSF or M-CSF, for 48 h. The relative expression of GRP78 and CD163 in THP-1-derived macrophages after the indicated treatments was assessed by qPCR. N = 6. G The relative expression of GRP78 and CD86 in THP-1-derived macrophages treated without or with LPS/IFN-γ was measured by qPCR. N = 6. H The expression of GRP78 in THP-1-derived macrophages in response to the indicated treatments was determined by western blotting, and β-actin was used as the loading control. N = 6. The normalized expression of GRP78 to β-actin in macrophages in response to the indicated treatments is shown in the right histograms. All results are representative of three independent experiments. Error bars represent the mean ± SD. p values were determined by unpaired two-tailed t test (A, C, E, G) or one-way analysis of variance (ANOVA) followed by Tukey’s post hoc test (A, B, D, E, F, H). ***p < 0.001, **p < 0.01, *p < 0.05
Fig. 2
Fig. 2
Upregulation of GRP78 in macrophages upon M2 polarization. A Representative flow cytometry image of M2 macrophages in each group is shown. B Representative flow cytometry image of M1 macrophages in each group is shown in each group. C The proportions of M2 macrophages in each group were determined by flow cytometry. N = 6. D The proportions of M1 macrophages in each group were determined by flow cytometry. N = 6. E The expression of GRP78 in human lung adenocarcinoma (LUAD) tumour samples and normal tissues in TCGA database. F The expression of GRP78 in human lung squamous cell carcinoma (LUSC) tumour samples and normal tissues in TCGA database. G The expression of GRP78 and CD206 in human lung tumour samples and normal tissues by IHC staining. All results are representative of three independent experiments. Error bars represent the mean ± SD. p values were determined by one-way analysis of variance (ANOVA) followed by Tukey’s post hoc test (C, D). ***p < 0.001, **p < 0.01, *p < 0.05
Fig. 3
Fig. 3
GRP78 is required for the M2 polarization of macrophages. AF PBMC-derived macrophages were transfected with the indicated shRNAs by lentivirus. A The relative expression of GRP78 in each group of cells was measured by qPCR. N = 6. B The knockdown efficiency of GRP78 was further verified by western blotting, and β-actin was used as the loading control in western blotting. N = 6. C, D After shRNA transduction, PBMC-derived macrophages were polarized to M1 or M2 macrophages for 48 h. The relative expression of the M1 markers IL-1β, IL-12 and iNOS (C) and the M2 markers IL-10, Arg-1 and Mrc-1 (D) was determined by qPCR. N = 6. E, F shRNA-transfected cells were then cocultured with control medium, A549 CM, HCC827 CM or IL-4/IL-13 for another 48 h. E The polarization of M2 macrophages was analysed by FACS using the M2 surface marker CD11b+CD206+. N = 6. F Statistical analysis of the proportions of M2 macrophages in E. GK Macrophages were untransfected or transfected with the indicated plasmid. G The expression of GRP78 was assessed by western blotting, and β-actin was used as the loading control. N = 6. The normalized GRP78 expression to β-actin is shown on the right. HI After transfection, PBMC-derived macrophages were polarized to M1 or M2 macrophages for 48 h. The relative expression of the M2 markers IL-10, Arg-1, and Mrc-1 (H) and the M1 markers IL-1β, IL-12, and iNOS (I) was determined by qPCR. N = 6. J, K After transfection, PBMC-derived macrophages were then cultured without or with IL-4 and IL-13 for 48 h. J The polarization of M2 macrophages was analysed by FACS using the M2 surface marker CD11b+CD206+. N = 6. K Statistical analysis of the proportions of M2 macrophages in J. A, C, D, H, I mRNA expression was normalized to that of GAPDH, and the experiments were performed in triplicate. AJ The results are representative of three independent experiments. A, C, D, F, H, I, K Error bars represent the mean ± SD. p values were determined by one-way analysis of variance (ANOVA) followed by Tukey’s post hoc test (A, C, D, H, I, K) or unpaired t test (F). ***p < 0.001, **p < 0.01, *p < 0.05
Fig. 4
Fig. 4
GRP78-induced M2 macrophage polarization is dependent on JAK/STAT activation. A, B PBMC-derived macrophages were transfected with the indicated shRNAs and then cultured for the indicated time in the presence of 20 ng/mL IL-4 and 20 ng/mL IL-13. The phosphorylation and total content of STAT6 and STAT3 (A) and JAK1 and JAK2 (B) were measured by western blotting. β-actin was used as the loading control. N = 6. C, D Macrophages were transfected with the indicated plasmid and then cultured for 24 h or 48 h without or with the JAK1/2 inhibitor ruxolitinib at 100 nM or the JAK1 inhibitor AG490 at 10 μM. C The polarization of M2 macrophages was analysed by FACS. N = 6. D Statistical analysis of the proportions of M2 macrophages in C. E PBMC-derived macrophages were transfected with the empty vector or GRP78-overexpressing plasmid and then cultured in the presence of 20 ng/mL IL-4 and 20 ng/mL IL-13 for 48 h. The expression of NOTCH1 and HES1 and the phosphorylation and total content of AKT and ERK were measured by western blotting, and GAPDH was used as the loading control. N = 6 AE The results are representative of three independent experiments. D, E Error bars represent the mean ± SD. p values were determined by one-way analysis of variance (ANOVA) followed by Tukey’s post hoc test. ***p < 0.001, **p < 0.01, *p < 0.05
Fig. 5
Fig. 5
GRP78 expression in macrophages affects the proliferation and migration of lung cancer cells. PBMC-derived macrophages were transfected with the indicated shRNAs (AC) or plasmids (DF), and then they were polarized to M2 macrophages for 48 h. CM was collected to culture A549 and HCC827 cells with fresh RPMI 1640 medium at a ratio of 1:1 for the indicated assays. A, D The proliferation of A549 and HCC827 cells was assessed by MTT assay at the indicated times. N = 5. B, E The survival and proliferation of A549 and HCC827 cells were determined by colony formation assay and statistical analysis of the colony numbers. N = 5. C, F The migration of A549 and HCC827 cells was measured by Transwell assay and statistical analysis of the migrated cells. N = 5. The results are representative of three independent experiments. Error bars represent the mean ± SD. p values were determined by one-way analysis of variance (ANOVA) (B, C, E, F) or two-way ANOVA (A, D) followed by Tukey’s post hoc test. ***p < 0.001, **p < 0.01, *p < 0.05
Fig. 6
Fig. 6
The IGF-1/IGF-1R signaling pathway is implicated in GRP78-induced M2 macrophages. A, B PBMC-derived macrophages were transfected with the indicated shRNAs and then cultured in the absence or presence of IL-4/IL-13 for 48 h. A The concentration of secreted IGF-1 in the supernatant was assessed by ELISA. N = 6. B The phosphorylation and total content of IGF-1R were measured by western blotting, and β-actin was used as the loading control. N = 6. C, D Macrophages were cultured alone or with IL-4/IL-13 or A549 CM in the presence of the IGF-1 neutralizing antibody or isotype control antibody for 48 h. C The relative expression of GRP78, CD163 and CD206 was determined by qPCR. The mRNA expression was normalized to that of GAPDH, and the experiments were performed in triplicate. N = 6. D The expression of GRP78 protein was assessed by western blotting, and β-actin was used as the loading control. N = 6. EI Macrophages were transfected with the indicated plasmid and then cultured with isotype control antibody or IGF-1 neutralizing antibody for 24 h or 48 h, respectively. E The relative expression of IL-10, Arg-1 and Mrc-1 was measured by qPCR after 48 h of culture. The mRNA expression was normalized to that of GAPDH, and the experiments were performed in triplicate. N = 6. F The polarization of M2 macrophages was analysed by FACS after 24 h or 48 h of culture. N = 6. G Statistical analysis of M2 polarization in F. HI The phosphorylation and total content of STAT6 and STAT3 (H) and JAK1 and JAK2 (I) were measured by western blotting. β-actin was used as the loading control. (AF, HI) The results are representative of three independent experiments. (A, C, E, G) Error bars represent the mean ± SD. p values were determined by one-way analysis of variance (ANOVA) followed by Tukey’s post hoc test. ***p < 0.001, **p < 0.01, *p < 0.05
Fig. 7
Fig. 7
IGF-1 induces the translocation of GRP78 to the plasma membrane and its association with IGF-1R. A, B PBMC-derived macrophages were treated with or without 100 ng/mL IGF-1 for 24 h, and then the cell surface proteins were isolated via biotinylation and streptavidin pulldown. A Total cell lysates were analysed by western blotting to determine the expression of GRP78 and IGF-1R, and β-actin was used as the loading control. N = 4. B Pulled-down cell surface proteins were subjected to western blotting to assess the amount of GRP78 on the plasma membrane. The nuclear marker protein PCNA and ER marker protein calnexin were utilized as indicators to show the purity of the surface protein fractions. N = 4. C, D Macrophages were treated with or without 10 ng/mL IGF-1 for 24 h, and then the cells were lysed and subjected to immunoprecipitation using antibodies against GRP78 (C) or IGF-1R (D). The associated IGF-1R (C) or GRP78 (D) was analysed by western blotting. N = 4. (E–F) Macrophages were treated without or with IGF-1 for 24 h, and then the cell surface proteins were isolated via biotinylation and streptavidin pulldown. Cell surface proteins were then used to perform immunoprecipitation with antibodies against GRP78 (E) or IGF-1R (F), and the associated IGF-1R (E) or GRP78 (F) was analysed by western blotting. N = 4. G Macrophages were fixed, permeabilized and stained with Alexa Fluor 488-conjugated mouse anti-human GRP78 antibody plus Alexa Fluor 555-conjugated rabbit anti-human IGF-1R antibody, which were then imaged with fluorescence microscopy. Cell nuclei were stained with DAPI. Scale bar, 20 μm. H Macrophages were treated without or with IGF-1 for 24 h, then they were fixed, permeabilized and stained with Alexa Fluor 488-conjugated mouse anti-human GRP78 antibody plus Alexa Fluor 555-conjugated Wheat Germ Agglutinin (WGA, which was used as the plasma membrane marker), which were then imaged with fluorescence microscopy. Cell nuclei were stained with DAPI. Scale bar, 20 μm. AH The results are representative of three independent experiments
Fig. 8
Fig. 8
IGF-1 blockade in M2 macrophages suppresses the proliferation and migration of lung cancer cells. AE After induction, M2 macrophages were cultured in RPMI 1640 medium for 48 h. Then, CM was collected for subsequent experiments. A A549 and HCC827 cells were cultured in normal medium, or macrophage CM supplemented with 5 μg/mL isotype control or 5 μg/mL IGF-1 neutralizing antibody. The proliferation of A549 and HCC827 cells was assessed by MTT assay at the indicated times. N = 5. B The survival and proliferation of A549 and HCC827 cells were determined by colony formation assay after 14 days of culture. N = 5. C Statistical analysis of the colony numbers in C. D The migration of A549 and HCC827 cells was measured by Transwell assay after 15 h of culture. N = 5. E Statistical analysis of the migrated cells in E. A, C, E The results are representative of three independent experiments. A, C, E Error bars represent the mean ± SD. p values were determined by one-way analysis of variance (ANOVA) (C, E) or two-way ANOVA (A) followed by Tukey’s post hoc test. ***p < 0.001
Fig. 9
Fig. 9
IGF-1 is required for polarization and the proliferation and migration of lung cancer cells. AH PBMC-derived macrophages were transfected with the indicated plasmid by lentivirus. A The relative expression of IGF-1 in macrophages was measured by qPCR. The mRNA expression was normalized to that of GAPDH, and the experiments were performed in triplicate. N = 5. B The knockdown efficiency of IGF-1 was further verified by western blotting, and β-actin was used as the loading control. N = 5. CE After shRNA transduction, PBMC-derived macrophages were polarized to M1 or M2 macrophages for 48 h. C, D The relative expression of the M1 markers IL-1β, IL-12 and iNOS (C) and the M2 markers IL-10, Arg-1 and Mrc-1 (D) was determined by qPCR. The mRNA expression was normalized to that of GAPDH, and the experiments were performed in triplicate. N = 5. E After shRNA transduction, PBMC-derived macrophages were polarized to M2 macrophages for 48 h, which was then analysed by FACS and statistical analysis of the proportions of M2 macrophages. N = 5. FH Forty-eight hours later, macrophage CM was collected to culture A549 and HCC827 cells for the indicated assays. F The proliferation of A549 and HCC827 cells was assessed by MTT assay at the indicated times. N = 5. G The survival and proliferation of A549 and HCC827 cells were determined by colony formation assay and statistical analysis of the colony numbers. N = 5. H The migration of A549 and HCC827 cells was measured by Transwell assay (left panel). Scale bar, 50 μm. The statistical analysis of the migrated cells is shown in the right panel. IK Six-week-old nude mice were subcutaneously injected with 2 × 106 A549 cells, a mixture of 2 × 106 A549 cells plus 1 × 106 shNC-transfected M2 macrophages, or a mixture of 2 × 106 A549 cells and 1 × 106 shGRP78-transfected M2 macrophages. N = 5. I Four weeks later, the mice were euthanized, and the tumour tissues were dissected for analysis. J The tumour growth kinetics were monitored by measuring the tumour volume every 7 days. K The expression of GRP78 in xenografted NSCLC tumour samples and in tumour-associated macrophages was measured by IHC. Scale bar, 100 μm. AE, GH The results are representative of three independent experiments. F, I, J The results are representative of five independent experiments. A, C, D, F, G, H, J, K, M Error bars represent the mean ± SD. p values were determined by one-way analysis of variance (ANOVA) (A, C, D, G, H), two-way ANOVA (F, J) or by unpaired two-tailed t test (E). ***p < 0.001, **p < 0.01, *p < 0.05

References

    1. Gridelli C, Rossi A, Carbone DP, Guarize J, Karachaliou N, Mok T, et al. Non-small-cell lung cancer. Nat Rev Dis Primers. 2015;1:15009. - PubMed
    1. Graves EE, Maity A, Le QT. The tumor microenvironment in non-small-cell lung cancer. Semin Radiat Oncol. 2010;20(3):156–163. - PMC - PubMed
    1. Wood SL, Pernemalm M, Crosbie PA, Whetton AD. The role of the tumor-microenvironment in lung cancer-metastasis and its relationship to potential therapeutic targets. Cancer Treat Rev. 2014;40(4):558–566. - PubMed
    1. Shimizu K, Okita R, Nakata M. Clinical significance of the tumor microenvironment in non-small cell lung cancer. Ann Transl Med. 2013;1(2):20. doi: 10.3978/j.issn.2305-5839.2013.06.01. - DOI - PMC - PubMed
    1. Fuster MM. Targeting the lung cancer microenvironment: harnessing host responses. In: Takiguchi Y, editor. Molecular targeted therapy of lung cancer. Singapore: Springer Singapore; 2017. pp. 309–327.

MeSH terms