. 2022 Mar;36(7-9):550-566.
doi: 10.1089/ars.2021.0047.

Renal NOXA1/NOX1 Signaling Regulates Epithelial Sodium Channel and Sodium Retention in Angiotensin II-induced Hypertension

Affiliations

Renal NOXA1/NOX1 Signaling Regulates Epithelial Sodium Channel and Sodium Retention in Angiotensin II-induced Hypertension

Aleksandr E Vendrov et al. Antioxid Redox Signal. 2022 Mar.

Abstract

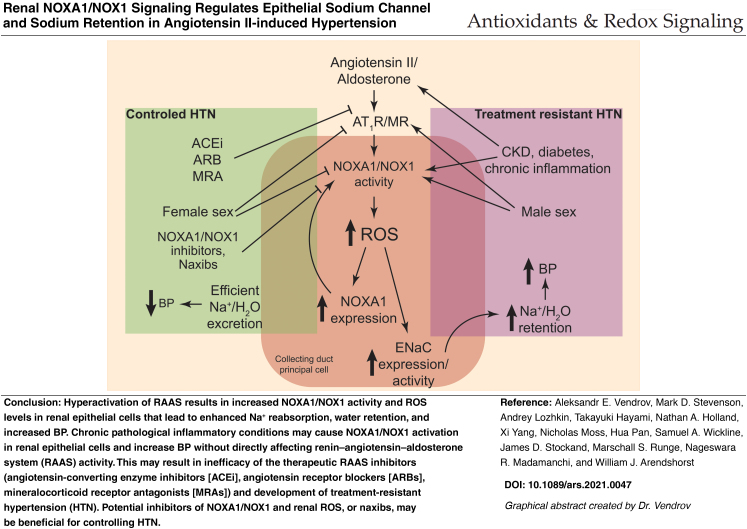
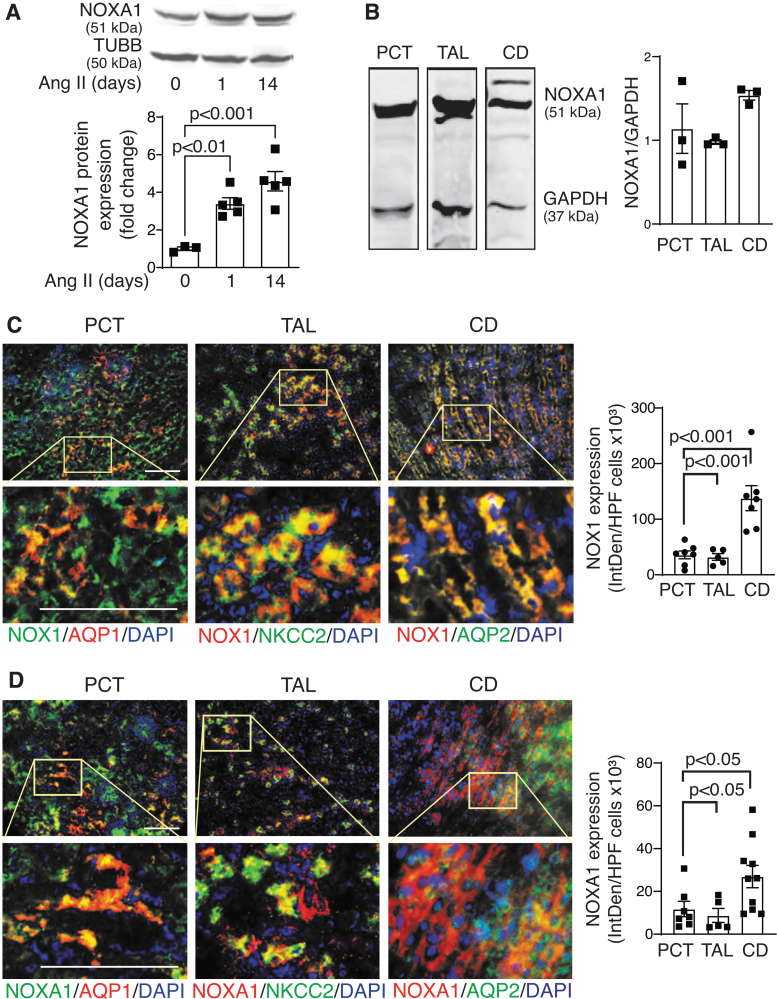
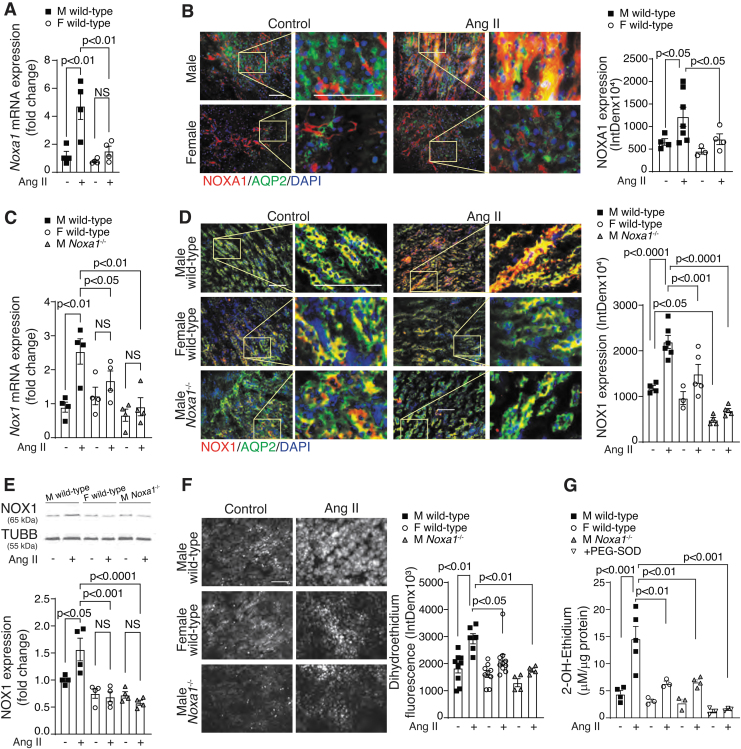
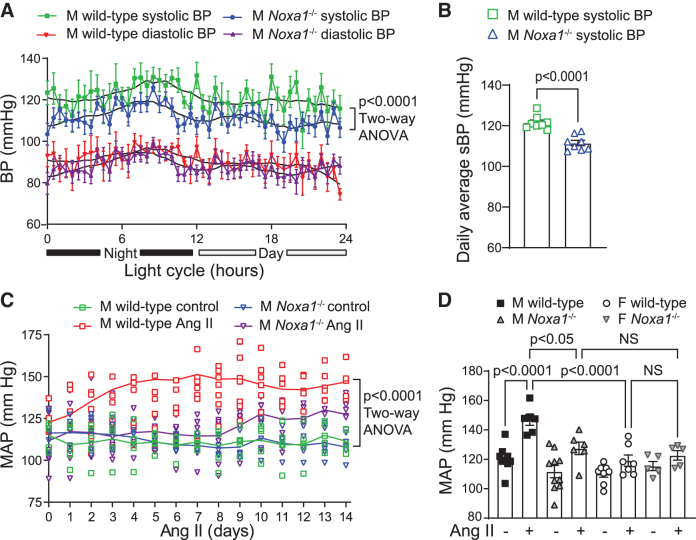
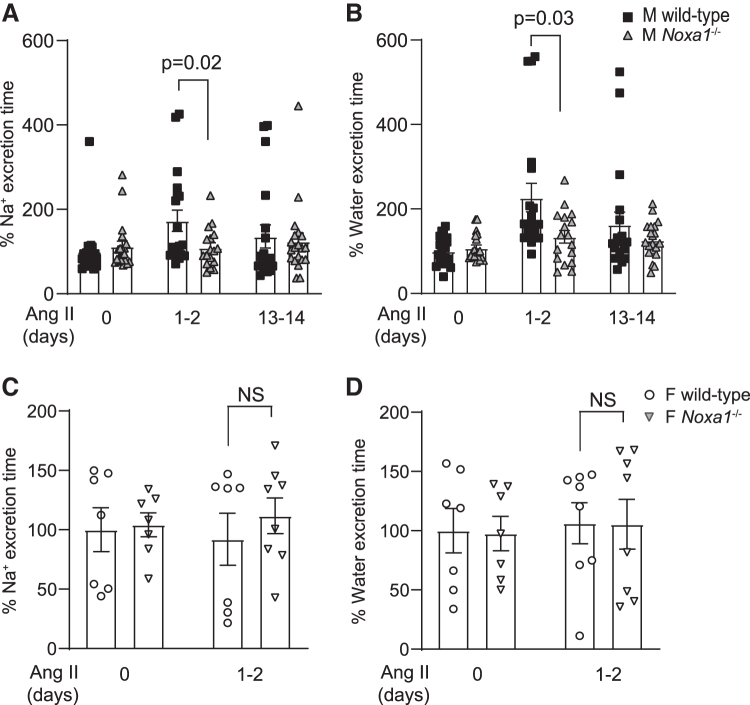
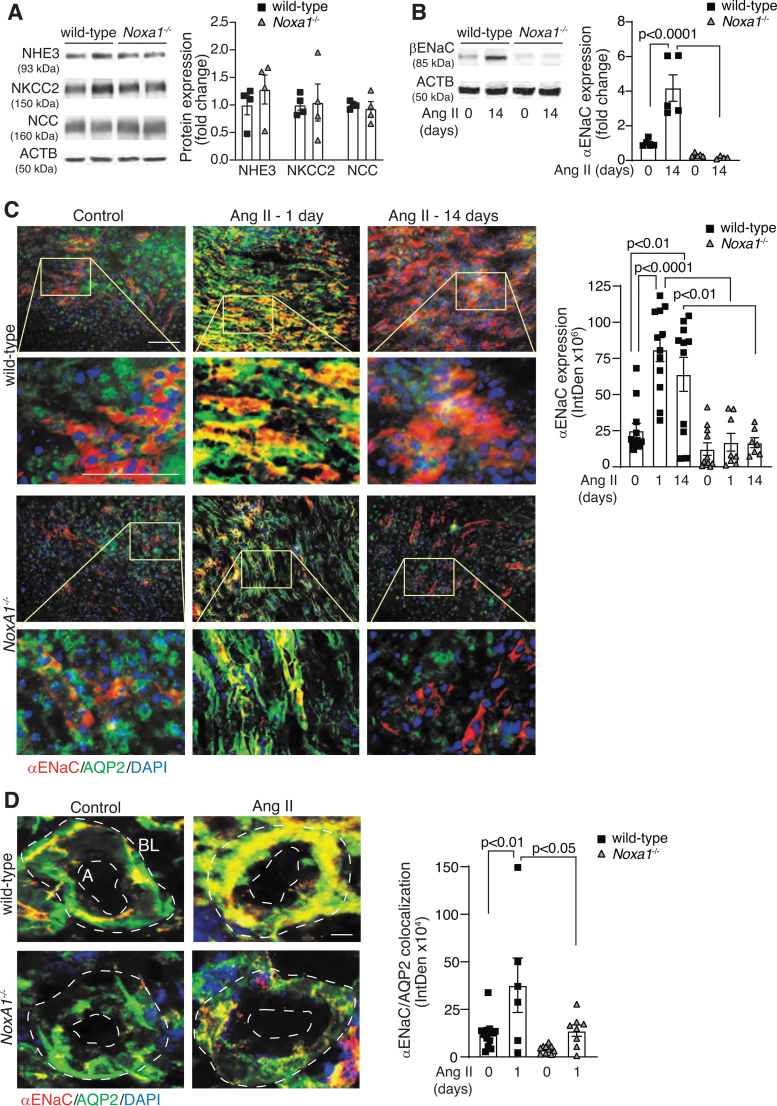
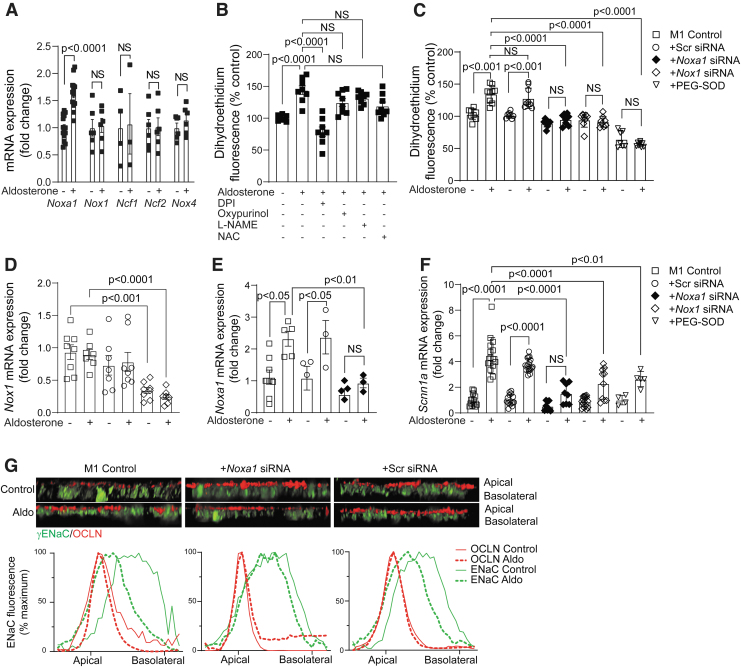
Aims: NADPH oxidase (NOX)-derived reactive oxygen species (ROS) are implicated in the pathophysiology of hypertension in chronic kidney disease patients. Genetic deletion of NOX activator 1 (Noxa1) subunit of NOX1 decreases ROS under pathophysiological conditions. Here, we investigated the role of NOXA1-dependent NOX1 activity in the pathogenesis of angiotensin II (Ang II)-induced hypertension (AIH) and possible involvement of abnormal renal function. Results: NOXA1 is present in epithelial cells of Henle's thick ascending limb and distal nephron. Telemetry showed lower basal systolic blood pressure (BP) in Noxa1-/-versus wild-type mice. Ang II infusion for 1 and 14 days increased NOXA1/NOX1 expression and ROS in kidney of male but not female wild-type mice. Mean BP increased 30 mmHg in wild-type males, with smaller increases in Noxa1-deficient males and wild-type or Noxa1-/- females. In response to an acute salt load, Na+ excretion was similar in wild-type and Noxa1-/- mice before and 14 days after Ang II infusion. However, Na+ excretion was delayed after 1-2 days of Ang II in male wild-type versus Noxa1-/- mice. Ang II increased epithelial Na+ channel (ENaC) levels and activation in the collecting duct principal epithelial cells of wild-type but not Noxa1-/- mice. Aldosterone induced ROS levels and Noxa1 and Scnn1a expression and ENaC activity in a mouse renal epithelial cell line, responses abolished by Noxa1 small-interfering RNA. Innovation and Conclusion: Ang II activation of renal NOXA1/NOX1-dependent ROS enhances tubular ENaC expression and Na+ reabsorption, leading to increased BP. Attenuation of AIH in females is attributed to weaker NOXA1/NOX1-dependent ROS signaling and efficient natriuresis. Antioxid. Redox Signal. 36, 550-566.

Keywords: epithelial sodium channels; hypertension; kidney; reactive oxygen species; sex difference; tubular epithelial cells.


Conflict of interest statement

S.A.W. has equity in Altamira Therapeutics Ltd. M.S.R. is a member of the Board of Directors at Eli Lilly and Company.

Figures

None
Color images are available online.
FIG. 1.
FIG. 1.
NOXA1 protein expression in kidney is regulated by Ang II. (A) Western blot analysis and quantification of NOXA1 expression in kidney lysates after 1 and 14 days of Ang II treatment. Data are NOXA1 protein fold change relative to untreated control adjusted for β-tubulin levels (mean ± SEM). (B) Western blot analysis and relative expression quantification of protein extracts from isolated PCT, TAL, and CD. (C) Representative immunofluorescence images and quantification of immunoreactive NOX1 and AQP1 (colocalized to PCT), NKCC2 (colocalized to TAL), or AQP2 (colocalized to CD) in wild-type kidney frozen sections (mean ± SEM). High magnification insets (yellow rectangle) show NOX1 expression in epithelial cell. Scale is 100 μm. (D) Representative immunofluorescence images and quantification stained for immunoreactive NOXA1 and AQP1 (colocalized to PCT), NKCC2 (colocalized to TAL), or AQP2 (colocalized to CD) in wild-type kidney frozen sections (mean ± SEM). High magnification insets (yellow rectangle) show NOXA1 expression in epithelial cell. Scale is 100 μm. Ang II, angiotensin II; AQP1, aquaporin 1; CD, collecting ducts; NKCC2, Na-K-Cl cotransporter 2; NOX, NADPH oxidase; NOXA1, NOX activator 1; PCT, proximal convoluted tubules; TAL, thick ascending limb.
FIG. 2.
FIG. 2.
NOXA1 expression is correlated with renal ROS levels in kidneys from wild-type mice treated with Ang II. (A) Real-time PCR analysis of Noxa1 mRNA expression in kidneys from male (M) and female (F) mice treated with vehicle or Ang II for 14 days. Data are mean ± SEM of mRNA expression fold change relative to vehicle-treated control adjusted for 18s RNA levels. (B) Representative immunofluorescence images and quantification of NOXA1 (red) levels in the AQP2-stained CD epithelial cells (green) in the kidney sections of male and female mice treated with vehicle or Ang II for 14 days. High magnification insets (yellow rectangle) show NOXA1 expression in CD epithelial cell. Scale is 100 μm. Data are fluorescence integrated density (mean ± SEM). (C) Real-time PCR analysis of Nox1 mRNA expression in kidneys from male wild-type and Noxa1−/− and female wild-type mice treated with vehicle or Ang II for 14 days. Data are mean ± SEM of mRNA expression fold change relative to vehicle-treated control adjusted for 18s RNA levels. (D) Representative immunofluorescence images and quantification of NOX1 (red) levels in the AQP2-positive CD epithelial cells (green) in the kidney sections of male and female wild-type and male Noxa1−/− mice treated with vehicle or Ang II for 14 days. High magnification insets (yellow rectangle) show NOX1 expression in CD epithelial cell. Scale is 100 μm. Data are fluorescence integrated density (mean ± SEM). (E) Western blot analysis and quantification of NOX1 protein expression in whole kidney lysates from mice treated with vehicle or Ang II for 14 days. Data are mean ± SEM of protein levels fold change relative to vehicle-treated control adjusted for TUBB levels. (F) ROS levels were determined by DHE fluorescence in the coronal renal sections of male and female wild-type and male Noxa1−/− mice treated with vehicle or Ang II for 14 days. Data are DHE fluorescence integrated density (mean ± SEM). (G) Superoxide levels in kidney samples from mice treated with vehicle or Ang II for 14 days were determined by 2-OH-ethidium HPLC. Data were normalized to tissue protein concentration (mean ± SEM). DHE, dihydroethidium; PCR, polymerase chain reaction; ROS, reactive oxygen species; TUBB, β-tubulin.
FIG. 3.
FIG. 3.
Noxa1 deletion reduces basal and Ang II-induced BP in male mice. (A) BP telemetry recordings averaged for 5 min every 30 min over 24-h period in untreated male (M) wild-type and Noxa1−/− mice (mean ± SEM, n = 8). Individual values for each animal are shown in Supplementary Figure S3. Black solid lines represent averages of 7 nearest neighbor values using second-order smoothing polynomial. (B) Daily average of sBP telemetry recordings in untreated male wild-type and Noxa1−/− mice (mean ± SEM). (C) Mean BP telemetry recordings in male wild-type and Noxa1−/− mice treated with vehicle or Ang II for 14 days. Data are mean ± SEM of daily average BP. (D) Mean BP telemetry recordings in male (M) and female (F) wild-type and Noxa1−/− mice treated with vehicle or Ang II for 14 days. Data are mean ± SEM of daily average BP. BP, blood pressure; sBP, systolic BP.
FIG. 4.
FIG. 4.
Cumulative sodium and volume excretion is delayed in male wild-type mice compared with Noxa1/ male and female wild-type mice during the initial phase of AIH. Time to excrete 75% of the sodium (A) and water (B) following the acute isotonic saline load in male wild-type and Noxa1−/− mice during the control period and Ang II infusion days 1–2 and 13–14. Data are mean ± SEM % over control. Time to excrete 75% of the sodium (C) and water (D) following the acute salt load in female wild-type and Noxa1−/− mice during the control period and Ang II administration for 1–2 days. Data are mean ± SEM % over control. AIH, Ang II-induced hypertension.
FIG. 5.
FIG. 5.
Renal expression of ENaC is increased in male wild-type mice treated with Ang II. (A) Western blot analysis and densitometry quantification of the sodium channels NHE3, NKCC2, and NCC expression in mice treated with Ang II for 14 days. Data are fold change in protein expression adjusted for ACTB levels and relative to wild-type (mean ± SEM). (B) Western blot analysis and densitometry quantification of βENaC levels in renal lysates from wild-type and Noxa1−/− mice treated with vehicle or Ang II for 14 days. Data are protein fold change adjusted for ACTB levels and relative to control (mean ± SEM). (C) Representative immunofluorescence images and quantification of αENaC expression in the renal sections from wild-type and Noxa1−/− mice treated with vehicle or Ang II for 1 or 14 days, and stained for αENaC (red), AQP2 (green), and DAPI (blue). High magnification insets (yellow rectangle) show αENaC expression in CD epithelial cell. Scale is 100 μm. Data are fluorescence integrated density (mean ± SEM). (D) Representative immunofluorescence images and quantification of αENaC colocalization with AQP2 on the apical (A) or basolateral (BL) side of the CD cells from wild-type and Noxa1−/− mice treated with vehicle or Ang II for 1 day, and stained for αENaC (red), AQP2 (green), and DAPI (blue). Data are fluorescence integrated density (mean ± SEM). Scale is 10 μm. ACTB, β-actin; ENaC, epithelial Na+ channel; NCC, Na-Cl cotransporter; NHE3, Na-H exchanger 3.
FIG. 6.
FIG. 6.
ENaC is regulated through aldosterone activation of NOXA1-dependent NOX in M1 renal epithelial cells. (A) Real-time PCR analysis of Nox1, Noxa1, Ncf1/2 (p47phox/p67phox), and Nox4 expression levels in M1 renal epithelial cells treated with vehicle or aldosterone for 2 h. Data are mean ± SEM of mRNA expression adjusted to 18s RNA levels. (B) DHE fluorescence was measured in M1 cells treated with vehicle or aldosterone for 30 min, or cells pretreated with 10 μM DPI, 50 μM oxypurinol, 10 μM L-NAME, or 20 mM NAC and then treated with aldosterone. Data are mean ± SEM of DHE fluorescence as percentage of control vehicle-treated cells. (C) DHE fluorescence was determined in control- or PEG-SOD treated M1 cells, or cells transduced with Noxa1, Nox1, or scrambled siRNA, and then treated with vehicle or aldosterone for 30 min. Data are mean ± SEM of DHE fluorescence as percentage of control-untreated cells. (D) Real-time PCR analysis of Nox1 mRNA expression in control and scrambled siRNA or Nox1 siRNA-transduced cells treated with aldosterone for 2 h. Data are mean ± SEM of mRNA expression fold change relative to control adjusted for 18s RNA levels. (E) Real-time PCR analysis of Noxa1 mRNA expression in control and scrambled siRNA or Noxa1 siRNA-transduced cells treated with aldosterone for 2 h. Data are mean ± SEM of mRNA expression fold change relative to control adjusted to 18s RNA. (F) Real-time PCR analysis of Scnn1a (αENaC) gene expression in control, PEG-SOD treated cells, or cells transduced with Noxa1, Nox1, or scrambled siRNA and treated with aldosterone for 2 h. Data are mean ± SEM of mRNA expression adjusted to 18s RNA. (G) Representative confocal microscopy z-stack images of polarized M1 renal epithelial cells treated with vehicle or aldosterone for 30 min, and stained for γENaC (green) and OCLN (red). Fluorescence quantification of apical and basolateral localization of γENaC in control and Noxa1 siRNA- or scrambled siRNA-transduced M1 cells treated with vehicle or aldosterone. DPI, diphenyliodinium; NAC, N-acetyl cysteine; L-NAME, L-nitro arginine methyl ester OCLN, occluding; PEG-SOD, polyethylene glycol-conjugated superoxide dismutase; siRNA, small-interfering RNA.

Similar articles

Cited by

References

    1. Ambasta RK, Schreiber JG, Janiszewski M, Busse R, and Brandes RP. Noxa1 is a central component of the smooth muscle NADPH oxidase in mice. Free Radic Biol Med 41: 193–201, 2006. - PubMed
    1. Ariazi EA, Taylor JC, Black MA, Nicolas E, Slifker MJ, Azzam DJ, and Boyd J. A new role for ERalpha: silencing via DNA methylation of basal, stem cell, and EMT genes. Mol Cancer Res 15: 152–164, 2017. - PMC - PubMed
    1. Baiardi G, Macova M, Armando I, Ando H, Tyurmin D, and Saavedra JM. Estrogen upregulates renal angiotensin II AT1 and AT2 receptors in the rat. Regul Pept 124: 7–17, 2005. - PubMed
    1. Balaban RS, Soltoff SP, Storey JM, and Mandel LJ. Improved renal cortical tubule suspension: spectrophotometric study of O2 delivery. Am J Physiol 238: F50–F59, 1980. - PubMed
    1. Barbaro NR, Foss JD, Kryshtal DO, Tsyba N, Kumaresan S, Xiao L, Mernaugh RL, Itani HA, Loperena R, Chen W, Dikalov S, Titze JM, Knollmann BC, Harrison DG, and Kirabo A. Dendritic cell amiloride-sensitive channels mediate sodium-induced inflammation and hypertension. Cell Rep 21: 1009–1020, 2017. - PMC - PubMed

Publication types