. 2021 Dec 6;218(12):e20210924.
doi: 10.1084/jem.20210924. Epub 2021 Oct 29.

LYVE1+ macrophages of murine peritoneal mesothelium promote omentum-independent ovarian tumor growth

Affiliations

LYVE1+ macrophages of murine peritoneal mesothelium promote omentum-independent ovarian tumor growth

Nan Zhang et al. J Exp Med. .

Abstract

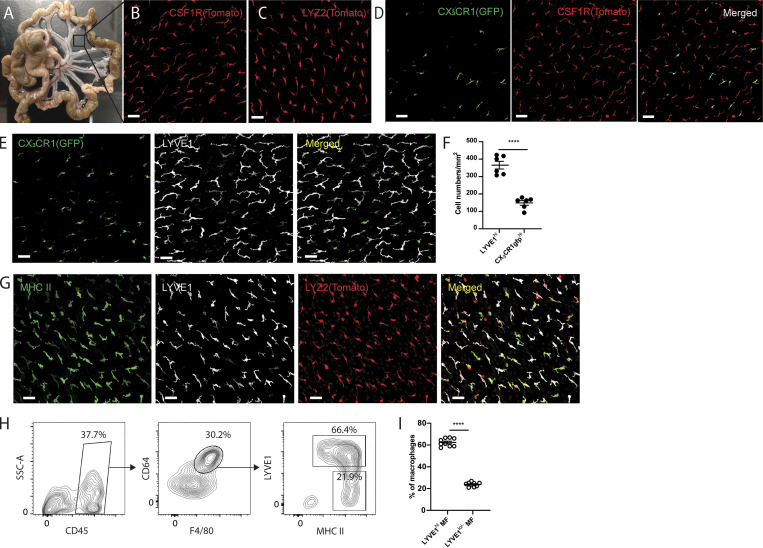
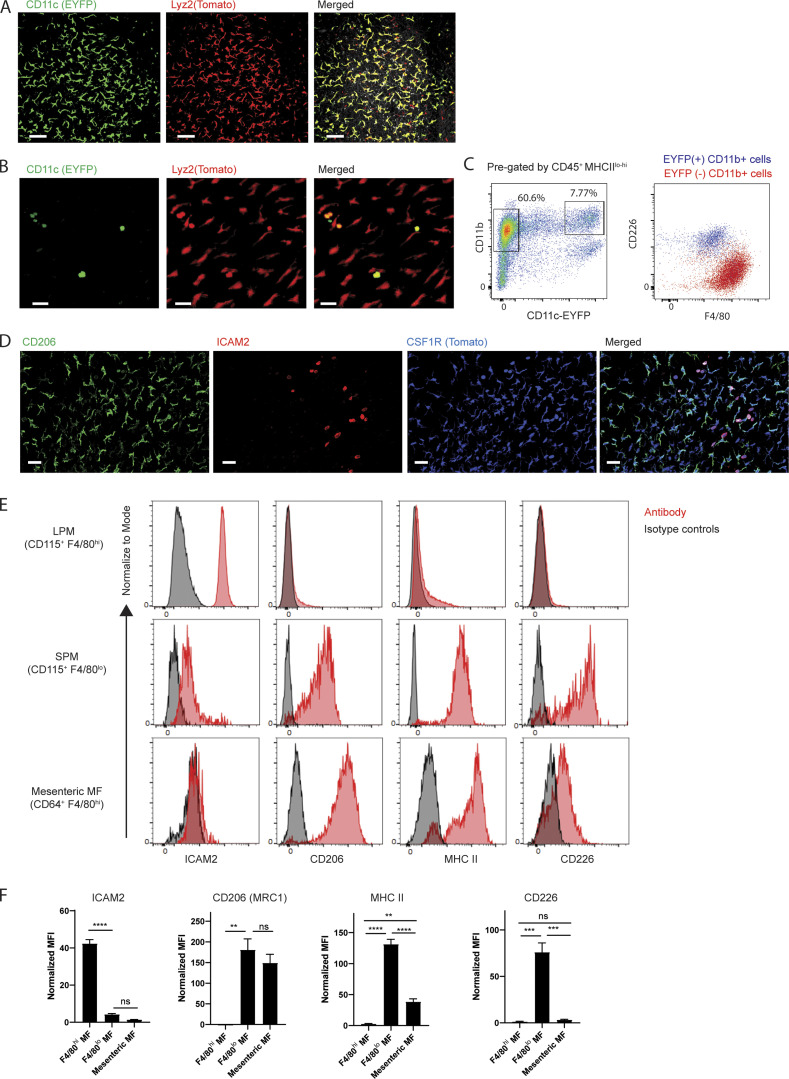
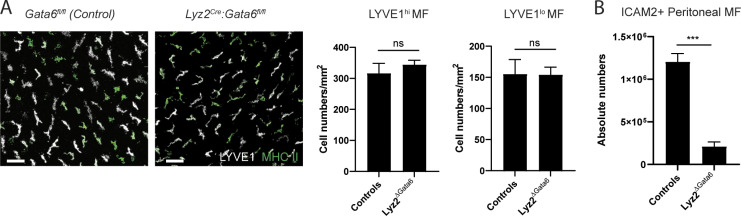
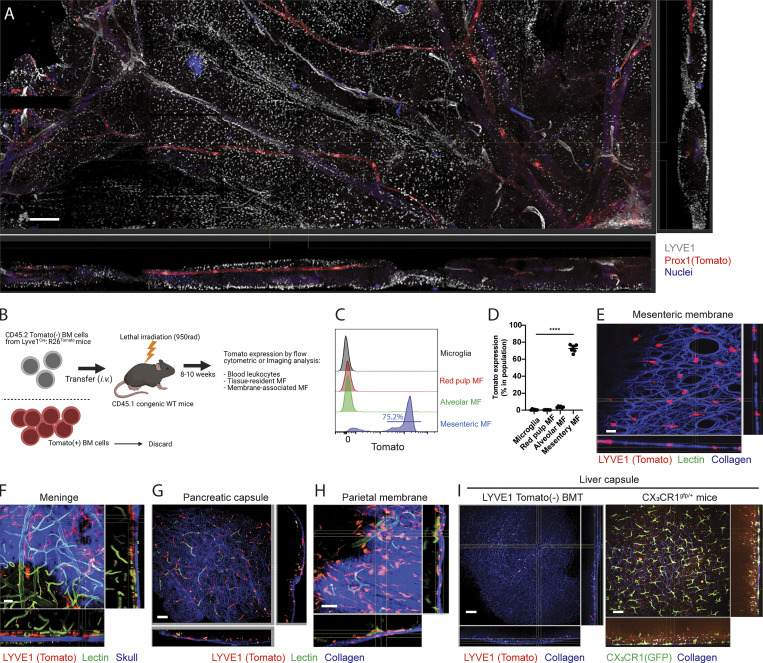
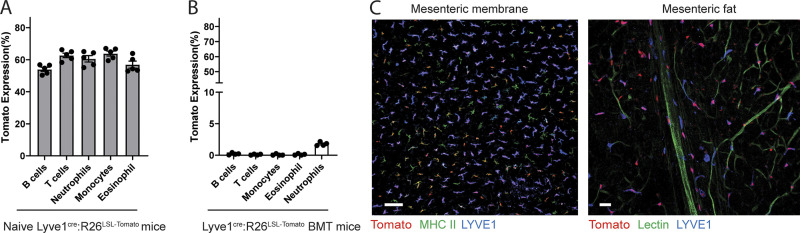
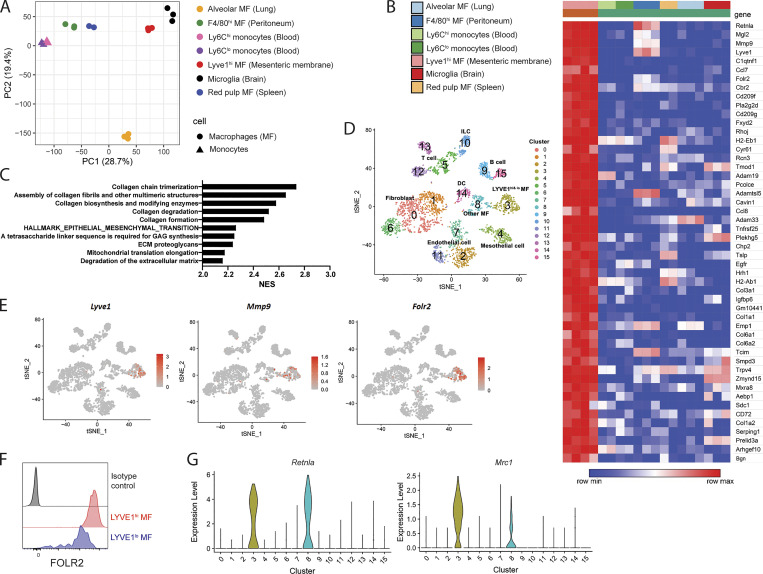
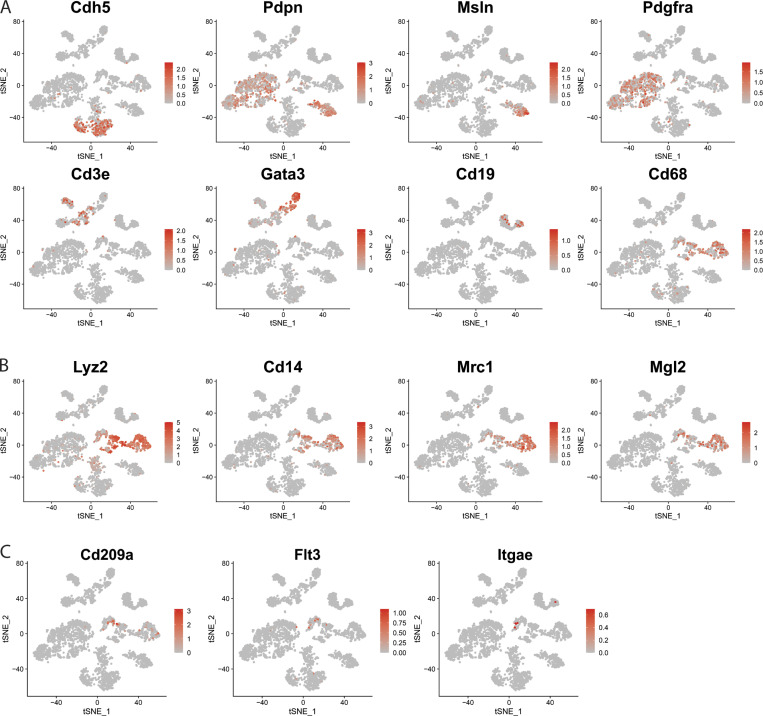
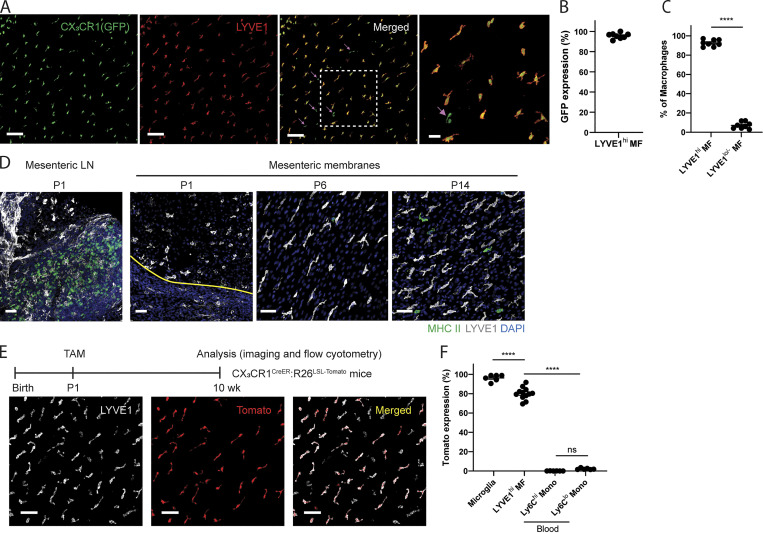
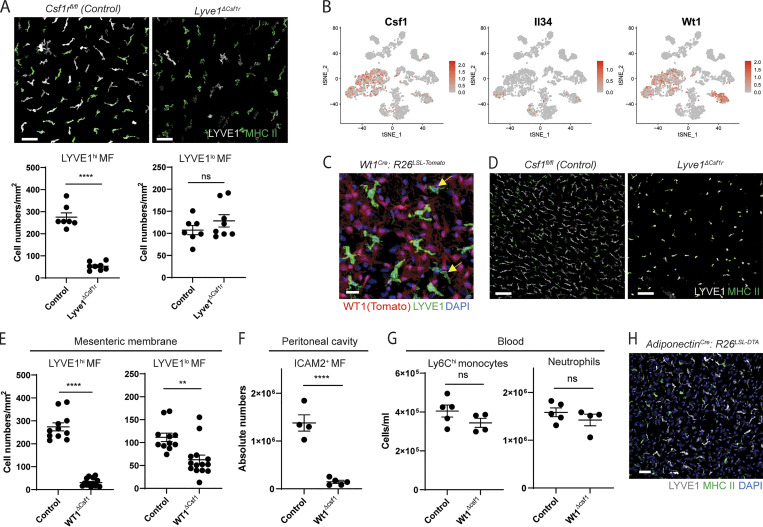
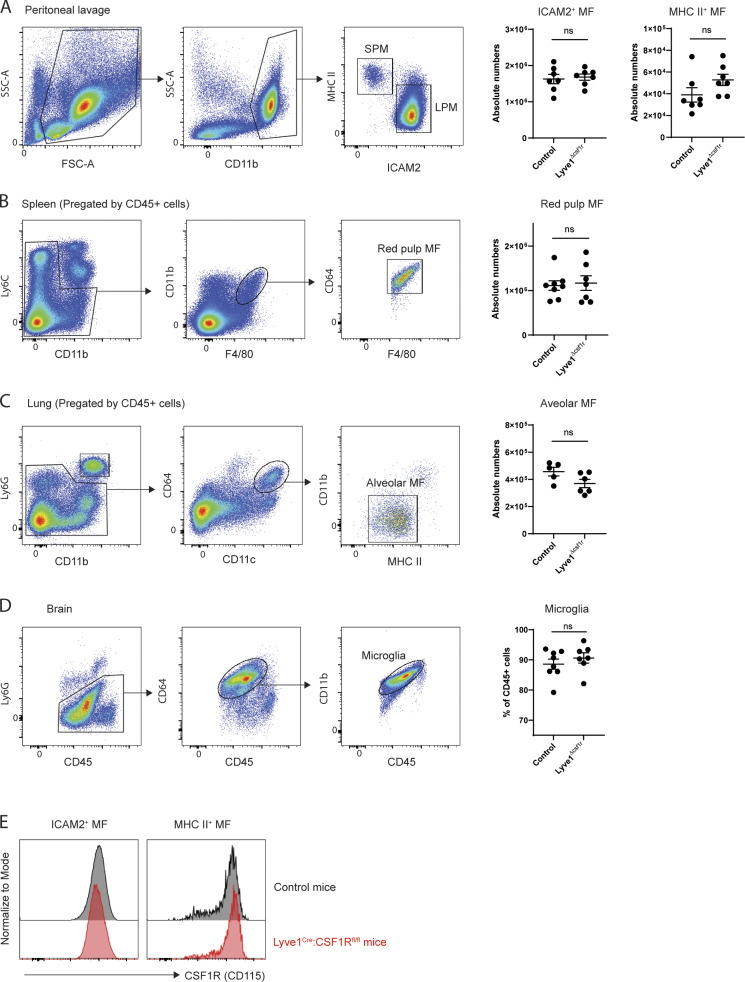
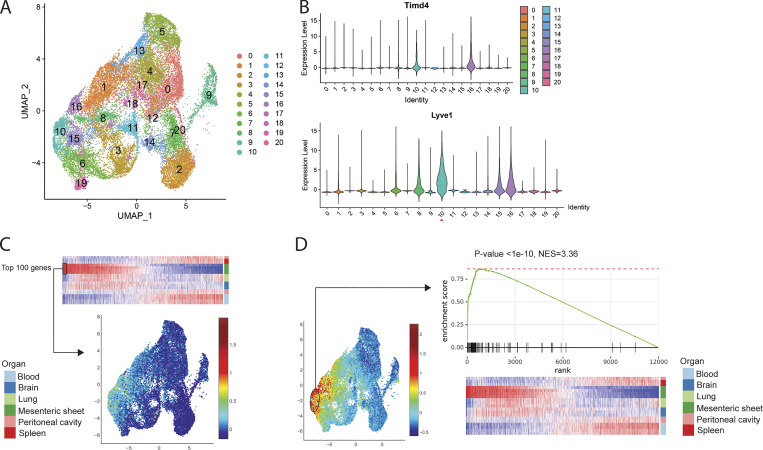
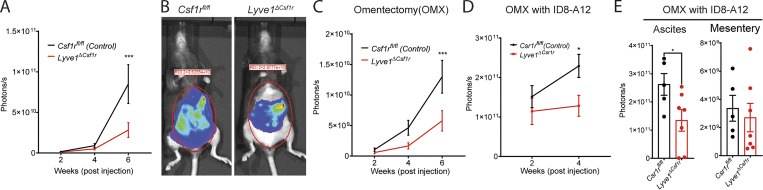
Two resident macrophage subsets reside in peritoneal fluid. Macrophages also reside within mesothelial membranes lining the peritoneal cavity, but they remain poorly characterized. Here, we identified two macrophage populations (LYVE1hi MHC IIlo-hi CX3CR1gfplo/- and LYVE1lo/- MHC IIhi CX3CR1gfphi subsets) in the mesenteric and parietal mesothelial linings of the peritoneum. These macrophages resembled LYVE1+ macrophages within surface membranes of numerous organs. Fate-mapping approaches and analysis of newborn mice showed that LYVE1hi macrophages predominantly originated from embryonic-derived progenitors and were controlled by CSF1 made by Wt1+ stromal cells. Their gene expression profile closely overlapped with ovarian tumor-associated macrophages previously described in the omentum. Indeed, syngeneic epithelial ovarian tumor growth was strongly reduced following in vivo ablation of LYVE1hi macrophages, including in mice that received omentectomy to dissociate the role from omental macrophages. These data reveal that the peritoneal compartment contains at least four resident macrophage populations and that LYVE1hi mesothelial macrophages drive tumor growth independently of the omentum.


Conflict of interest statement

Disclosures: J.W. Williams reported grants from American Heart Association and grants from NIH NHLBI outside the submitted work. No other disclosures were reported.

Figures

Figure 1.
Figure 1.
Two distinct macrophage populations coexist in the avascular regions of mesenteric membranes. (A) Whole-mount images of gut mesentery in adult WT mice. Square box indicates a region of avascular mesenteric membrane. (B and C) Whole-mount images of the avascular mesenteric membrane from tamoxifen-induced Csf1rCreERT2:R26LSL-tdTomato mice (B) and Lyz2Cre:R26LSL-tdTomato mice (C). Scale bar, 50 µm. (D) Whole-mount images of mesenteric membrane from tamoxifen-induced Csf1rCreERT2:R26LSL-tdTomato:CX3CR1gfp mice. CX3CR1-GFP cells (left), Csf1r-expressing Tomato+ cells (middle), and merged pictures (right) for two distinct macrophage populations. Scale bar, 50 µm. (E) Immunohistochemistry analysis of a whole-mount mesenteric membrane from CX3CR1gfp/+ mouse stained for LYVE1. CX3CR1gfp expression (left), LYVE1 (middle), and merged pictures (right) for two distinct macrophage subsets. Scale bar, 50 µm. (F) Quantification of LYVE1hi CX3CR1gfplo/− macrophages and LYVE1lo/− CX3CR1gfphi macrophages in mesenteric membranes. Data are representative of three independent experiments (n = 3; mean ± SEM). Macrophages were quantified in two different regions of mesenteric membrane per mouse. Unpaired Student’s t test: ****, P < 0.0001. (G) Immunohistochemistry analysis of a whole-mount mesenteric membrane from Lyz2Cre:R26LSL-tdTomato mice stained with LYVE1 and MHCII. Scale bar, 50 µm. (H) Flow cytometric analysis of membrane-associated macrophages isolated from gut mesentery with CD45, F4/80, CD64, LYVE1, and MHC II staining. SSC, side scatter. (I) Frequency of LYVE1hi membrane-associated macrophages and LYVE1lo/− membrane-associated macrophages from flow cytometric analysis (H). Data are pooled from two independent experiments (n = 9; mean ± SEM). Unpaired Student’s t test: ****, P < 0.0001. All imaging data are representative of at least three independent experiments.
Figure S1.
Figure S1.
Characterization of membrane-associated macrophages. (A) Two-photon images of liver capsule from Lyz2cre:R26LSL-tdTomato:CD11cEYFP mice. Scale bar, 70 µm. (B) Two-photon images of mesenteric membrane from Lyz2cre:R26Tomao:CD11cEYFP mice. Scale bar, 40 µm. (C) Representative flow cytometric analysis of gut mesentery in CD11cEFYP mice. CD11cEYFP and CD11b gating of CD45+ MHCIIlo-to-hi mesenteric cells (left). Overlay of CD11b+ EYFP and CD11b+ EYFP+ cells (right; n = 6). (D) Whole-mount confocal images of Csf1rCreER:R26Tomato mice with CD206 and ICAM2 staining. Imaging data are representative of at least two independent experiments. Scale bar, 40 µm. (E) Flow cytometric analysis for ICAM2, CD206, MHC II, and CD226 expression in F4/80hi LPMs, F4/80lo small peritoneal macrophages (SPM) and F4/80hi mesenteric macrophages. Data are representative of at least two independent experiments. (F) Mean fluorescent intensity (MFI) values of ICAM2, CD206, MHC II, and CD226, which are normalized by isotype controls. Data are pooled from at least two independent experiments (n = 3–6 mice). Statistical analysis was performed by one-way ANOVA and Tukey’s multiple-comparison test: **, P < 0.01; ***, P < 0.001; ****, P < 0.0001.
Figure S2.
Figure S2.
Mesenteric membrane–associated macrophages in Lyz2Cre:Gata6fl/fl mice. (A) Whole-mount images and quantification of membrane-associated macrophages of Lyz2cre:Gata6fl/fl mice and littermate controls. Scale bar, 50 µm. (B) Quantification of ICAM2+ peritoneal macrophages in Lyz2cre:Gata6fl/fl mice and littermate controls. Imaging data and flow cytometric analysis are representative of two independent experiments (n = 3 per genotype; mean ± SEM). Unpaired Student’s t test: ***, P < 0.001.
Figure 2.
Figure 2.
Lyve1hi membrane-associated macrophages are located in serous membrane of tissue parenchyma. (A) Whole-mount, confocal microscopy tile-scan reconstructions to examine the location and distribution of LYVE1hi mesenteric macrophages in tamoxifen-induced Prox1CreER: R26LSL-tdTomato mice (red, Prox1-expressing lymphatic collector; white, LYVE1-expressing macrophages and lymphatic capillaries; blue, nuclei). Scale bar, 400 µm. Images are representative of two independent experiments with scanning of a large region of tissue. (B) Schemes for Tomato BM transplantation to whole-body-irradiated mice (created with BioRender.com). Sorted CD45.2 Tomato BM cells from Lyve1cre:R26LSL-tdTomato mice were transplanted to irradiated congenic CD45.1 WT mice. Tomato reporter will label only adult macrophages with an active LYVE1 promoter in adulthood, bypassing embryo-restricted activity at this promoter. (C) Histogram showing Tomato reporter expression of tissue-resident macrophages in brain, spleen, lung, and gut mesentery of Tomato BM transplanted CD45.1 recipient mice. (D) Quantification of Tomato expression in donor-derived tissue-resident macrophages of Tomato BM transplanted CD45.1 mice. (C-D) Data are pooled from at least two independent experiments (n = 6, mean ± SEM). Statistical analysis was performed by one-way ANOVA and Tukey’s multiple-comparison test: ****, P < 0.0001. (E) Whole mount images of the mesenteric membrane in Tomato BM transplanted chimeric mice (red, Tomato+ macrophages; blue, collagens imaged by second harmonic generation [SHG]). Scale bar, 20 µm. (F) Whole mount images of the meninge in Tomato BM transplanted chimeric mice (red, Tomato+ macrophages; green, Alexa488-conjugated lectin injected blood vessels; blue, skull imaged by SHG). Note Tomato+ perivascular macrophages underneath skull. Scale bar, 20 µm. (G) Whole mount images of pancreas from Tomato BM transplanted chimeric mice (red, Tomato+ macrophages; green, Alexa488-conjugated lectin injected blood vessels; blue, collagen bundles shown as SHG) Scale bar, 50 µm. (H) Whole-mount images of the parietal peritoneal membrane from Tomato BM transplanted chimeric mice (red, Tomato+ macrophages; green, Alexa488-conjugated lectin injected blood vessels; blue, collagens shown by SHG). Scale bar, 50 µm, (E, G, and H) Note Tomato+ membrane-associated macrophages in collagen-enriched serosa membrane. (I) Comparison of liver capsular macrophages between Tomato BM-transplanted chimeric mice (left) and CX3CR1gfp/+ mice (right); red, Tomato+ macrophages; green, CX3CR1gfp+ macrophages; blue, collagen. Scale bar, 50 µm. All two-photon microscopic images are representative of at least two independent experiments.
Figure S3.
Figure S3.
Comparison of blood leukocytes between naive Lyve1cre:R26LSL-tdTomato mice and Tomato BM-transplanted mice. (A) Tomato expression of blood leukocytes in naive Lyve1cre:R26LSL-tdTomato mice (n = 5). (B) Tomato expression of blood leukocytes from Tomato BM-transplanted mice (n = 4). Data are representative of at least two independent experiments. (C) Images of avascular region of a mesenteric membrane and the region containing adipose tissue in the BM-transplanted mice. Scale bars, 100 and 30 µm.
Figure 3.
Figure 3.
LYVE1hi macrophages have their own gene expression patterns. (A) PCA of tissue-resident macrophages (alveolar macrophages, F4/80+ peritoneal macrophages, microglia, splenic red pulp macrophages, and LYVE1hi membrane-associated macrophages) and blood monocytes (Ly6Chi and Ly6Clo monocytes) obtained from RNA-seq dataset. PC, principal component. (B) Heatmap analysis of top 50 up-regulated genes of 12,000 genes expressed in LYVE1hi membrane-associated macrophages. Heatmap depicts mean expression intensity of mRNA transcripts for genes differentially expressed between LYVE1hi macrophages and other macrophages, including monocytes. (C) Pathway analysis of genes differentially expressed in LYVE1hi membrane-associated macrophages implemented by fast GSEA, showing top 10 enriched pathways from Reactome database and Molecular Signatures Database. NES, normalized enrichment score. (D) t-SNE plot displaying reanalyzed scRNA-seq of whole mesentery cells (accession no. GSE102665). (E) Expression of Lyve1, MMP9, and Folr2 on the t-SNE plot of scRNA-seq described in D. (F) Flow cytometric analysis showing FOLR2 expression of LYVE1hi and LYVE1lo mesenteric macrophages. Data are representative of three mice. (G) Violin plot of Retnla and Mrc1 expression obtained from scRNA-seq described in D.
Figure S4.
Figure S4.
t-SNE plot identifying different cell populations in scRNA-seq of whole mesentery cells (accession no. GSE102665). (A) Signature genes that represent different cell populations of whole mesenteric cells. (B) t-SNE-plot for macrophage populations. (C) t-SNE-plot for dendritic cell populations.
Figure 4.
Figure 4.
Membrane-associated macrophages originate from embryonic precursors. (A) Whole-mount images of mesentery in newborn (P0) CX3CR1gfp/+ pups stained with LYVE1. Right-most image is the enlargement of the boxed area in the adjacent image. Arrows indicate LYVE1lo/− CX3CR1-GFP+ macrophages. Images are representative of two independent experiments. Scale bar, 100 µm; 30 µm (higher-magnification image). (B) CX3CR1-GFP expression within the Lyve1hi macrophage pool in the mesenteric membrane of newborn mice. GFP expression is quantified within total LYVE1hi macrophage population. (C) The frequency of LYVE1hi macrophages versus LYVE1lo/− macrophages in the mesenteric membrane of newborn mice. In B and C, data are representative of two independent experiments (n = 4; mean ± SEM). Membrane-associated macrophages were quantified in one to three different regions of mesenteric membrane per mouse. Unpaired Student’s t test: ****, P < 0.0001. (D) Whole-mount images of MLNs and mesenteric membranes of P1, P6, and P14 neonatal mice stained with LYVE1 and MHCII. White, LYVE1; green, MHCII; blue, DAPI. The yellow line in the P1 panel indicates the border of mesenteric vessels and mesenteric membrane. Images are representative of at least two independent experiments per time point. Scale bar, 50 µm. (E) Representative whole-mount images of adult CX3CR1CreERT2:R26LSL-Tomato mice in which tamoxifen was injected on P1 (white, LYVE1; red, Tomato reporter). Scale bar, 50 µm. (F) Tomato expression in microglia, LYVE1hi mesenteric membrane–associated macrophages and blood monocyte subsets. LYVE1hi membrane-associated macrophages were quantified in two different regions of membrane per mouse from confocal microscopy images. Microglia and blood monocytes were quantified via flow cytometric analysis. In E and F, data are pooled from two independent experiments (n = 6; mean ± SEM). Statistical analysis was performed by one-way ANOVA and Tukey’s multiple-comparison test: ****, P < 0.0001.
Figure 5.
Figure 5.
Membrane-associated macrophages are controlled by CSF1 produced by stromal cells of serous membranes. (A) Whole-mount images of the two distinct membrane-associated macrophages and their quantification in Lyve1Cre:Csf1rfl/fl mice and littermate Csf1rfl/fl control mice. Scale bar, 50 µm. Data are representative of three independent experiments (n = 3 per genotype; mean ± SEM). Macrophages were quantified in multiple regions of mesenteric membrane per mouse. Unpaired Student’s t test: ****, P < 0.0001. (B) Expression pattern of Csf1, Il34, and Wt1 depicted on the t-SNE plot derived from scRNA-seq of whole mesenteric cells shown in Fig. 3 D. (C) Whole-mount images stained for LYVE1 in mesenteric membranes from WT1cre:R26LSL-tdTomato mice. Representative images of three independent experiments. Arrows indicate LYVE1lo/− macrophages (red, Wt1 Tomato reporter; green, LYVE1; blue, DAPI). Scale bar, 20 µm. (D) Whole-mount images of mesenteric membranes from Wt1Cre:Csf1fl/fl mice and littermate Csf1fl/fl control mice. Representative images of two independent experiments. Scale bar, 100 µm. (E) Quantification of LYVE1hi and LYVE1lo membrane-associated macrophages obtained from whole-mount images of Wt1Cre:Csf1fl/fl mice and littermate Csf1fl/fl control mice. Data are pooled from two independent experiments (Csf1fl/fl mice, n = 4; Wt1Cre:Csf1fl/fl mice, n = 6; mean ± SEM). Macrophages were quantified from multiple regions of mesenteric membrane per mouse. Unpaired Student’s t test: **, P < 0.01; ****, P < 0.0001. (F) Quantification of ICAM2+ macrophages in peritoneal cavity. Data are representative of at least three independent experiments (Csf1fl/fl mice, n = 4; Wt1Cre:Csf1fl/fl mice, n = 5; mean ± SEM). Unpaired Student’s t test: ****, P < 0.0001. (G) Quantification of Ly6Chi monocytes and neutrophils in blood. Data are representative of three independent experiments (Csf1fl/fl mice, n = 5; Wt1Cre:Csf1fl/fl mice, n = 4; mean ± SEM). Unpaired Student’s t test. (H) Confocal image from the mesenteric membrane of Adiponectincre: R26LSL-DTA mice and controls. Images are representative of two independent experiments. Scale bar, 50 µm.
Figure S5.
Figure S5.
Quantification of tissue-resident macrophages of Lyve1Cre:Csf1rfl/fl and control mice. (A) Gating strategy of two peritoneal macrophage subsets and their quantification in Lyve1Cre:Csf1rfl/fl mice and control mice. FSC, forward scatter; SSC, side scatter. (B) Gating strategy of splenic red pulp macrophages and their quantification in Lyve1Cre:Csf1rfl/fl mice and control mice. (C) Gating strategy of alveolar macrophages and their quantification of in Lyve1Cre:Csf1rfl/fl mice and control mice. (D) Gating strategy and percentage of microglia in CD45+ brain leukocytes of Lyve1Cre:Csf1rfl/fl mice and control mice. (E) Representative histogram of CSF1R expression in ICAM2+ and MHC II+ peritoneal macrophage subsets analyzed in A. In A–E, data were pooled from two independent experiments (n = 5–8 mice). Statistical analysis was performed by unpaired Student’s t test.
Figure 6.
Figure 6.
Comparison of gene expressions between RNA-seq of Lyve1hi membrane-associated macrophages and scRNA-seq of Lyve1hi omental macrophages in ovarian tumor progression. (A) Reanalyzed uniform manifold approximation and projection (UMAP) plot of scRNA-seq data (ArrayExpress accession no. E-MTAB-8593) of F4/80+ CD64+ omental macrophages isolated 10 wk after ID8 ovarian tumor cell injection. (B) Violin plot of Timd4 and Lyve1 expression from the scRNA-seq dataset in A. (C) UMAP plot of scRNA-seq showing top 100 genes up-regulated in bulk RNA-seq datasets of LYVE1hi membrane-associated macrophages. (D) GSEA of RNA-seq data from Lyve1hi membrane-associated macrophages showing select genes enriched in Cluster 10 of scRNA-seq. NES, normalized enrichment score.
Figure 7.
Figure 7.
Deficiency in LYVE1hi macrophages delays intraperitoneal expansion of ovarian cancer in an omentum-independent manner. (A) Quantification of bioluminescence signals at different time points after tumor implantation (Csf1rfl/fl mice, n = 12; Lyve1ΔCsf1r mice, n = 13; mean ± SEM). (B) Bioluminescence images of tumor-bearing mice at 6 wk after inoculation. (C) Quantification of bioluminescence signal at different time points after inoculation in omentectomized (OMX) mice (Csf1rfl/fl mice, n = 11; Lyve1ΔCsf1r mice, n = 11; mean ± SEM). (D) Quantification of bioluminescence signal at different time points after inoculation of the omentum-primed ID8-A12 cells in OMX mice (Csf1rfl/fl mice, n = 10; Lyve1ΔCsf1r mice, n = 12; mean ± SEM). (E) Quantification of bioluminescence signal of ascites and mesenteries 4 wk after inoculation of the omentum-primed ID8-A12 cells in OMX mice (mean ± SEM). Unpaired Student’s t test: *, P < 0.05; ***, P < 0.001. Statistical analysis was performed using one-way ANOVA (A, C, and D) and Student’s t test (E).

References

    1. Artyomov, M. 2021a.. Single Cell Navigator. https://artyomovlab.wustl.edu/scn/ (accessed October 26, 2021)
    1. Artyomov, M. 2021b.. Phantasus. https://artyomovlab.wustl.edu/phantasus/ (accessed October 26, 2021)
    1. Bain, C.C., Bravo-Blas A., Scott C.L., Perdiguero E.G., Geissmann F., Henri S., Malissen B., Osborne L.C., Artis D., and Mowat A.M.. 2014. Constant replenishment from circulating monocytes maintains the macrophage pool in the intestine of adult mice. Nat. Immunol. 15:929–937. 10.1038/ni.2967 - DOI - PMC - PubMed
    1. Bellomo, A., Mondor I., Spinelli L., Lagueyrie M., Stewart B.J., Brouilly N., Malissen B., Clatworthy M.R., and Bajénoff M.. 2020. Reticular Fibroblasts Expressing the Transcription Factor WT1 Define a Stromal Niche that Maintains and Replenishes Splenic Red Pulp Macrophages. Immunity. 53:127–142.e7. 10.1016/j.immuni.2020.06.008 - DOI - PubMed
    1. Bénézech, C., Luu N.T., Walker J.A., Kruglov A.A., Loo Y., Nakamura K., Zhang Y., Nayar S., Jones L.H., Flores-Langarica A., et al. . 2015. Inflammation-induced formation of fat-associated lymphoid clusters. Nat. Immunol. 16:819–828. 10.1038/ni.3215 - DOI - PMC - PubMed

Publication types

MeSH terms