

Financial Hardship Among Pregnant and Postpartum Women in the United States, 2013 to 2018
- PMID: 34714338
- PMCID: PMC8556621
- DOI: 10.1001/jamanetworkopen.2021.32103
Financial Hardship Among Pregnant and Postpartum Women in the United States, 2013 to 2018
Abstract
Importance: Financial hardship affects health care access and health outcomes among peripartum women.
Objective: To evaluate the prevalence of financial hardship among peripartum women over time and by insurance type and income.
Design, setting, and participants: This cross-sectional study included peripartum women, defined as women aged 18 to 45 years who reported being currently pregnant or pregnant in the past 12 months, who participated in the National Health Interview Survey from 2013 to 2018. Data were analyzed from January to May 2021.
Exposures: Current pregnancy or recent pregnancy as well as insurance type and income.
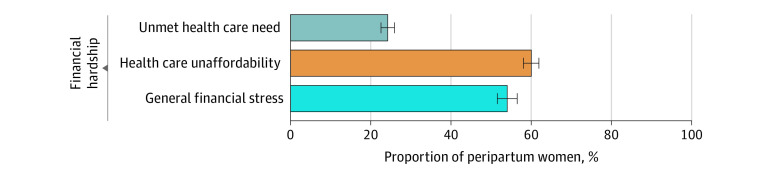
Main outcomes and measures: Three measures of financial hardship within the last year were evaluated: (1) unmet health care need due to cost (unmet need for medical care or delayed or deferred medical care due to cost); (2) health care unaffordability (worry about paying for potential medical bills or existing medical debt); and (3) general financial stress (worry about subsistence spending [eg, monthly bills, housing]).
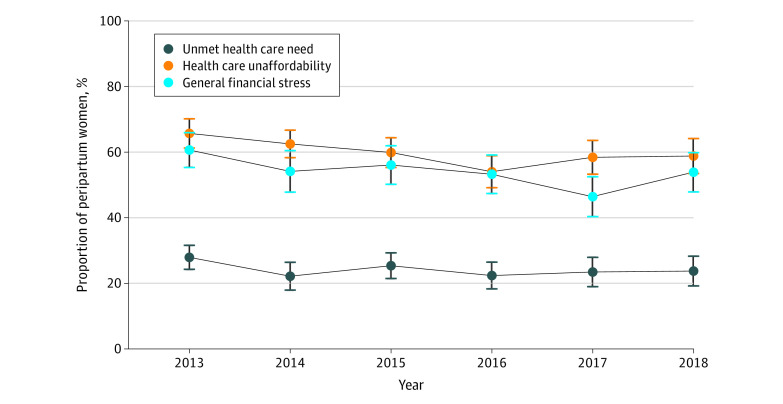
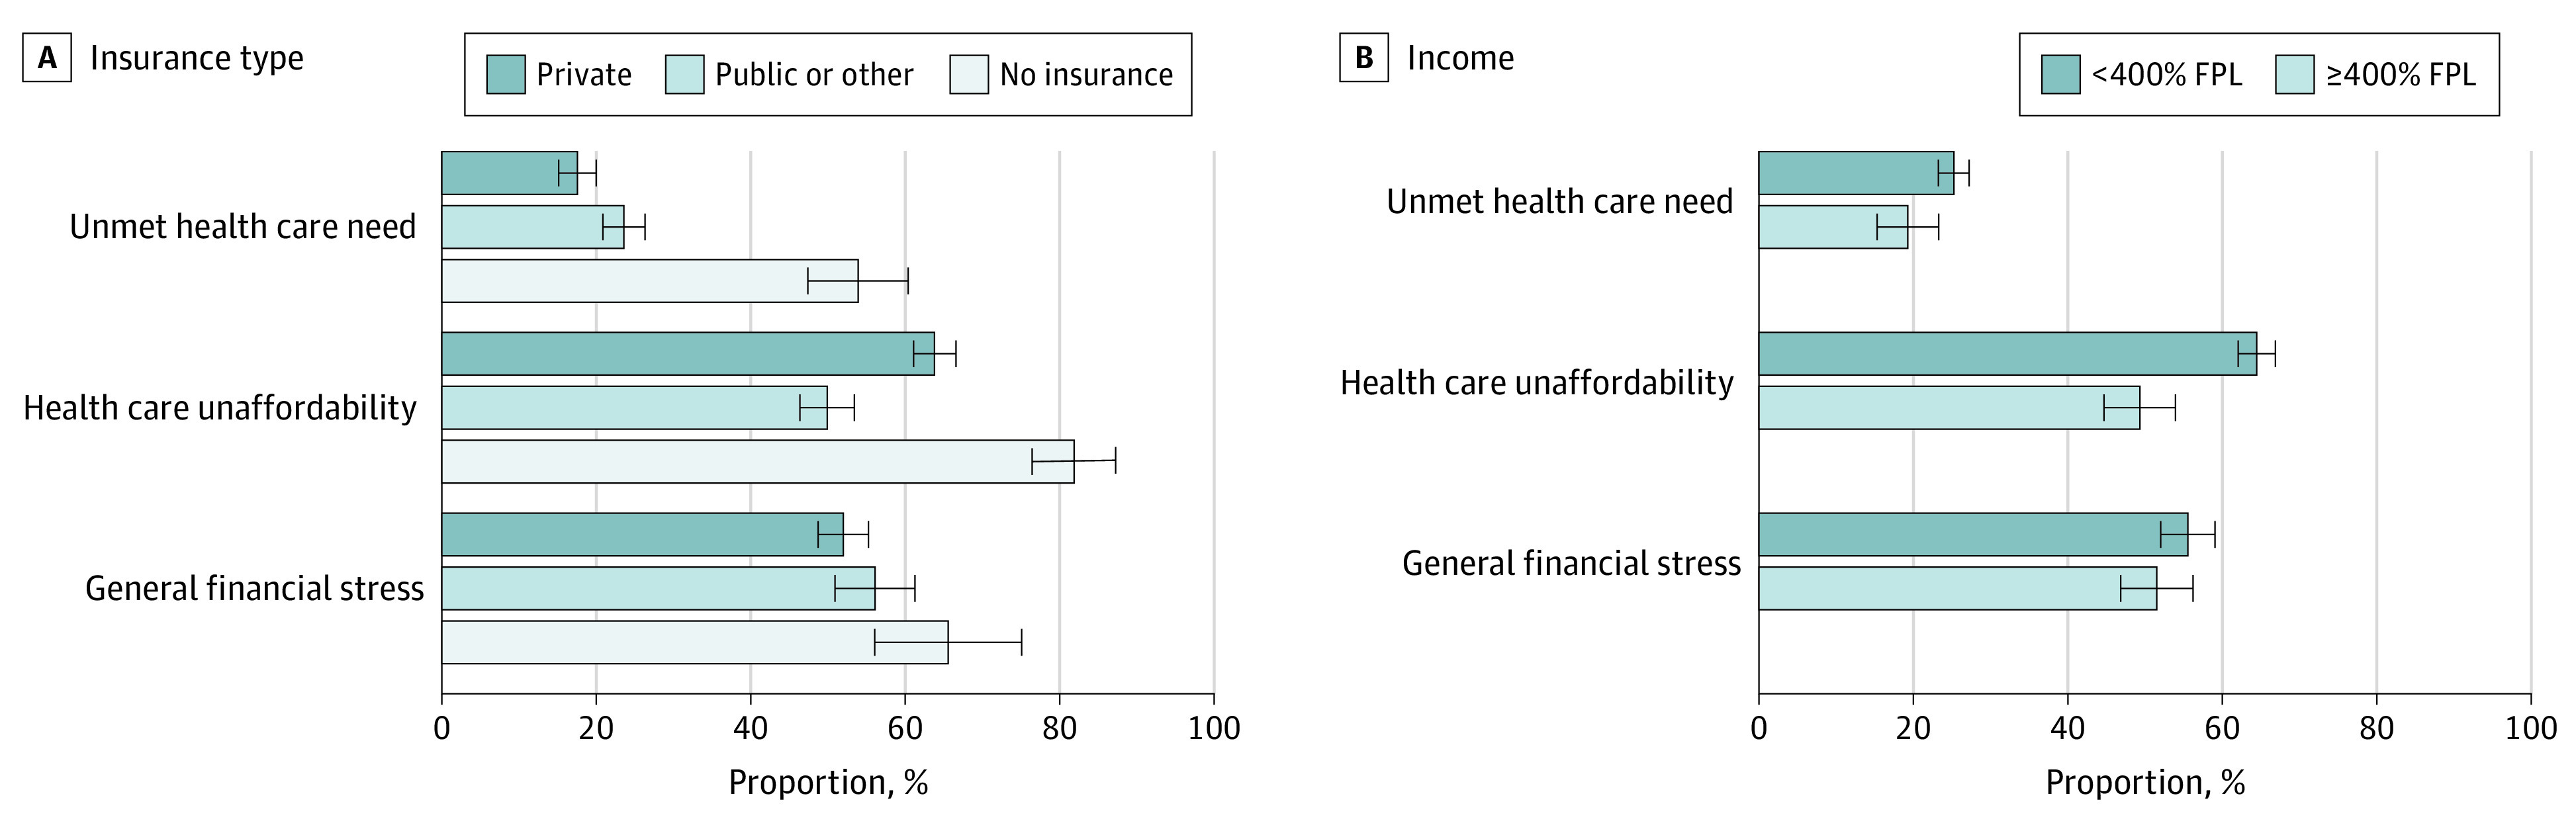
Results: The study cohort included 3509 peripartum women, weighted to represent 1 050 789 women (2018: an estimated 36 045 of 184 018 [19.6%] Hispanic, 39 017 [21.2%] Black, and 97 366 [52.9%] White), with a mean (SD) age of 29 (6) years. Overall, from 2013 to 2018, 24.2% (95% CI, 22.6%-26.0%) of peripartum women reported unmet health care need, 60.0% (95% CI, 58.0%-61.9%) reported health care unaffordability, and 54.0% (95% CI, 51.5%-56.5%) reported general financial stress. The prevalence of financial hardship outcomes did not substantially change between 2013 and 2018 (unmet health care need in 2013: 27.9% [95% CI, 24.4%-31.7%]; in 2018: 23.7% [95% CI, 19.5%-28.6%]; health care unaffordability in 2013: 65.7% [95% CI, 61.1%-70.0%]; in 2018: 58.8% [95% CI, 53.4%-64.0%]; general financial stress in 2013: 60.6% [95% CI, 55.2%-65.8%]; in 2018: 53.8% [95% CI, 47.8%-59.8%]). Women with private insurance had lower odds of unmet need (adjusted odds ratio [aOR], 0.67; 95% CI, 0.52-0.87) but higher odds of health care unaffordability (aOR, 1.88; 95% CI, 1.49-2.36) compared with women with public insurance. Peripartum women with household incomes less than 400% of the federal poverty level had higher odds of unmet need (aOR, 1.50; 95% CI, 1.08-2.08) and unaffordable care (aOR, 1.98; 95% CI, 1.54-2.55) compared with those with household incomes 400% or more of federal poverty level.
Conclusions and relevance: These findings suggest that financial hardship among peripartum women in the United States was common from 2013 to 2018, including 24% of pregnant and postpartum women reporting unmet health care need and 60% reporting health care unaffordability. Women with private insurance and those living on lower incomes were more likely to experience unaffordable health care than women with pubic insurance and those with higher incomes, respectively. Targeted policy interventions are needed to improve health care affordability and promote overall economic security among peripartum women.
Conflict of interest statement
Figures
References
-
- Kilpatrick SJ, Papile L, Macones GA. Guidelines for Perinatal Care. 8th ed. American Academy of Pediatrics/The American College of Obstetricians and Gynecologists; 2017.
Publication types
MeSH terms
Grants and funding
LinkOut - more resources
Full Text Sources
Medical
Miscellaneous
