. 2022 Jan;227(1):219-297.
doi: 10.1007/s00429-021-02400-x. Epub 2021 Oct 29.

Manual delineation approaches for direct imaging of the subcortex

Affiliations

Manual delineation approaches for direct imaging of the subcortex

Anneke Alkemade et al. Brain Struct Funct. 2022 Jan.

Abstract

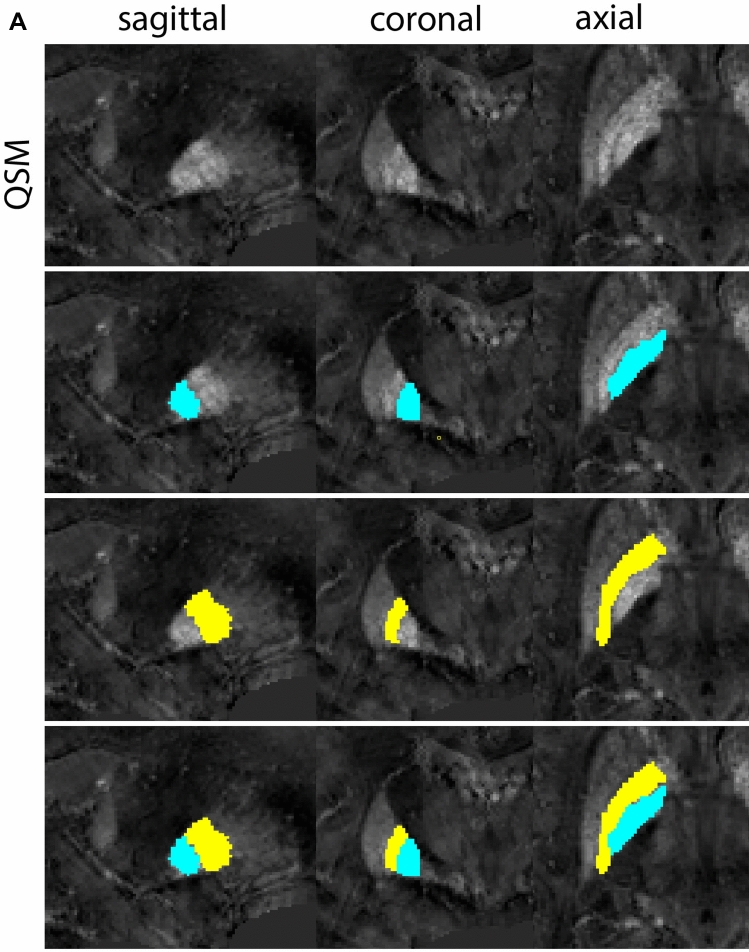
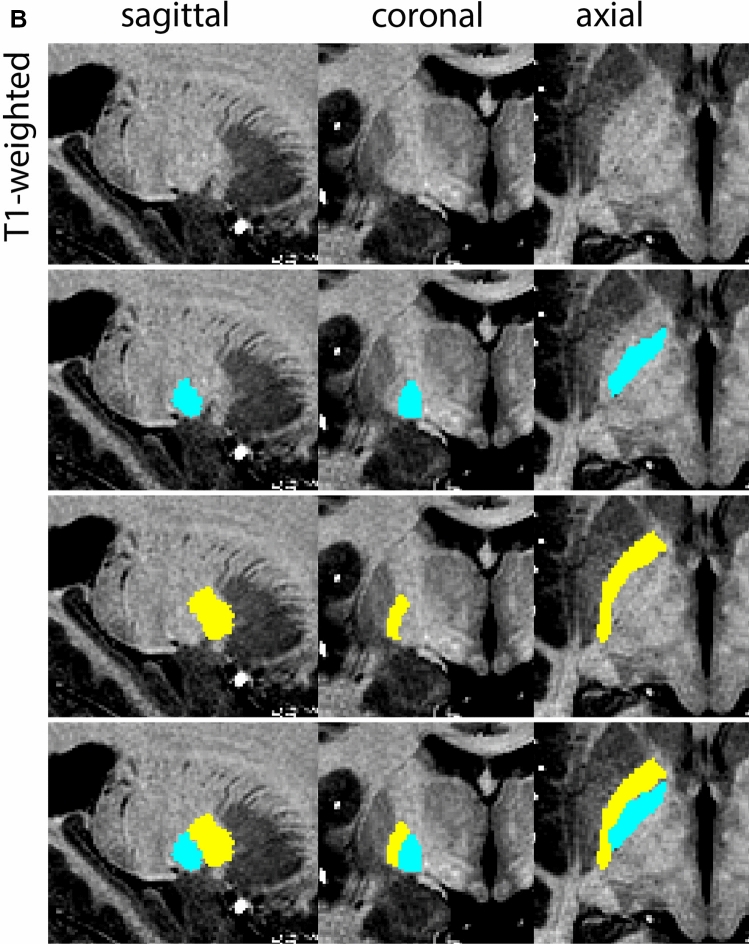
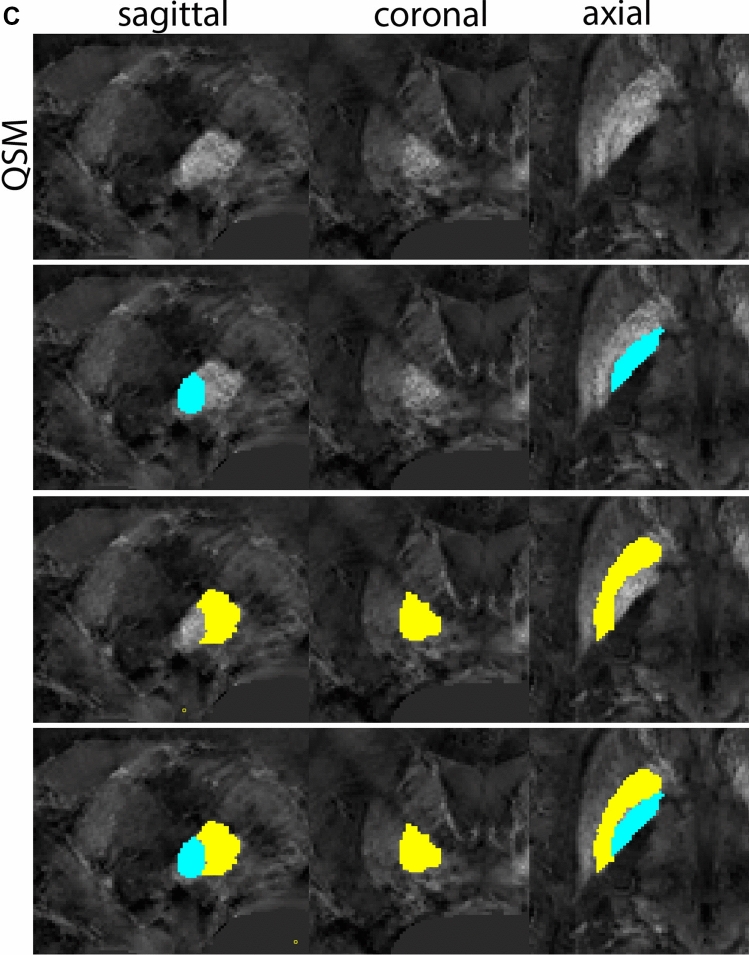
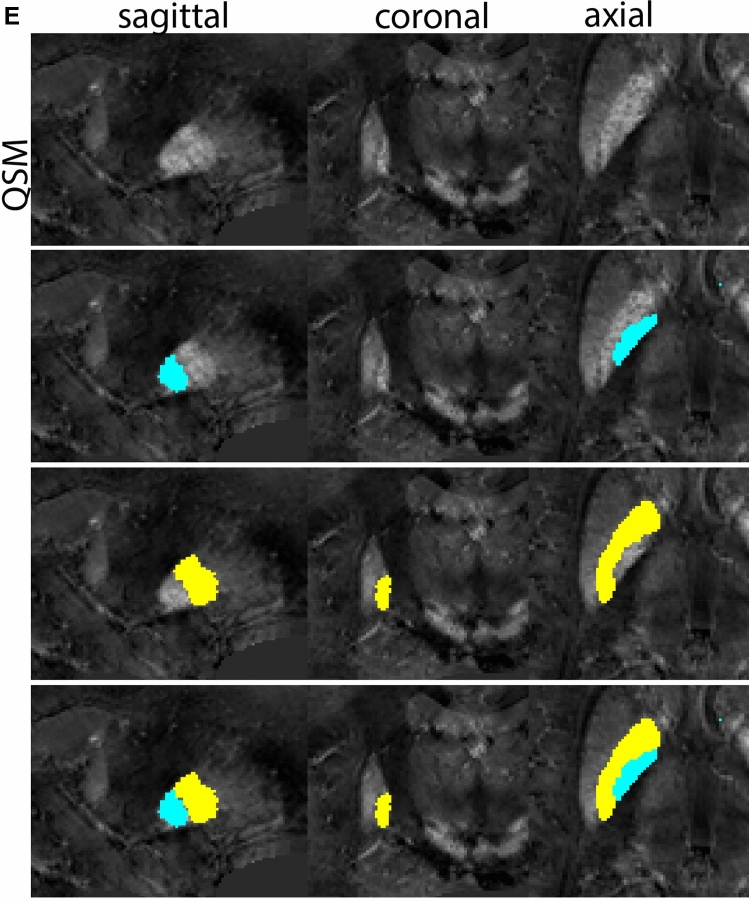
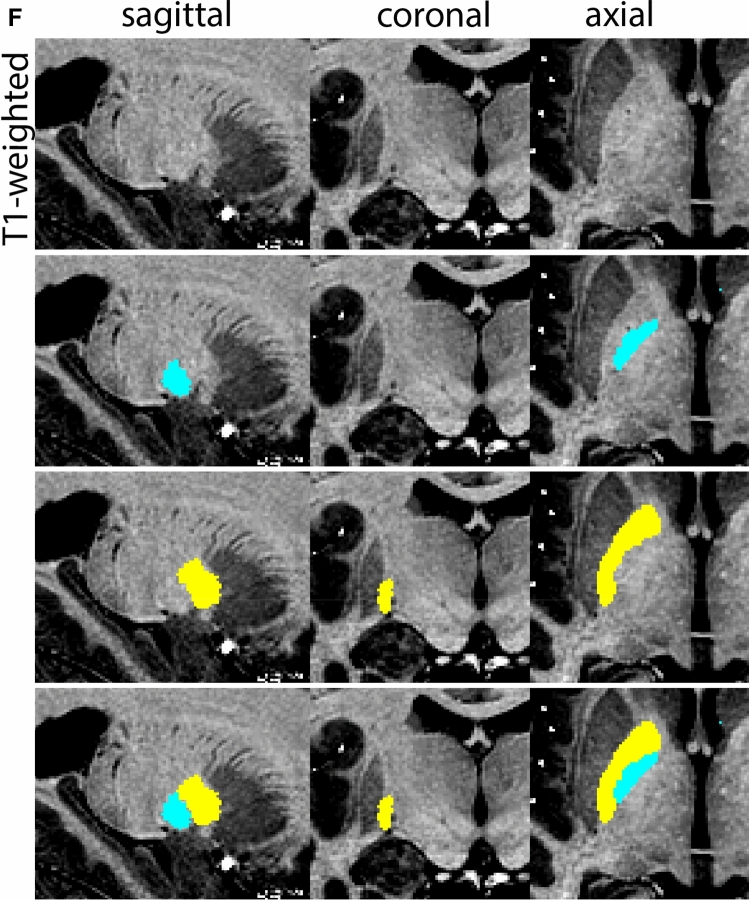
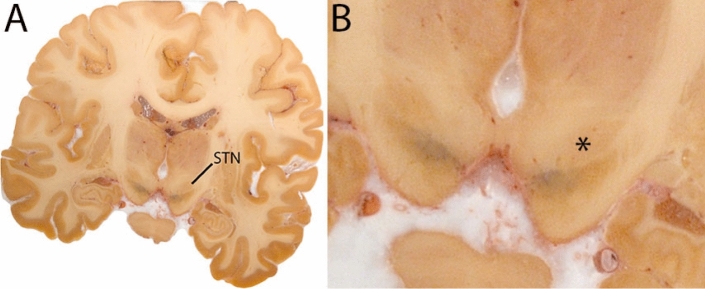
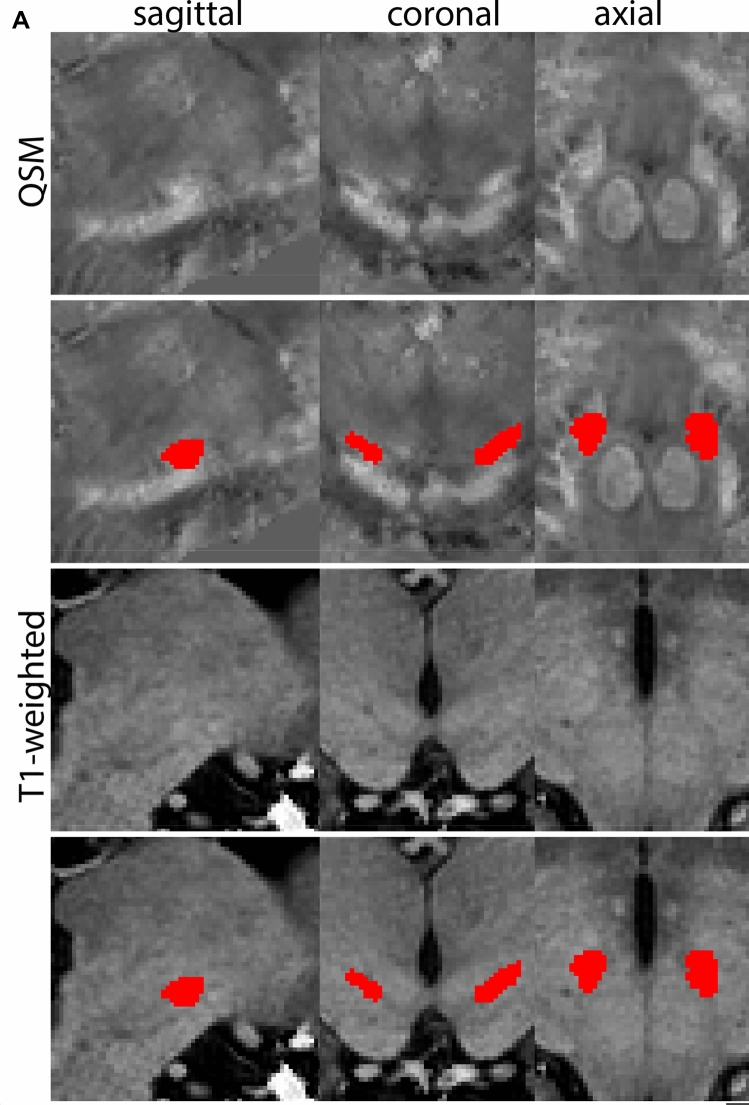
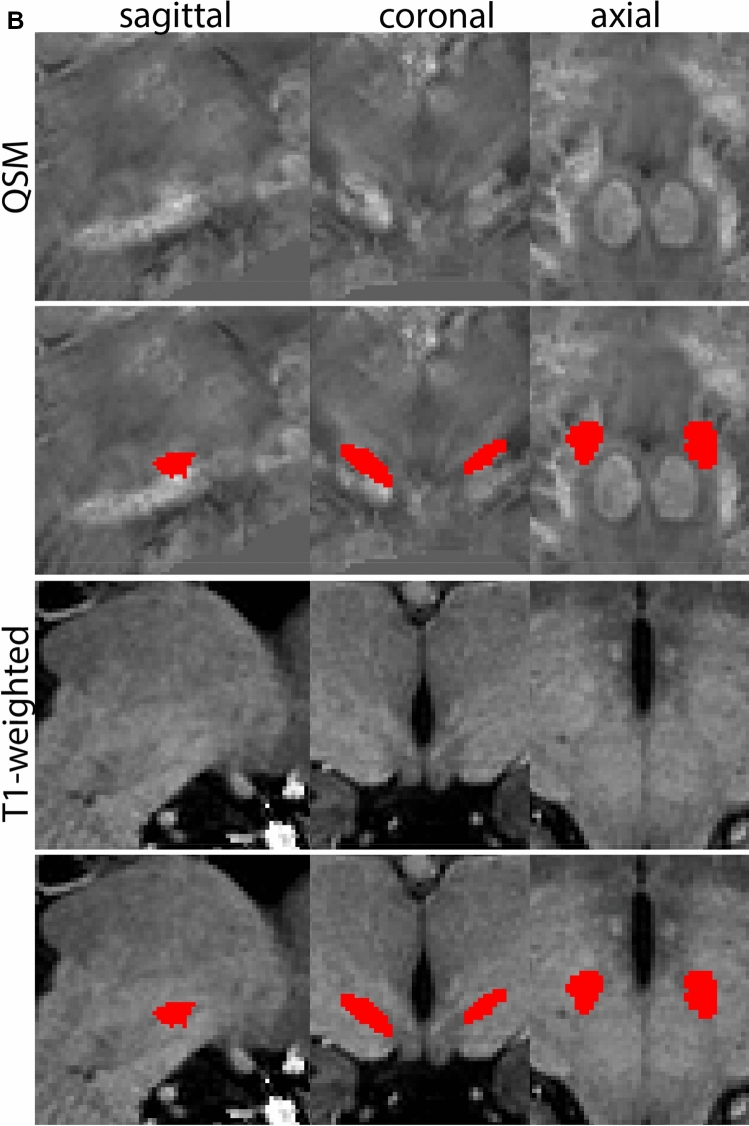
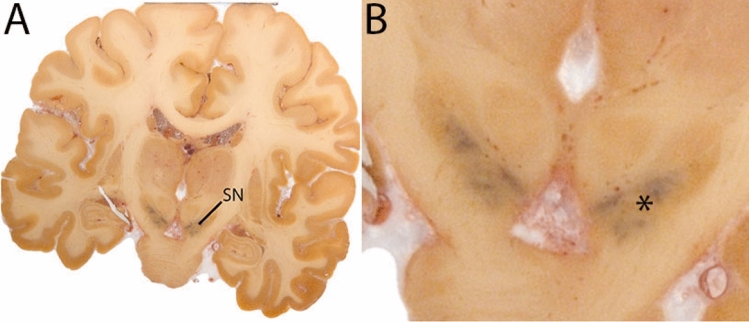
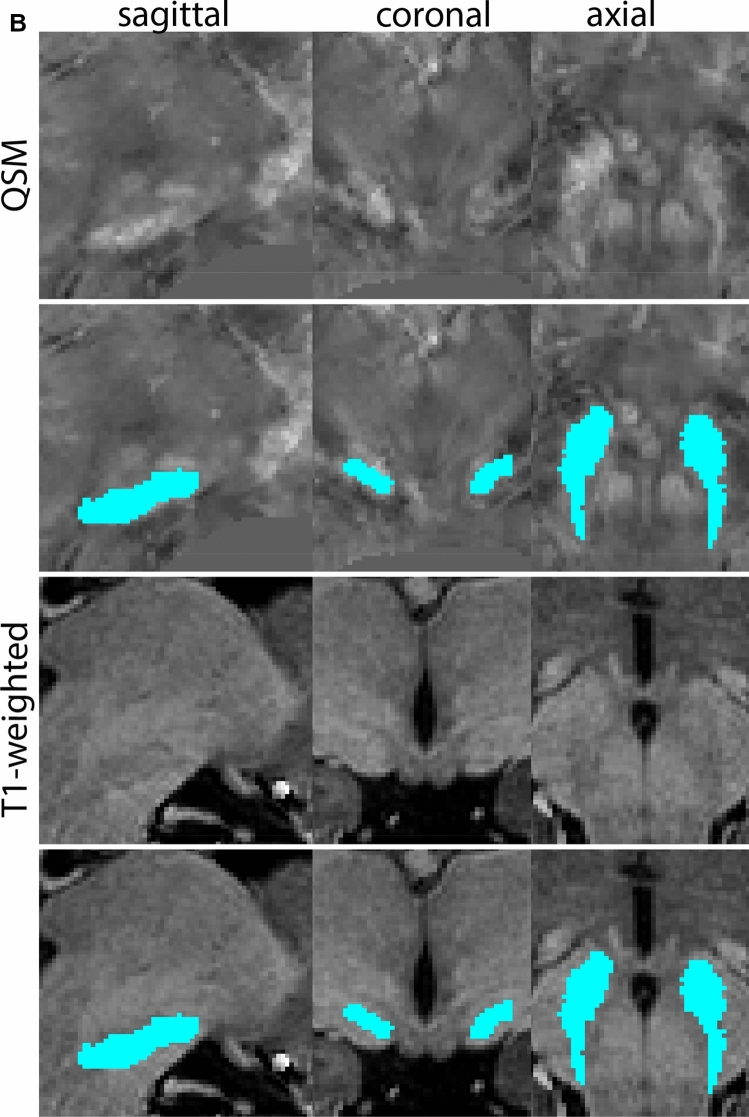
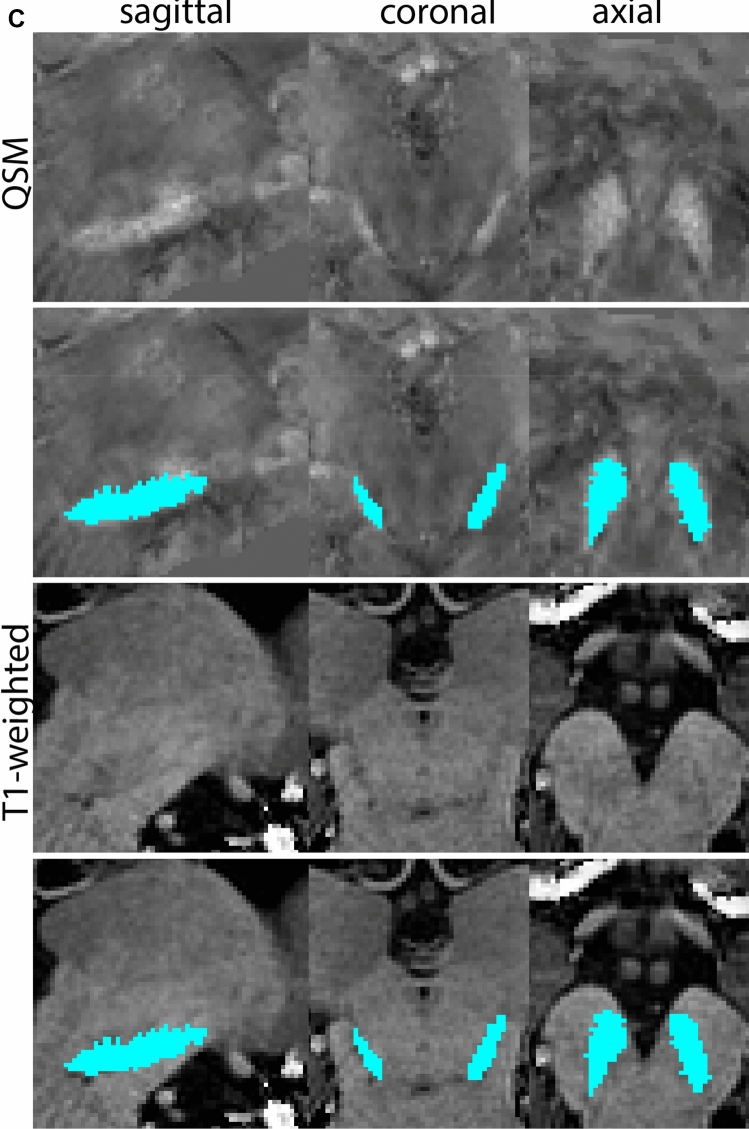
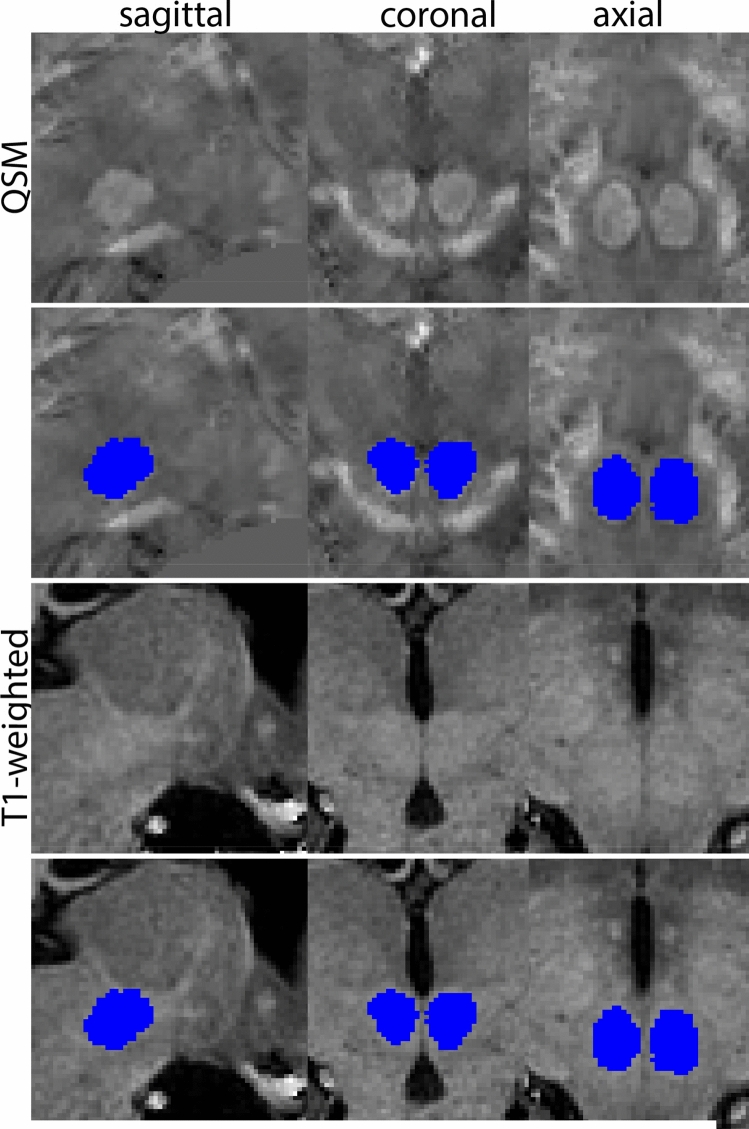
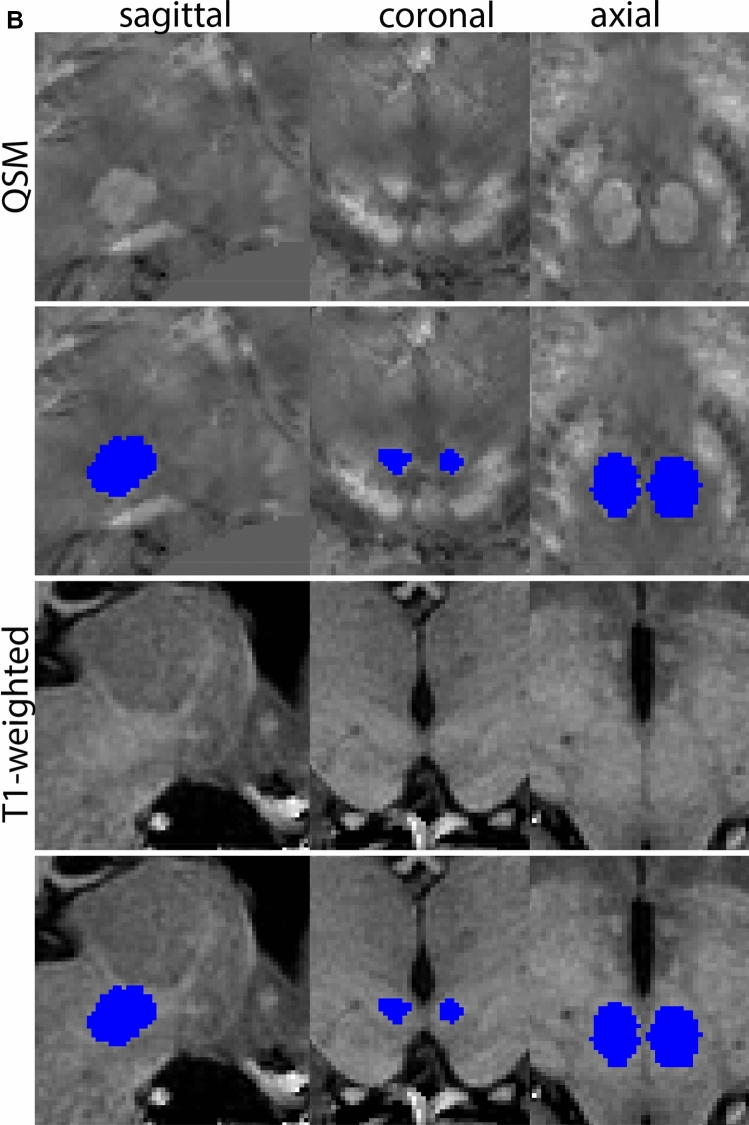
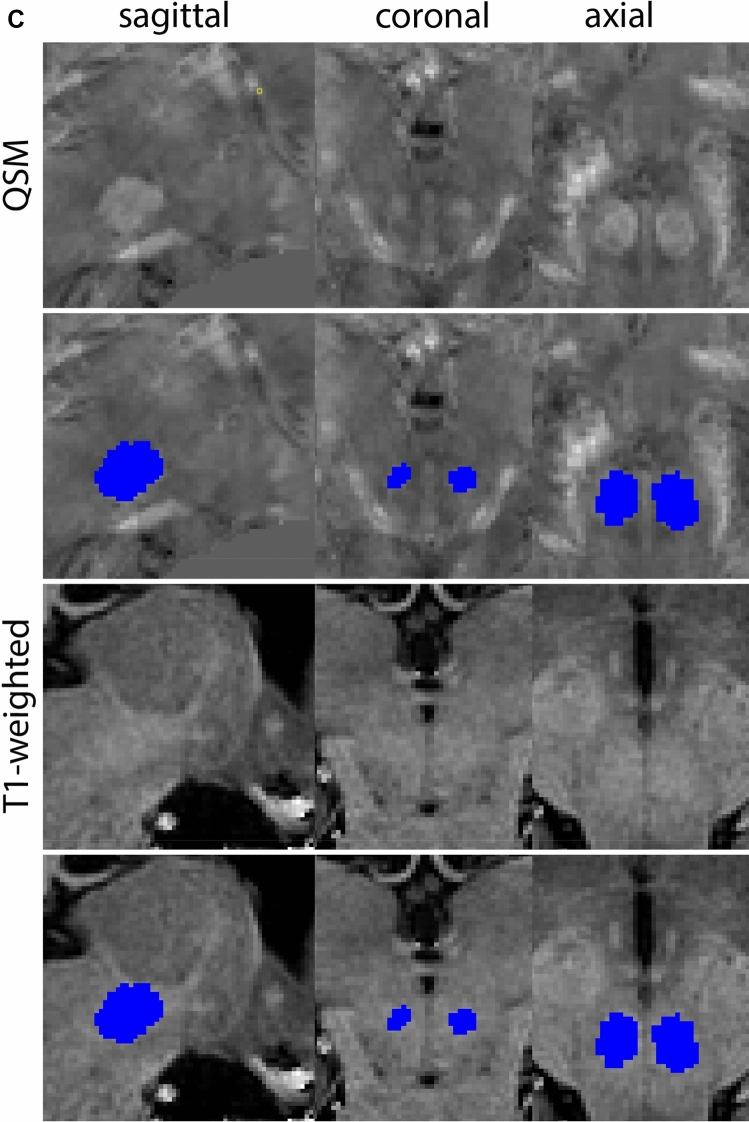
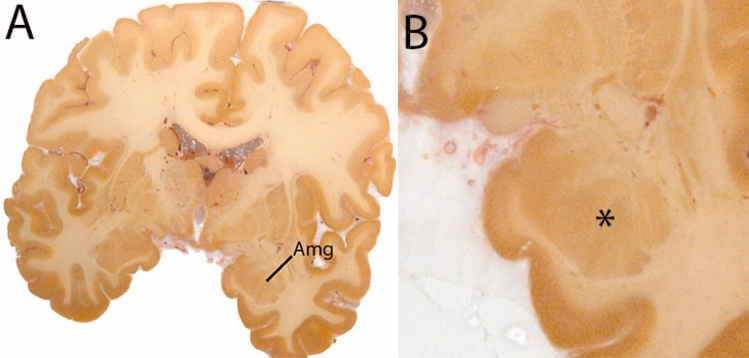
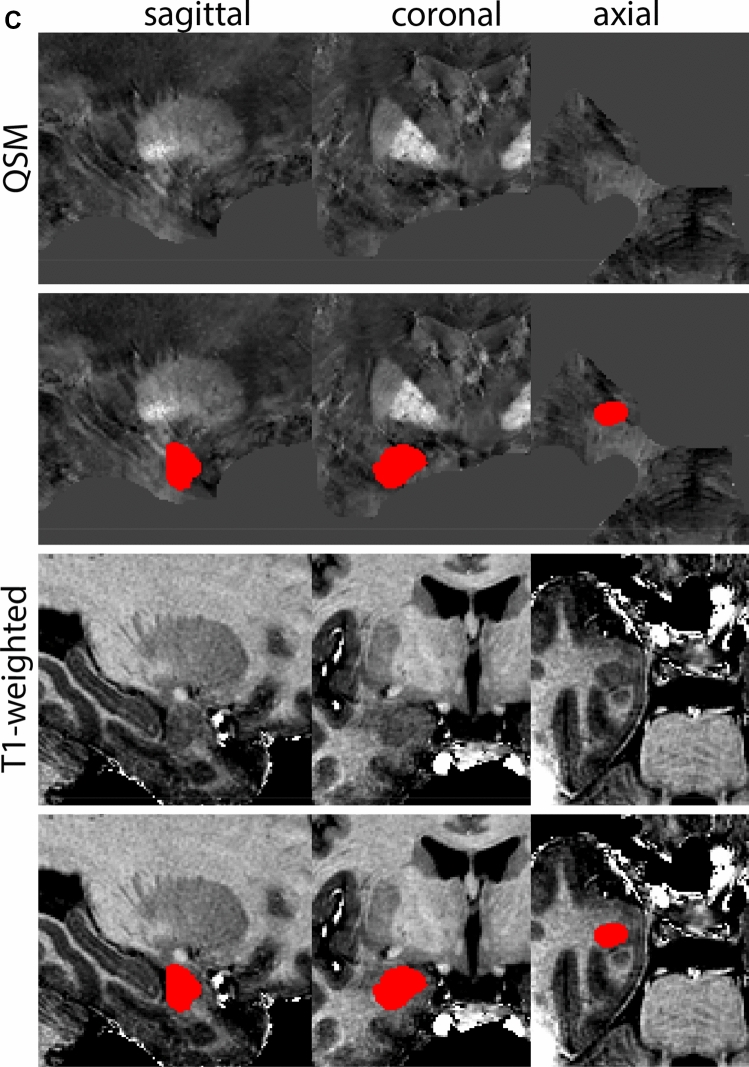
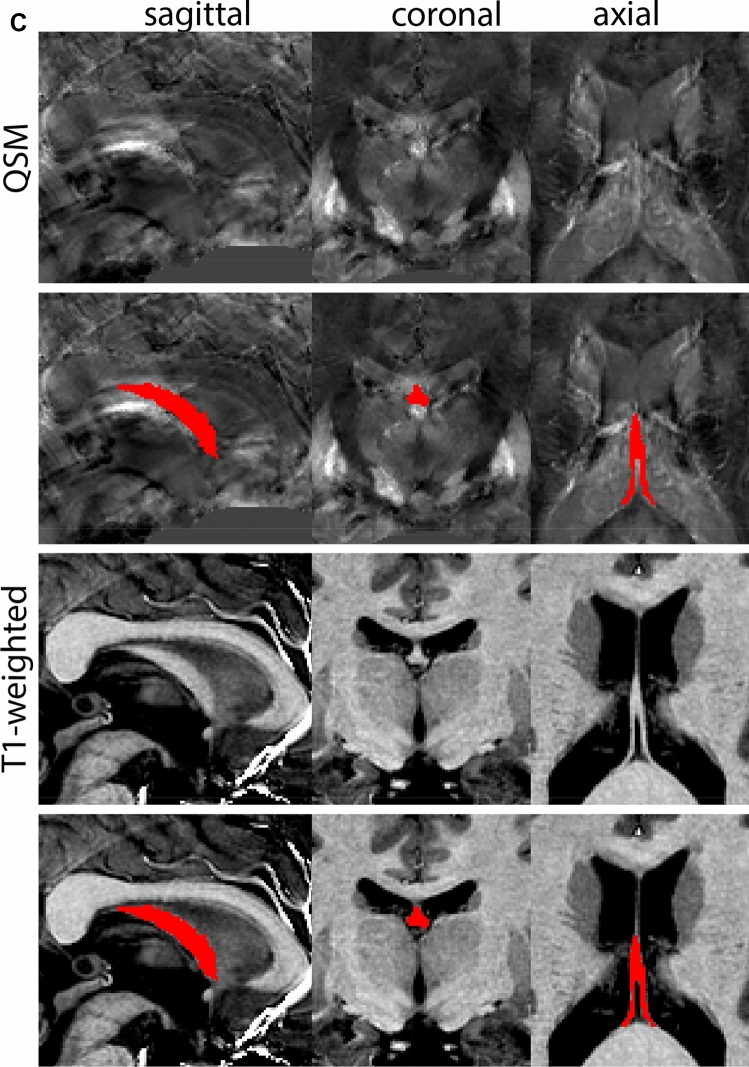
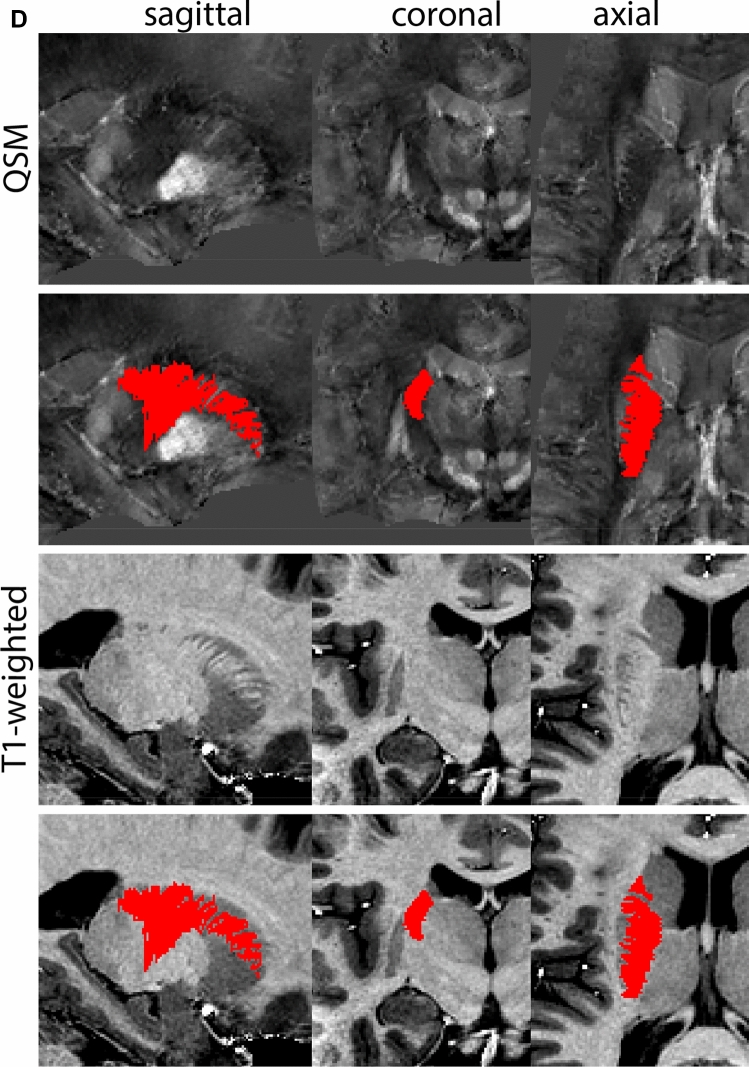
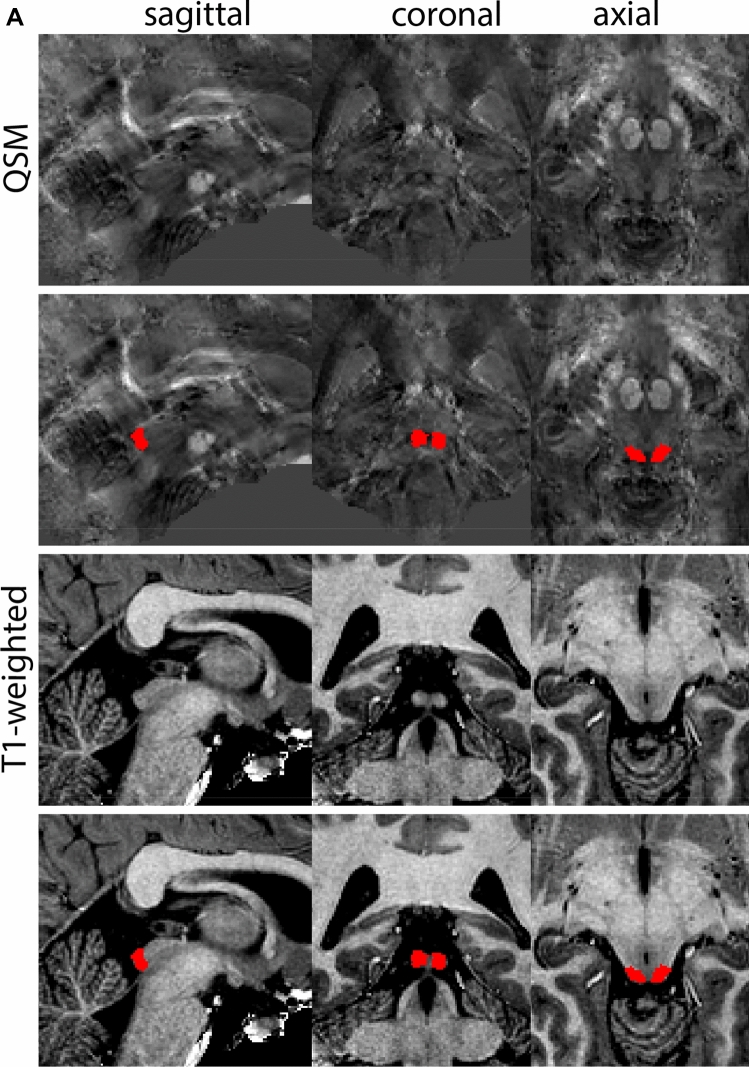
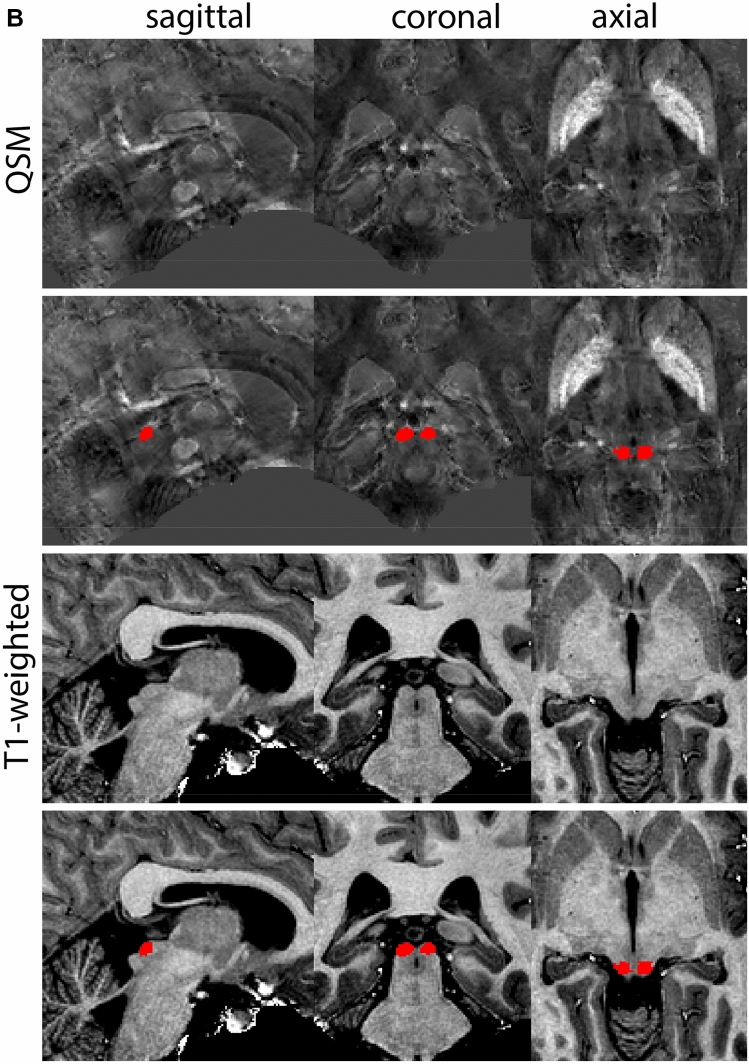
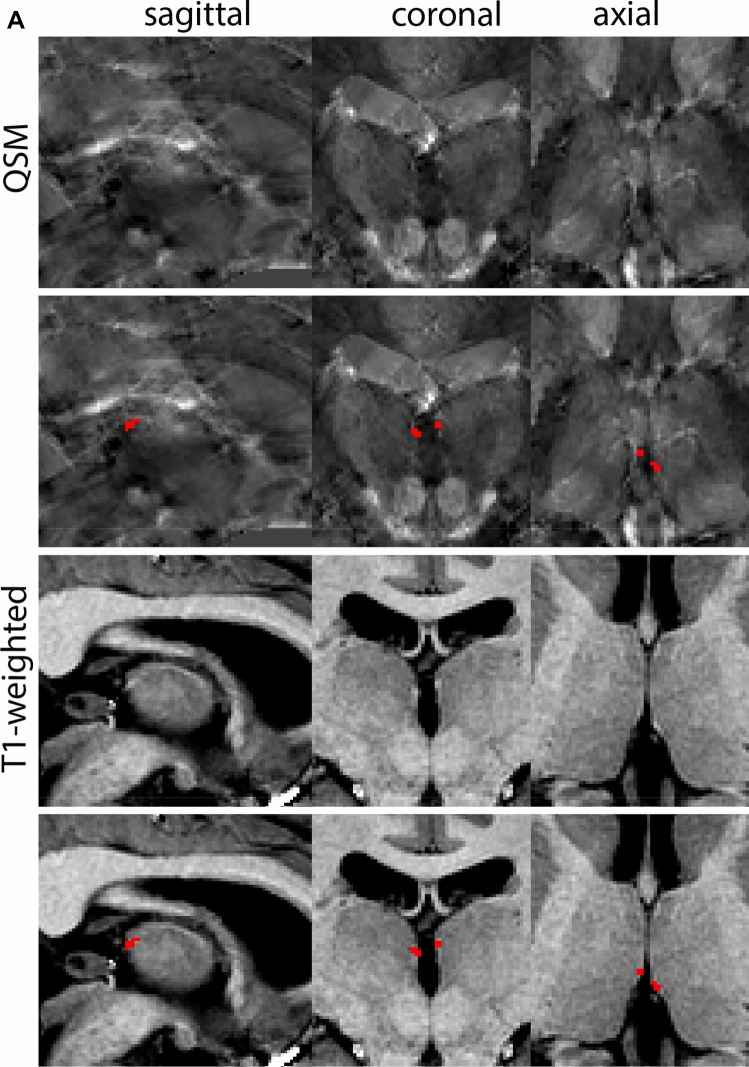
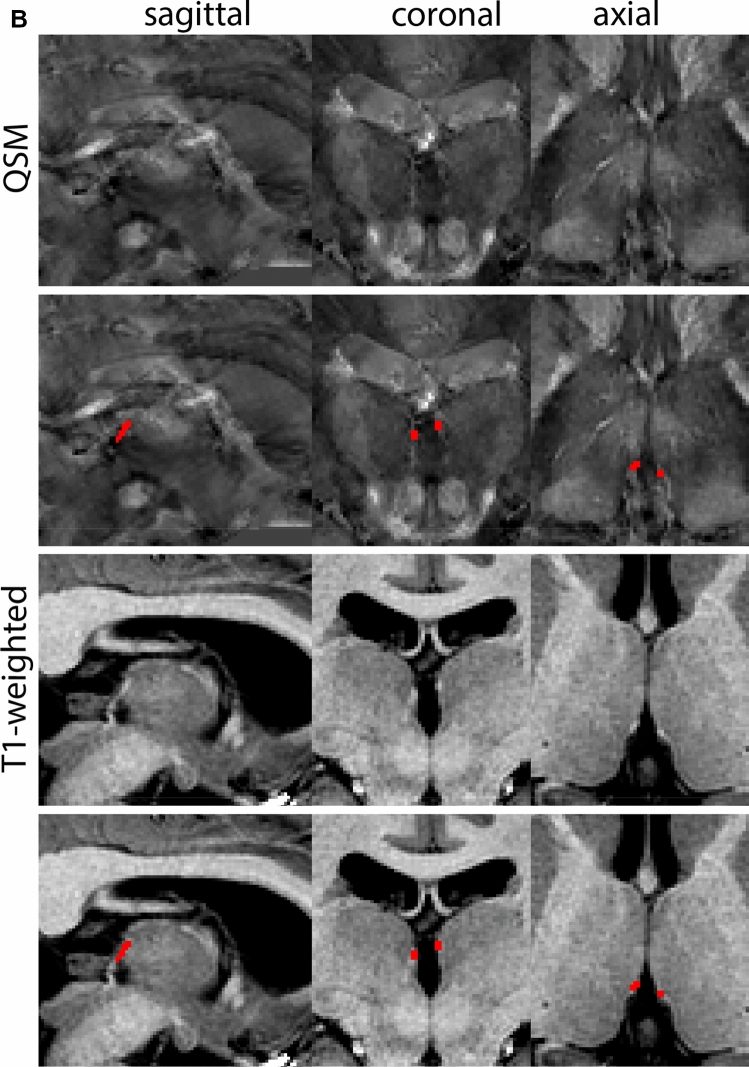
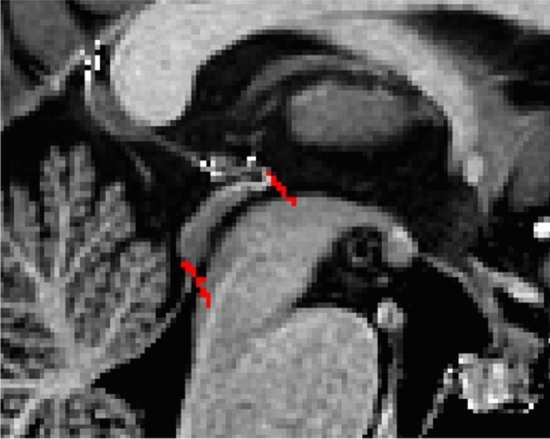
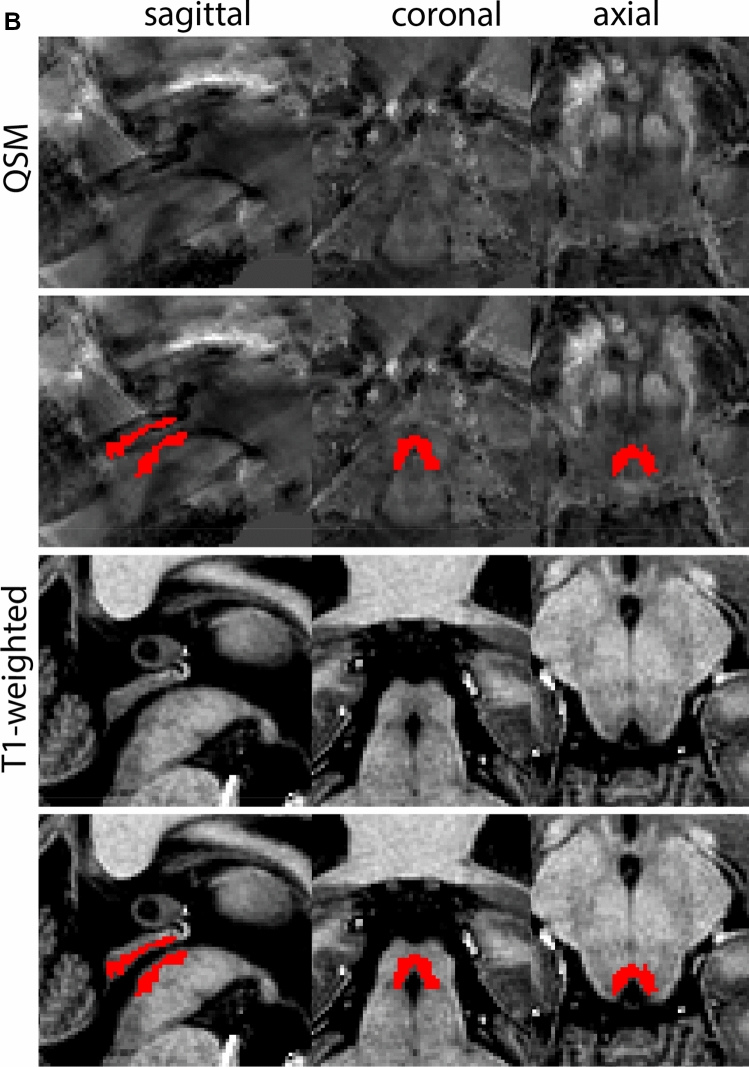
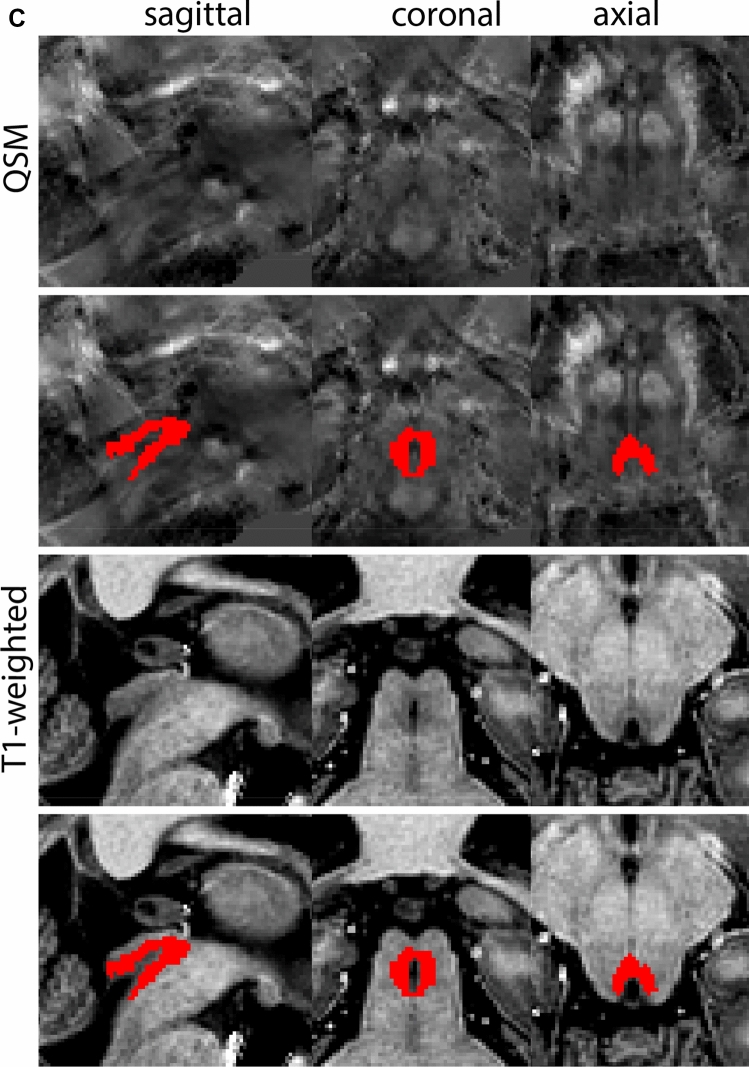
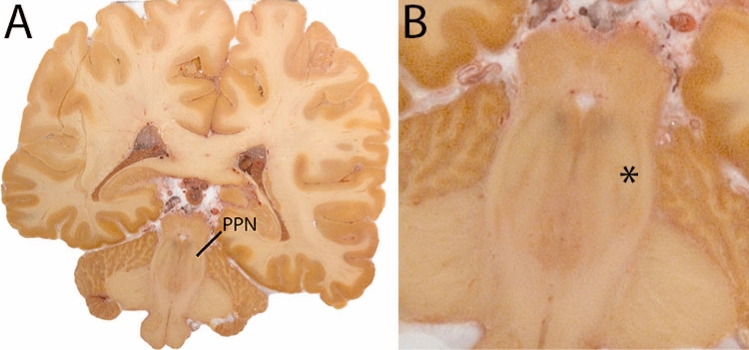
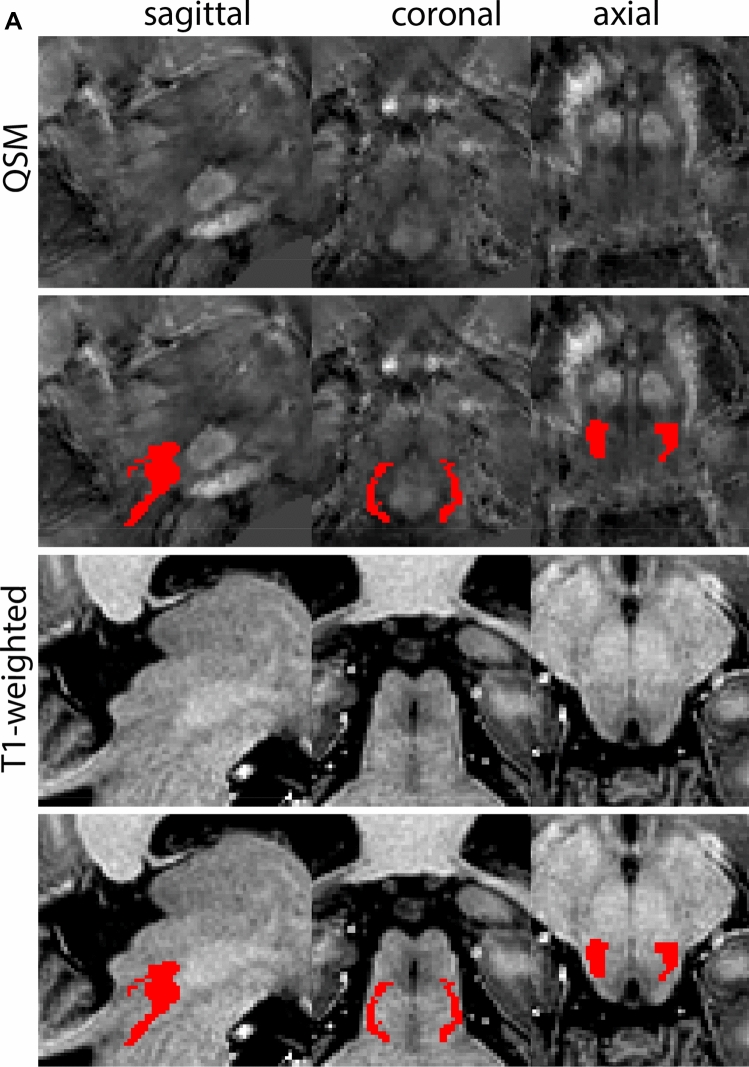
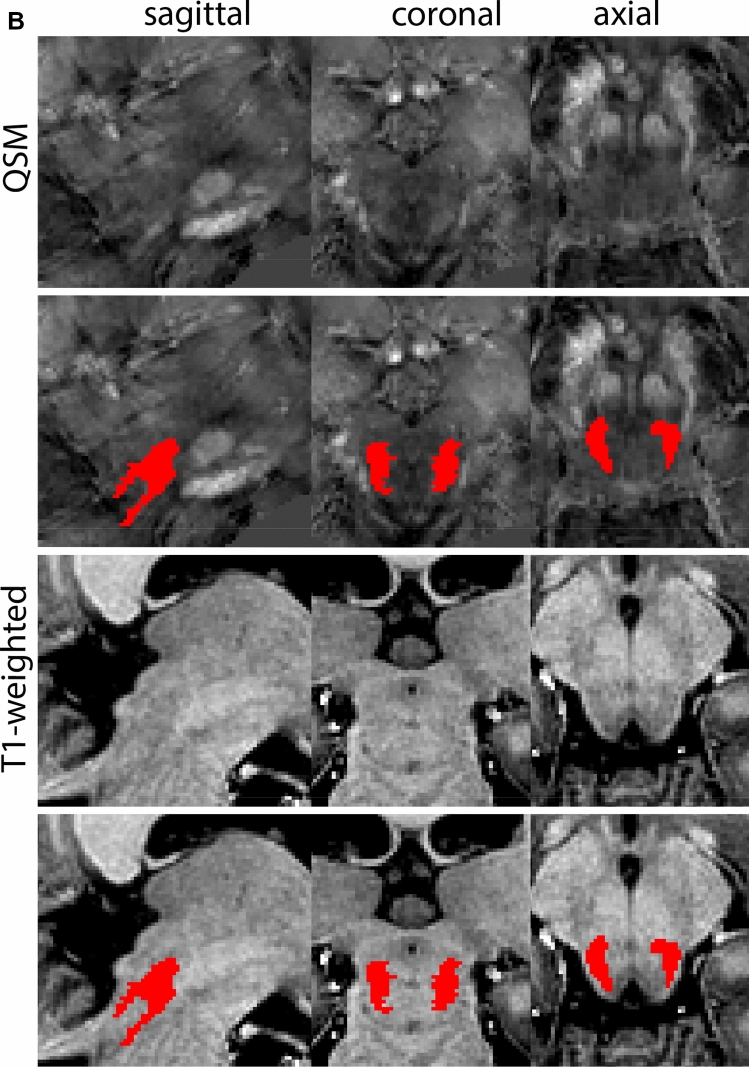
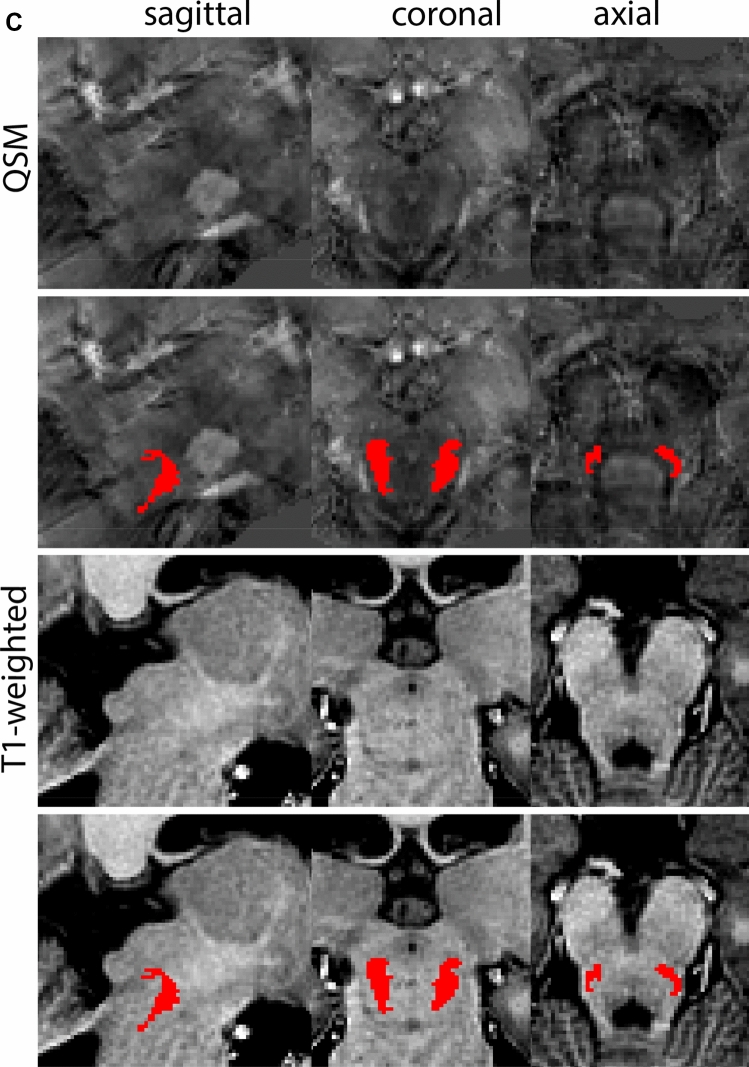
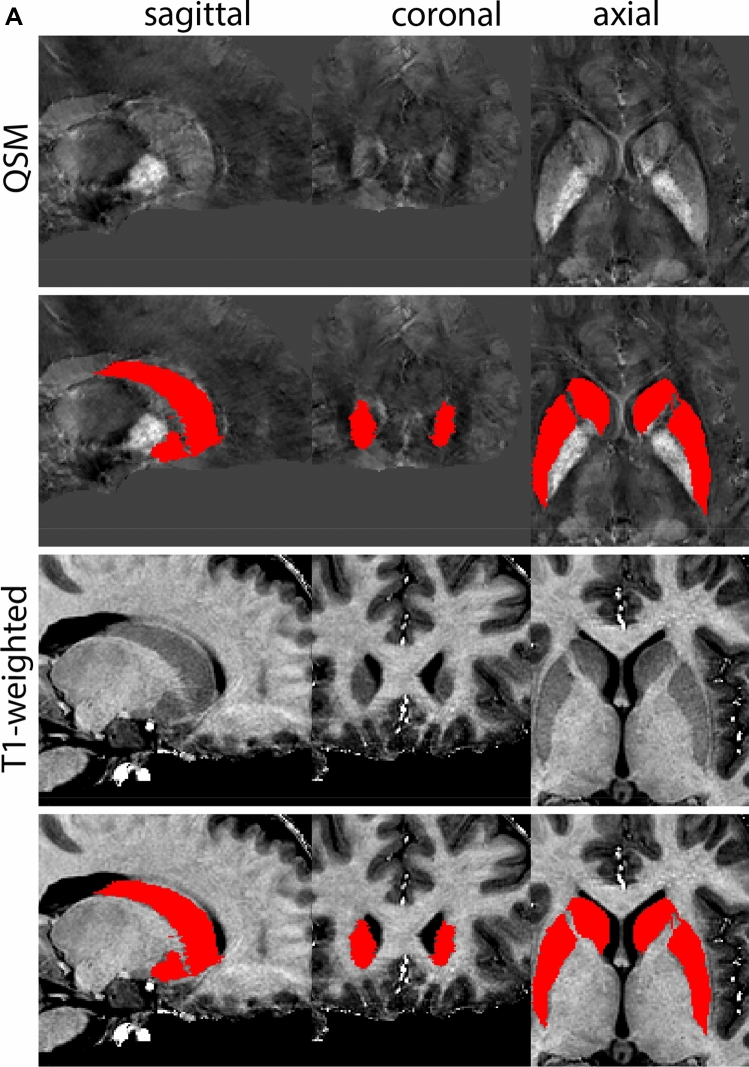
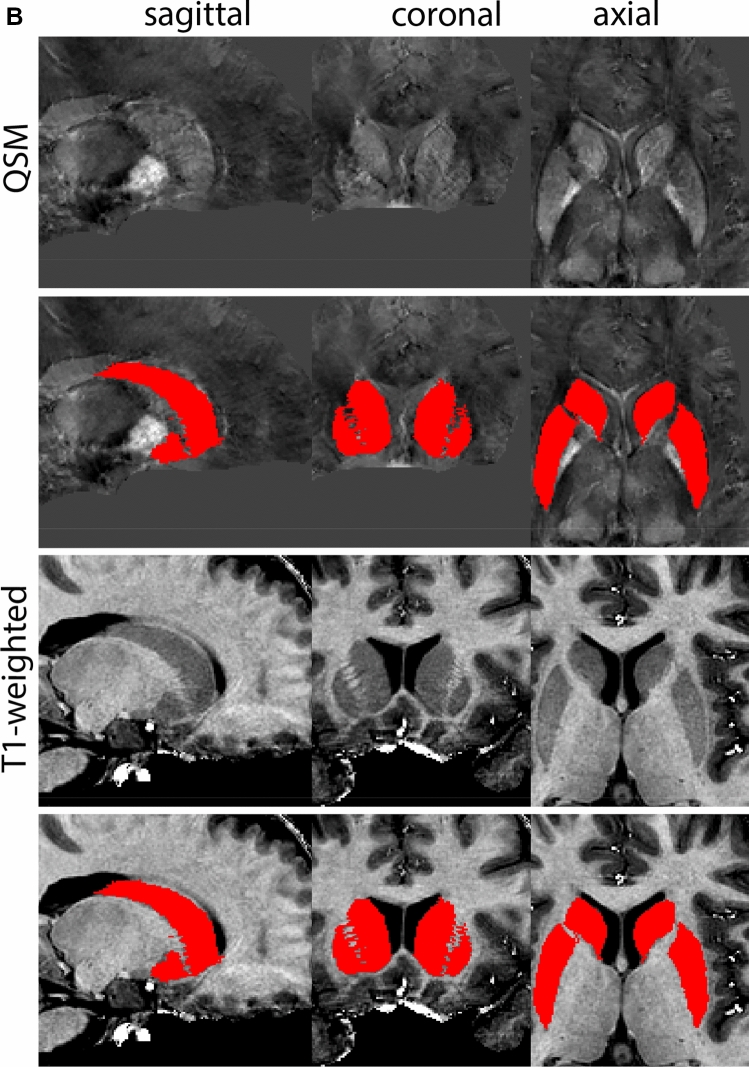
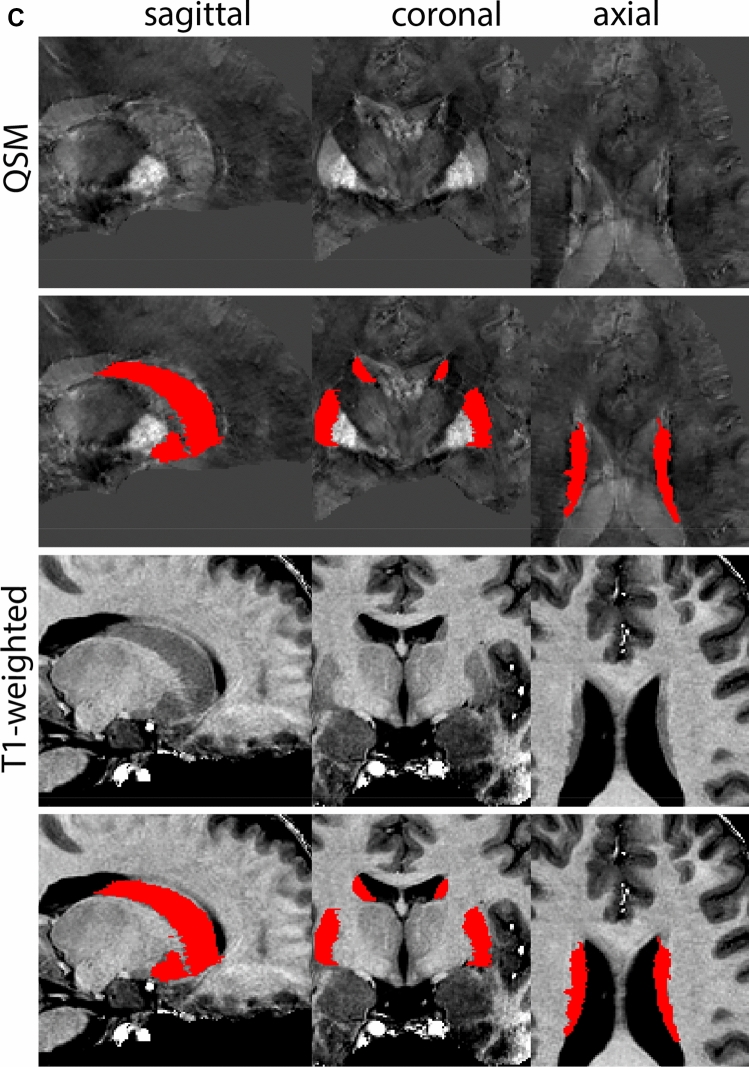
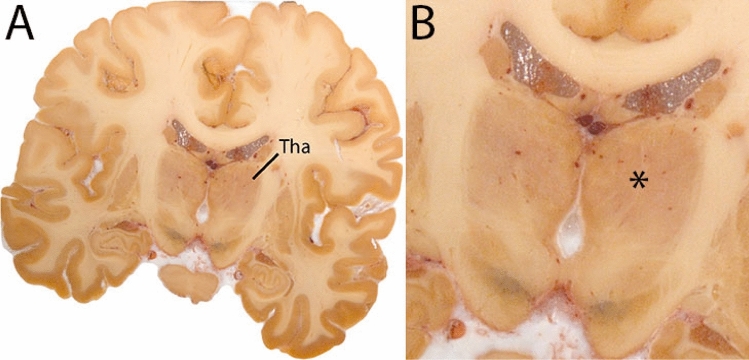
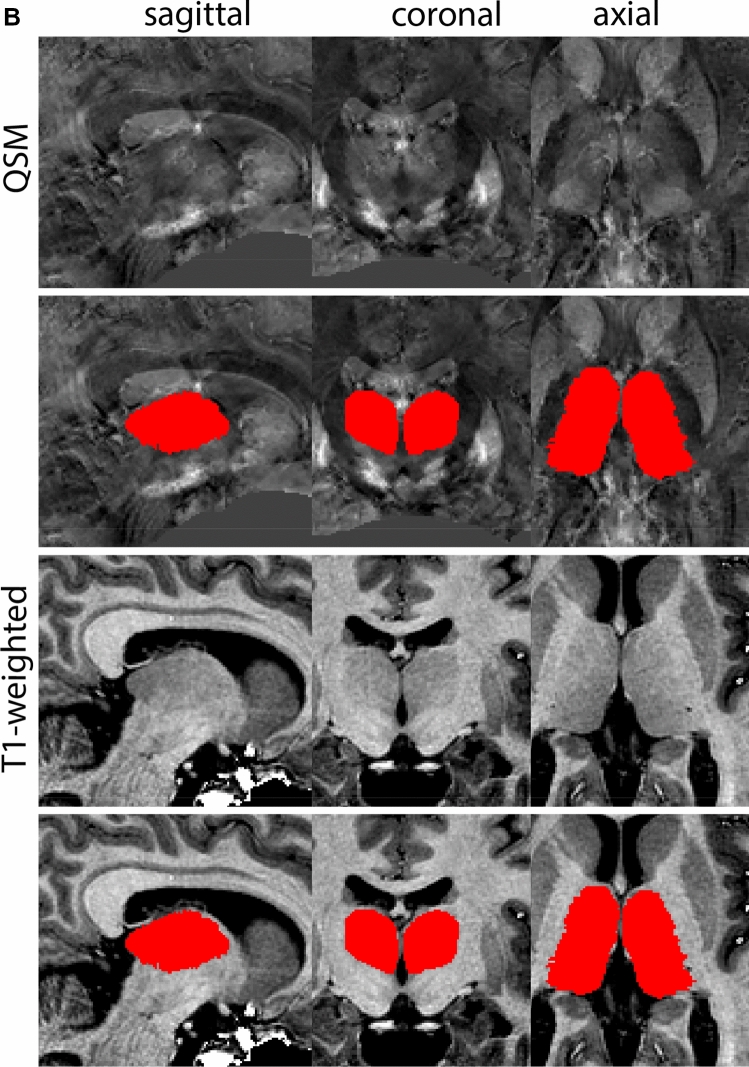
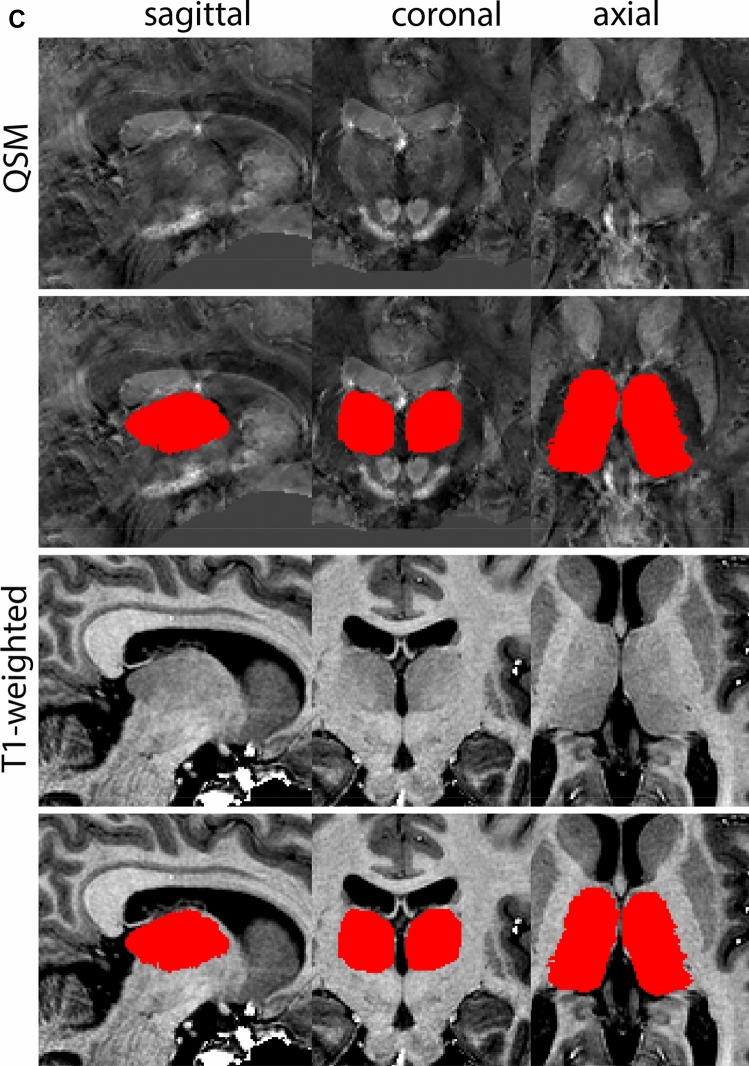
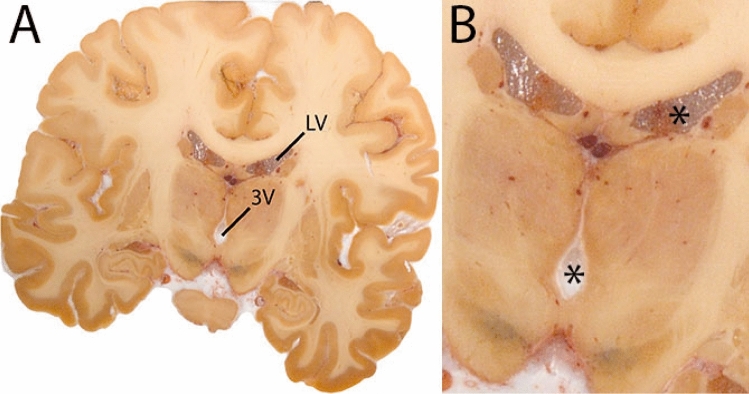
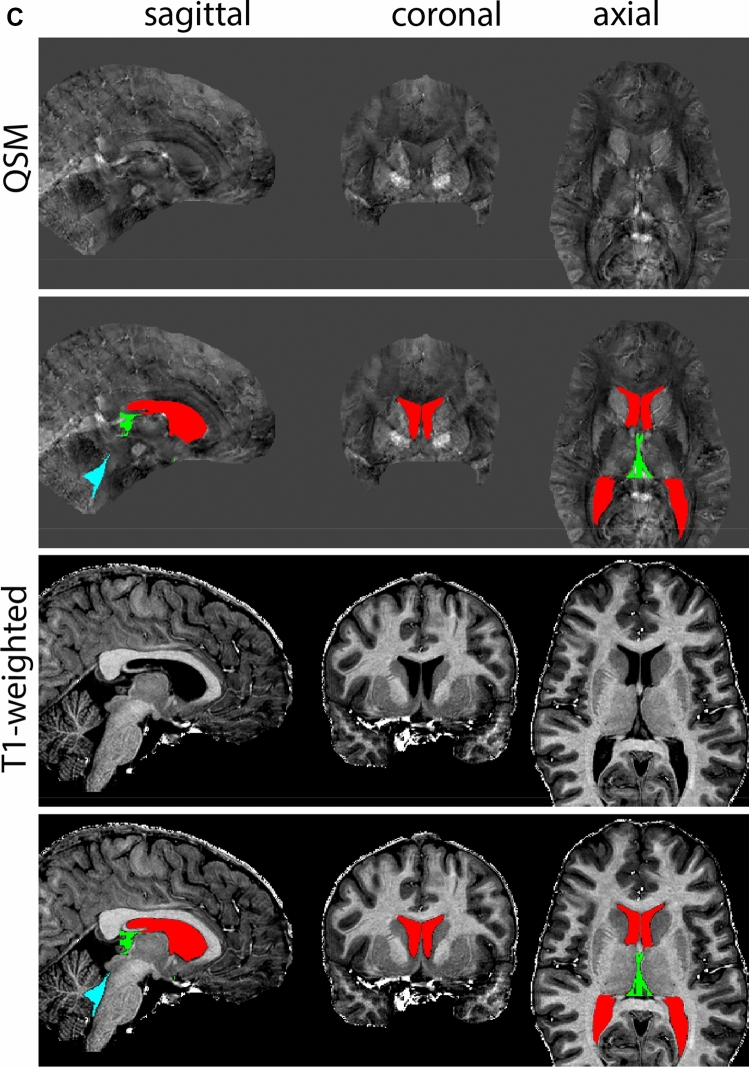
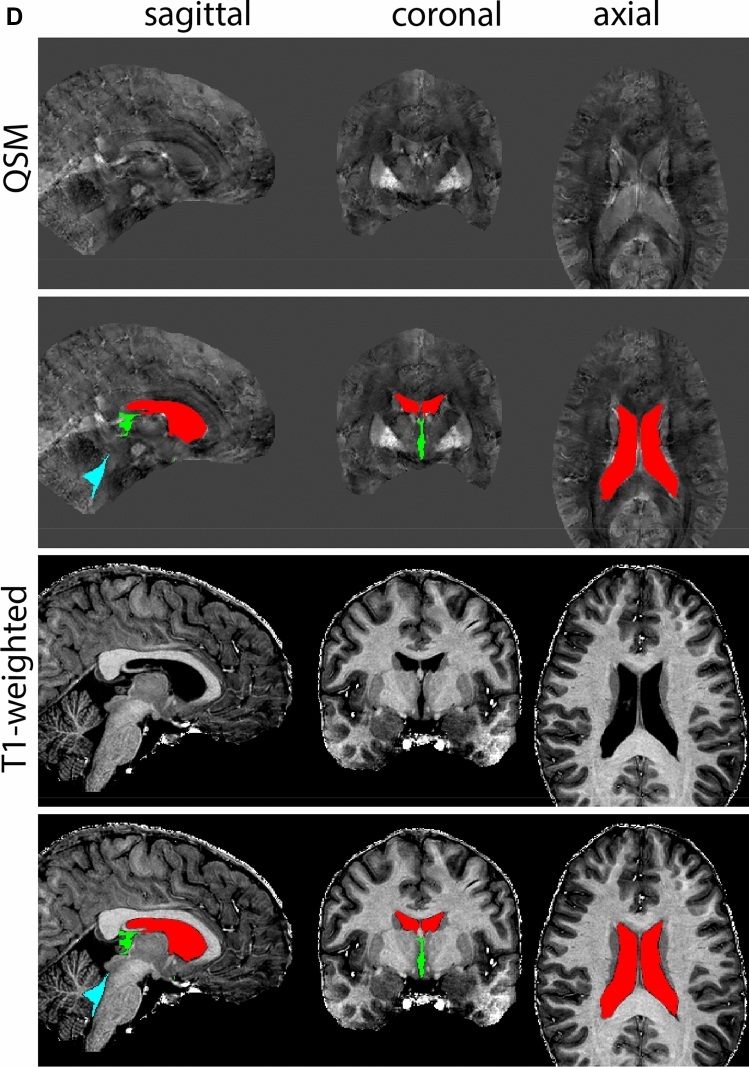
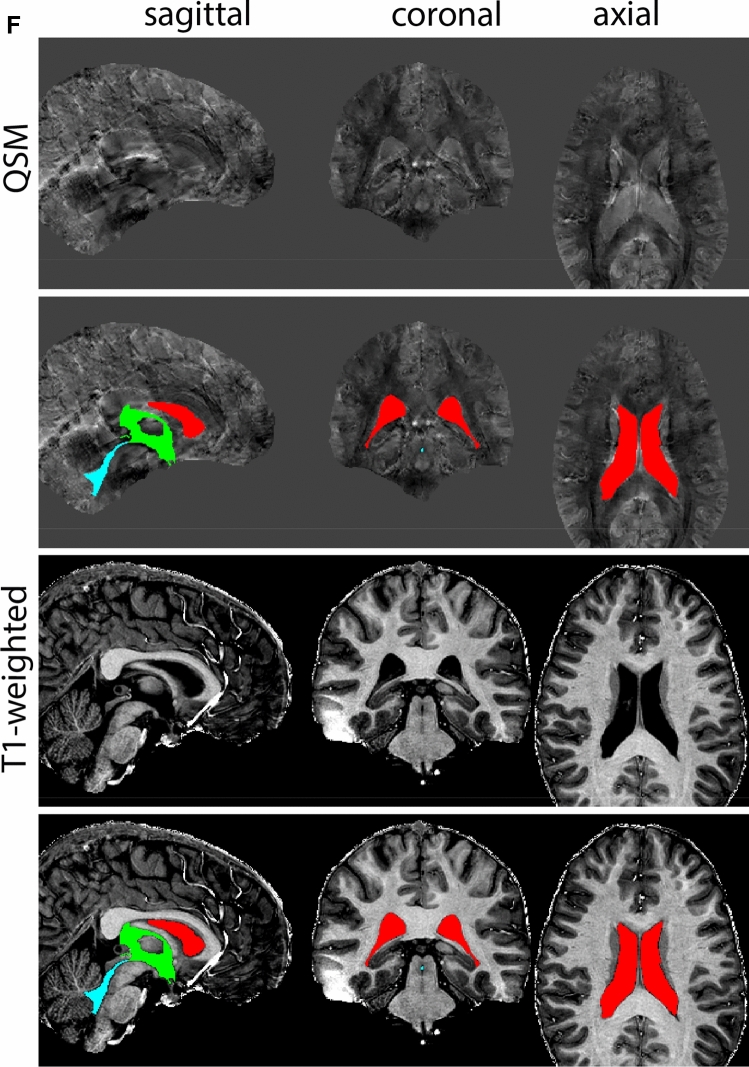
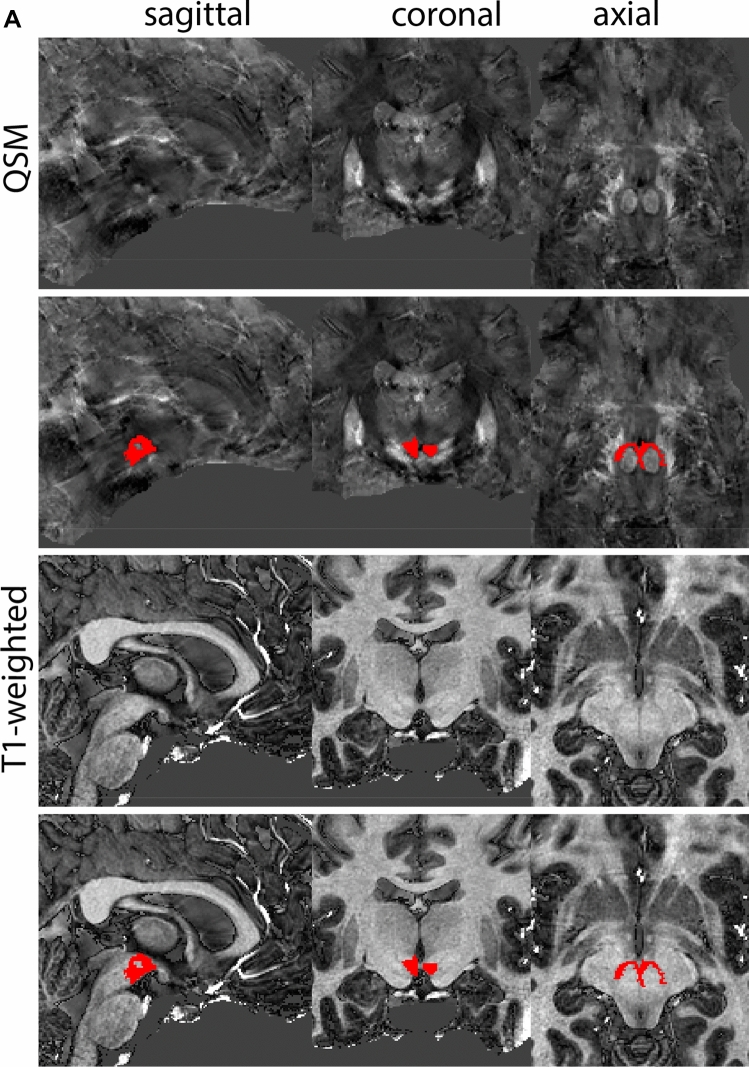
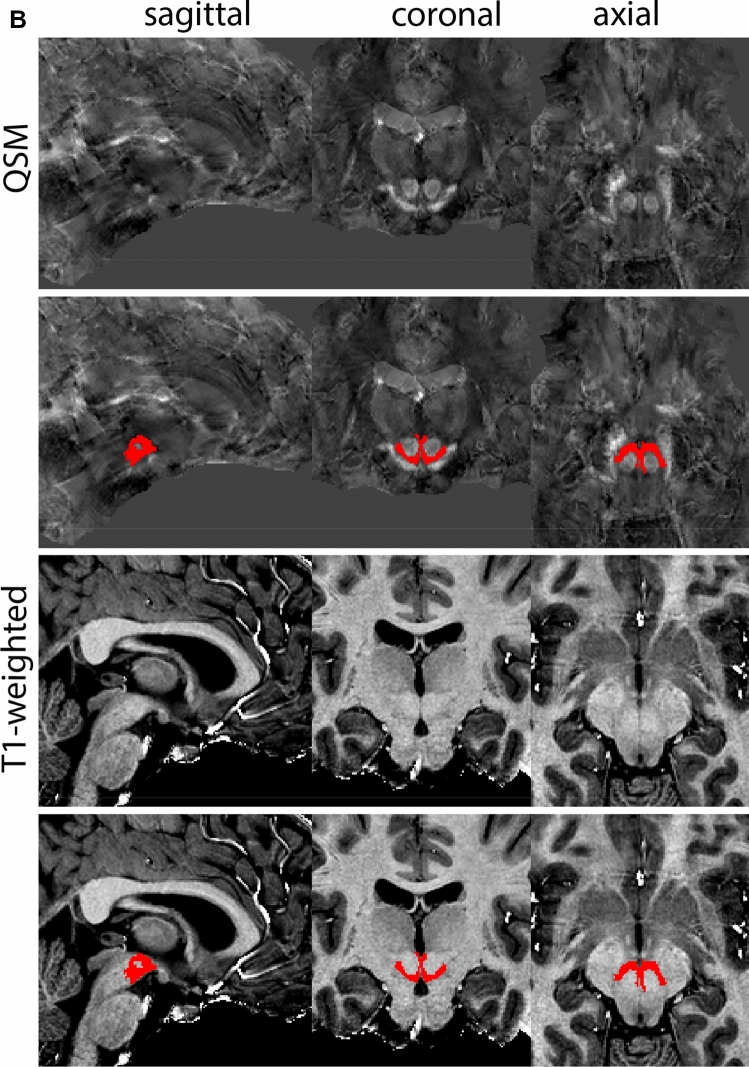
The growing interest in the human subcortex is accompanied by an increasing number of parcellation procedures to identify deep brain structures in magnetic resonance imaging (MRI) contrasts. Manual procedures continue to form the gold standard for parcellating brain structures and is used for the validation of automated approaches. Performing manual parcellations is a tedious process which requires a systematic and reproducible approach. For this purpose, we created a series of protocols for the anatomical delineation of 21 individual subcortical structures. The intelligibility of the protocols was assessed by calculating Dice similarity coefficients for ten healthy volunteers. In addition, dilated Dice coefficients showed that manual parcellations created using these protocols can provide high-quality training data for automated algorithms. Here, we share the protocols, together with three example MRI datasets and the created manual delineations. The protocols can be applied to create high-quality training data for automated parcellation procedures, as well as for further validation of existing procedures and are shared without restrictions with the research community.

Keywords: Basal ganglia; Probabilistic maps; Subcortex; Thalamus; Ultra-high field 7 Tesla structural MRI.


Conflict of interest statement

The authors declare no competing interests.

Figures

Fig. 1
Fig. 1
A Globus pallidus internal and external segment (GPi and GPe) in a central coronal view. B Magnification, asterisks indicate regions of interest
Fig. 2
Fig. 2
a Globus pallidus internal and external segment (GPi and GPe) in a central view on QSM. Top row QSM contrast. Note the separation between the GPi and GPe by the hypointense mml. Yellow = GPe, Light blue = GPi. b Globus pallidus internal and external segment (GPi and GPe) at the level of the mamillary bodies on a T1-weighted contrast. Top row T1-weigthed contrast. Note the boundary between the GPe and the hypointense striatum which is located lateral to the GPe, and the lack of contrast between the GPi and in in the T1-w contrast. Yellow = GPe, Light blue = GPi. c Globus pallidus internal and external segment (GPi and GPe) in the coronal plane on the QSM contrast at the level where the anterior commissure crosses the 3V (not visible on QSM). Top row QSM contrast. Note the absence of the GPi from the coronal (middle) panel at these rostral levels. Note the increased visibility of the dorsal GPi/e border as a result of the hypointense appearance of the internal capsule. Yellow = GPe, Light blue = GPi. d Globus pallidus internal and external segment (GPi and GPe) in a rostral view on T1-weighted contrast at a level in which the anterior commissure crosses the 3V. Top row T1-weigthed contrast. Note the limited contrast between the GPe, the internal capsule and the anterior commissure at this level. Note the limited visibility of the ventral pallidum. Yellow = GPe, Light blue = GPi. e Globus pallidus internal and external segment (GPi and GPe) in a caudal coronal view on a QSM contrast. Note the clear visibility of other iron-rich structures including the STN and SN at this level. Top row QSM contrast. Note the limited contrast between the GPe, the internal capsule and the anterior commissure at this level. Yellow = GPe, Light blue = GPi. f Globus pallidus internal and external segment (GPi and GPe) in a more caudal view on a T1-weighted contrast. Note the reduced visibility of other iron-rich structures including the STN and SN at this level as compared to the QSM contrast in Fig. 4a. Top row T1-weighted image, note the clear visibility of the border between the Str and the GPe. Yellow = GPe, Light blue = GPi
Fig. 2
Fig. 2
a Globus pallidus internal and external segment (GPi and GPe) in a central view on QSM. Top row QSM contrast. Note the separation between the GPi and GPe by the hypointense mml. Yellow = GPe, Light blue = GPi. b Globus pallidus internal and external segment (GPi and GPe) at the level of the mamillary bodies on a T1-weighted contrast. Top row T1-weigthed contrast. Note the boundary between the GPe and the hypointense striatum which is located lateral to the GPe, and the lack of contrast between the GPi and in in the T1-w contrast. Yellow = GPe, Light blue = GPi. c Globus pallidus internal and external segment (GPi and GPe) in the coronal plane on the QSM contrast at the level where the anterior commissure crosses the 3V (not visible on QSM). Top row QSM contrast. Note the absence of the GPi from the coronal (middle) panel at these rostral levels. Note the increased visibility of the dorsal GPi/e border as a result of the hypointense appearance of the internal capsule. Yellow = GPe, Light blue = GPi. d Globus pallidus internal and external segment (GPi and GPe) in a rostral view on T1-weighted contrast at a level in which the anterior commissure crosses the 3V. Top row T1-weigthed contrast. Note the limited contrast between the GPe, the internal capsule and the anterior commissure at this level. Note the limited visibility of the ventral pallidum. Yellow = GPe, Light blue = GPi. e Globus pallidus internal and external segment (GPi and GPe) in a caudal coronal view on a QSM contrast. Note the clear visibility of other iron-rich structures including the STN and SN at this level. Top row QSM contrast. Note the limited contrast between the GPe, the internal capsule and the anterior commissure at this level. Yellow = GPe, Light blue = GPi. f Globus pallidus internal and external segment (GPi and GPe) in a more caudal view on a T1-weighted contrast. Note the reduced visibility of other iron-rich structures including the STN and SN at this level as compared to the QSM contrast in Fig. 4a. Top row T1-weighted image, note the clear visibility of the border between the Str and the GPe. Yellow = GPe, Light blue = GPi
Fig. 3
Fig. 3
A Subthalamic nucleus (STN) in a central coronal view. B Magnification, the asterisk indicates the STN
Fig. 4
Fig. 4
a The subthalamic nucleus (STN, red) appears as a hyperintense structure in the QSM contrasts due to its high-iron content. At these levels, the substantia nigra (SN) and red nucleus (RN) also appear hyperintense in the QSM contrasts, and can be used for anatomical orientation. Note the increased visibility of the STN/SN border in the coronal view. Additionally, note the limited visibility of these structures in the T1-weighted contrast. b More rostral view of the STN at the level of the mamillary bodies (visible in the T1-weighted contrast). Note the slightly more medial position of the STN at this coronal level. c Caudal level of the STN. Note the slightly more lateral position of the STN in the coronal view
Fig. 4
Fig. 4
a The subthalamic nucleus (STN, red) appears as a hyperintense structure in the QSM contrasts due to its high-iron content. At these levels, the substantia nigra (SN) and red nucleus (RN) also appear hyperintense in the QSM contrasts, and can be used for anatomical orientation. Note the increased visibility of the STN/SN border in the coronal view. Additionally, note the limited visibility of these structures in the T1-weighted contrast. b More rostral view of the STN at the level of the mamillary bodies (visible in the T1-weighted contrast). Note the slightly more medial position of the STN at this coronal level. c Caudal level of the STN. Note the slightly more lateral position of the STN in the coronal view
Fig. 5
Fig. 5
A Substantia nigra in a central coronal view. Note location of the SN on the cerebral peduncle. B Magnification, asterisk indicates the SN. Note the dark colored neuromelanin
Fig. 6
Fig. 6
a The substantia nigra (SN) appears as a hyperintense structure on the QSM contrast as a result of its high iron content. In coronal levels, the medial part of the SN lies inferior to the lateral parts of the SN. The RN provides a clear anatomical reference point. Note the limited visibility of the SN on the T1-weighted contrast. b The substantia nigra (SN) decreases in size in more rostral levels. Note the clear visibility of the mamillary bodies at these levels in the T1-weighted contrast. c The substantia nigra (SN) decreases in size and appears in a larger angle in more caudal levels
Fig. 6
Fig. 6
a The substantia nigra (SN) appears as a hyperintense structure on the QSM contrast as a result of its high iron content. In coronal levels, the medial part of the SN lies inferior to the lateral parts of the SN. The RN provides a clear anatomical reference point. Note the limited visibility of the SN on the T1-weighted contrast. b The substantia nigra (SN) decreases in size in more rostral levels. Note the clear visibility of the mamillary bodies at these levels in the T1-weighted contrast. c The substantia nigra (SN) decreases in size and appears in a larger angle in more caudal levels
Fig. 7
Fig. 7
A Red nucleus (RN) in a central coronal view. B Magnification, asterisk indicates the RN. Note the typical rounded shape of the RN
Fig. 8
Fig. 8
a The red nucleus (RN) at a central level is clearly visible as a rounded structure in all three viewing planes in the QSM contrast. Note the limited visibility of the RN in the T1-weighted contrast. b The red nucleus (RN) at a rostral level can still clearly be identified as is decreased in size. Note the limited visibility of the RN in the T1-weighted contrast. c The red nucleus (RN) at a caudal level can still clearly be identified as is decreased in size. Note the limited visibility of the RN in the T1-weighted contrast
Fig. 8
Fig. 8
a The red nucleus (RN) at a central level is clearly visible as a rounded structure in all three viewing planes in the QSM contrast. Note the limited visibility of the RN in the T1-weighted contrast. b The red nucleus (RN) at a rostral level can still clearly be identified as is decreased in size. Note the limited visibility of the RN in the T1-weighted contrast. c The red nucleus (RN) at a caudal level can still clearly be identified as is decreased in size. Note the limited visibility of the RN in the T1-weighted contrast
Fig. 9
Fig. 9
A The amygdala (Amg) in a central coronal view. B Magnification, the asterisk indicates the location of the Amg
Fig. 10
Fig. 10
a The Amygdala (AMG) is a larger structure in the inferomedial temporal lobe. Note the clipping in the QSM images. b The Amygdala (AMG) is a larger structure in the inferomedial temporal lobe at more inferior levels (axial view). Note the clipping in the QSM images. c The Amygdala (AMG) is a larger structure in the inferomedial temporal lobe at the most inferior levels (axial view). Note the clipping in the QSM images
Fig. 10
Fig. 10
a The Amygdala (AMG) is a larger structure in the inferomedial temporal lobe. Note the clipping in the QSM images. b The Amygdala (AMG) is a larger structure in the inferomedial temporal lobe at more inferior levels (axial view). Note the clipping in the QSM images. c The Amygdala (AMG) is a larger structure in the inferomedial temporal lobe at the most inferior levels (axial view). Note the clipping in the QSM images
Fig. 11
Fig. 11
A The claustrum (Cl) shown in a central coronal view, is a thin grey matter structure between the external and extreme capsule. B Magnification, the astersisk indicates the location of the Cl
Fig. 12
Fig. 12
a The Claustrum is a thin grey matter sheet located between the external and extreme capsule. b The Claustrum is a thin grey matter sheet located between the external and extreme capsule. Note the peculiar appearance in the sagittal view, which results from the folding of the sheet
Fig. 12
Fig. 12
a The Claustrum is a thin grey matter sheet located between the external and extreme capsule. b The Claustrum is a thin grey matter sheet located between the external and extreme capsule. Note the peculiar appearance in the sagittal view, which results from the folding of the sheet
Fig. 13
Fig. 13
A The fornix is a large WM structure that connects the hippocampus and the mamillary bodies (MB), and shown here at the level of the anterior commissure. Due to its curvature, in the hypothalamus it can be identified as the fornical columns that move down to the MB as well as a midline structure located inferior to the corpus callosum. B Magnification, asterisk indicates the fornix. Note the red appearance of the septal veins due to remaining red blood cells in the tissue
Fig. 14
Fig. 14
a The fornix (fx) is a large C-shaped white matter structure shown here at the level of the anterior commissure. b The fornix (fx) is a large C-shaped white matter structure. Note that at the level of the hypothalamus the fx has formed two columns that will connect to the mamillary bodies (MB). c The fornix (fx) is a large C-shaped white matter structure. Note the disappearance of the fornical columns posterior to the mamillary bodies
Fig. 14
Fig. 14
a The fornix (fx) is a large C-shaped white matter structure shown here at the level of the anterior commissure. b The fornix (fx) is a large C-shaped white matter structure. Note that at the level of the hypothalamus the fx has formed two columns that will connect to the mamillary bodies (MB). c The fornix (fx) is a large C-shaped white matter structure. Note the disappearance of the fornical columns posterior to the mamillary bodies
Fig. 15
Fig. 15
A The internal capsule (ic) shown at a central coronal level. B Magnification, ic is indicated by the asterisk. Note its white appearance
Fig. 16
Fig. 16
a The internal capsule (ic) is a white matter structure that separates the caudate nucleus from the dorsal striatum, carrying from and to cerebral cortex. Note the limited contrast in the T1-weighted scans between ic and the Globus Pallidus, and the additional contrast provided by the QSM contrast. b The internal capsule (ic) is a white matter structure that separates the caudate nucleus from the dorsal striatum. Note the clear appearance of striatal islands that lead to a jagged appearance of the ic. c The internal capsule (ic) is a white matter structure that separates the caudate nucleus from the dorsal striatum, carrying from and to cerebral cortex. d The internal capsule (ic) is a white matter structure that separates the caudate nucleus from the dorsal striatum, carrying from and to cerebral cortex
Fig. 16
Fig. 16
a The internal capsule (ic) is a white matter structure that separates the caudate nucleus from the dorsal striatum, carrying from and to cerebral cortex. Note the limited contrast in the T1-weighted scans between ic and the Globus Pallidus, and the additional contrast provided by the QSM contrast. b The internal capsule (ic) is a white matter structure that separates the caudate nucleus from the dorsal striatum. Note the clear appearance of striatal islands that lead to a jagged appearance of the ic. c The internal capsule (ic) is a white matter structure that separates the caudate nucleus from the dorsal striatum, carrying from and to cerebral cortex. d The internal capsule (ic) is a white matter structure that separates the caudate nucleus from the dorsal striatum, carrying from and to cerebral cortex
Fig. 17
Fig. 17
A The superior and inferior colliculus (sCO and iCO) in the midbrain and border the CSF which facilitates delineations. B Magnification, asterisks indicate the structrures of interest
Fig. 18
Fig. 18
a The inferior colliculus can easily be located due to the characteristic location at the mesencephalic tectum. b The superior colliculus can easily be located due to the characteristic location at the mesencephalic tectum above the inferior colliculus (sagittal view)
Fig. 18
Fig. 18
a The inferior colliculus can easily be located due to the characteristic location at the mesencephalic tectum. b The superior colliculus can easily be located due to the characteristic location at the mesencephalic tectum above the inferior colliculus (sagittal view)
Fig. 19
Fig. 19
A The Habenula (LH) is a small structure medial from the Tha, and comprises the Medial and Lateral Habenula. B Magnificaiton, note the protrusion into the 3V
Fig. 20
Fig. 20
a The habenular complex is visible as a hyperintense structure on T1-weigthed images. Note the modest size of the structure. b The habenular complex is visible as a hyperintense structure on T1-weigthed images. Note the slightly elongated shape in the sagittal view
Fig. 20
Fig. 20
a The habenular complex is visible as a hyperintense structure on T1-weigthed images. Note the modest size of the structure. b The habenular complex is visible as a hyperintense structure on T1-weigthed images. Note the slightly elongated shape in the sagittal view
Fig. 21
Fig. 21
A The Periaqueductal and periventricular grey (PAG) form a grey matter column which lines the midbrain aqueduct. B Magnification, asterisk indicates the PAG
Fig. 22
Fig. 22
Starting point for the parcellations. Red marks indicate the upper and lower border of the midbrain aqueduct in the sagittal plane
Fig. 23
Fig. 23
a The periaqueductal and periventricular grey surround the midbrain aqueduct. Note the visibility of the borders on the T1-weigthed images on which it appears as a hypointense structure. b The periaqueductal and periventricular grey surround the midbrain aqueduct. Note the apparent division in two structures in the sagittal plane, which results from the cross-cut of the structure. c The periaqueductal and periventricular grey surround the midbrain aqueduct. Note the partial division in the sagittal plane, which results from the cross-cut of the structure
Fig. 23
Fig. 23
a The periaqueductal and periventricular grey surround the midbrain aqueduct. Note the visibility of the borders on the T1-weigthed images on which it appears as a hypointense structure. b The periaqueductal and periventricular grey surround the midbrain aqueduct. Note the apparent division in two structures in the sagittal plane, which results from the cross-cut of the structure. c The periaqueductal and periventricular grey surround the midbrain aqueduct. Note the partial division in the sagittal plane, which results from the cross-cut of the structure
Fig. 24
Fig. 24
A The Pedunculopontine nucleus indicates at a central level. B Magnification, asterisk indicates the PPN
Fig. 25
Fig. 25
a The pedunculopontine nucleus (PPN) is a grey matter structure located in a white matter rich area. As a result it presents as a relatively hypointense structure on T1-weighted images. b The pedunculopontine nucleus (PPN) is a grey matter structure located in a white matter rich area. As a result it presents as a relatively hypointense structure on T1-weighted images. Note the appearance of the PPN in the sagittal plane at this level. c The pedunculopontine nucleus is a grey matter structure located in a white matter rich area. As a result it presents as a relatively hypointense structure on T1-weighted images. Note the difference in the sagittal appearance with (b)
Fig. 25
Fig. 25
a The pedunculopontine nucleus (PPN) is a grey matter structure located in a white matter rich area. As a result it presents as a relatively hypointense structure on T1-weighted images. b The pedunculopontine nucleus (PPN) is a grey matter structure located in a white matter rich area. As a result it presents as a relatively hypointense structure on T1-weighted images. Note the appearance of the PPN in the sagittal plane at this level. c The pedunculopontine nucleus is a grey matter structure located in a white matter rich area. As a result it presents as a relatively hypointense structure on T1-weighted images. Note the difference in the sagittal appearance with (b)
Fig. 26
Fig. 26
A The subcallosal cingulate gyrus (SCG) is located under the corpus callosum. B Magnification, asterisk indicates the SCG
Fig. 27
Fig. 27
The Subcallosal Cingulate Gyrus (SCG) mask only contains an outline of the WM. Note the frontal border of the structure in the sagittal, which is defined by the corpus callosum
Fig. 28
Fig. 28
A The striatum (Str) includes the caudate (top), putamen (bottom) and Nucleus Accumbens (visible at more rostral levels). The borders between these structures cannot be visualized using MRI and the striatum is therefore parcellated as a single structure. B Magnification, asterisks indicate caudate and putamen
Fig. 29
Fig. 29
a The striatum (Str) at rostral levels shows the caudate nucleus. Note the clear visibility on T1-weighted contrasts. b The striatum (Str) at somewhat more caudal levels shows the caudate nucleus and the putamen. Note the clear striatal islands in the ic. c The striatum (Str) at even more caudal levels shows STR shifting in lateral direction at the level of the (hypo-) thalamus. d The striatum (Str) becomes patchy and disappears in the coronal plane
Fig. 29
Fig. 29
a The striatum (Str) at rostral levels shows the caudate nucleus. Note the clear visibility on T1-weighted contrasts. b The striatum (Str) at somewhat more caudal levels shows the caudate nucleus and the putamen. Note the clear striatal islands in the ic. c The striatum (Str) at even more caudal levels shows STR shifting in lateral direction at the level of the (hypo-) thalamus. d The striatum (Str) becomes patchy and disappears in the coronal plane
Fig. 30
Fig. 30
A The thalamus (Tha) shown here at the level of the SN and STN consists of many individual nuclei, which are bordered medially by the 3V and laterally by the white matter of the external medullary lamina. The thalamus is parcellated as a single structure. B Magnification, asterisk indicates Tha. Note the internal lamina visible in this image
Fig. 31
Fig. 31
a The thalamus (Tha) is a large rounded ovoid structure in the diencephalon Note the location dorsal to the hypothalamic sulcus. b The thalamus (Tha) is a large rounded ovoid structure in the diencephalon. Note the clear visibility of the SN and S at these levels in the QSM contrast c The thalamus (Tha) is a large rounded ovoid structure in the diencephalon. Note the clear visibility of the SN, STN, and RN at these levels in the QSM contrast. d The thalamus (Tha) is a large rounded ovoid structure in the diencephalon. Note the appearance of the geniculate bodies. e The thalamus (Tha) is a large rounded ovoid structure in the diencephalon. Note the medial and lateral geniculate bodies, which protrude from the main structure in the coronal plane. f The thalamus (Tha) is a large rounded ovoid structure in the diencephalon. At caudal levels the characteristic shape of the pulvinar nucleus is clearly visible
Fig. 31
Fig. 31
a The thalamus (Tha) is a large rounded ovoid structure in the diencephalon Note the location dorsal to the hypothalamic sulcus. b The thalamus (Tha) is a large rounded ovoid structure in the diencephalon. Note the clear visibility of the SN and S at these levels in the QSM contrast c The thalamus (Tha) is a large rounded ovoid structure in the diencephalon. Note the clear visibility of the SN, STN, and RN at these levels in the QSM contrast. d The thalamus (Tha) is a large rounded ovoid structure in the diencephalon. Note the appearance of the geniculate bodies. e The thalamus (Tha) is a large rounded ovoid structure in the diencephalon. Note the medial and lateral geniculate bodies, which protrude from the main structure in the coronal plane. f The thalamus (Tha) is a large rounded ovoid structure in the diencephalon. At caudal levels the characteristic shape of the pulvinar nucleus is clearly visible
Fig. 32
Fig. 32
A The ventricular system is divided in the lateral ventricles (LV), 3V and 4V. B Magnification, asterisks indicate the LV and 3V
Fig. 33
Fig. 33
a The ventricular system parcellation includes the connecting aqueducts between the ventricles. Note the clear visibility on T1-weighted contrasts. LV is shown in red, 3V in green and 4V in turquois. b The ventricular system parcellation includes the connecting aqueducts between the ventricles. Note the clear visibility on T1-weighted contrasts. LV is shown in red, 3V in green and 4V in turquois. c The ventricular system parcellation includes the connecting aqueducts between the ventricles. Note the coronal level, anterior to the attachment of the optic chiasm to the mediobasal hypothalamus to form the 3V. LV is shown in red, 3V in green and 4V in turquois. d The ventricular system parcellation includes the connecting aqueducts between the ventricles. Note the coronal level, where the 3V and LV connect. LV is shown in red, 3V in green and 4V in turquois. e The ventricular system parcellation includes the connecting aqueducts between the ventricles. Note the coronal level, where the temporal horn of the LV is barely visible. LV is shown in red, 3V in green and 4V in turquois. f The ventricular system parcellation includes the connecting aqueducts between the ventricles. Note the shape of the LV in the coronal level. LV is shown in red, 3V in green and 4V in turquois. g The ventricular system parcellation includes the connecting aqueducts between the ventricles. Note the shape of the LV in the coronal level towards their most caudal extent. LV is shown in red, 3V in green and 4V in turquois
Fig. 33
Fig. 33
a The ventricular system parcellation includes the connecting aqueducts between the ventricles. Note the clear visibility on T1-weighted contrasts. LV is shown in red, 3V in green and 4V in turquois. b The ventricular system parcellation includes the connecting aqueducts between the ventricles. Note the clear visibility on T1-weighted contrasts. LV is shown in red, 3V in green and 4V in turquois. c The ventricular system parcellation includes the connecting aqueducts between the ventricles. Note the coronal level, anterior to the attachment of the optic chiasm to the mediobasal hypothalamus to form the 3V. LV is shown in red, 3V in green and 4V in turquois. d The ventricular system parcellation includes the connecting aqueducts between the ventricles. Note the coronal level, where the 3V and LV connect. LV is shown in red, 3V in green and 4V in turquois. e The ventricular system parcellation includes the connecting aqueducts between the ventricles. Note the coronal level, where the temporal horn of the LV is barely visible. LV is shown in red, 3V in green and 4V in turquois. f The ventricular system parcellation includes the connecting aqueducts between the ventricles. Note the shape of the LV in the coronal level. LV is shown in red, 3V in green and 4V in turquois. g The ventricular system parcellation includes the connecting aqueducts between the ventricles. Note the shape of the LV in the coronal level towards their most caudal extent. LV is shown in red, 3V in green and 4V in turquois
Fig. 34
Fig. 34
A The ventral tegmental area (VTA) has poorly defined anatomical borders, and is mainly delineated based on anatomical landmarks including the RN and SN. B Magnification, VTA is indicated by the asterisk. Note the clear appearance of the RN and SN which are used as landmarks
Fig. 35
Fig. 35
a The ventral tegmental area (VTA) curves around the RN, which is clearly visible in the axial plane in QSM contrasts at this level. b The ventral tegmental area (VTA) curves around the RN, which is clearly visible in the coronal and axial plane in QSM contrasts at this level. c The ventral tegmental area (VTA) at a more caudal coronal level
Fig. 35
Fig. 35
a The ventral tegmental area (VTA) curves around the RN, which is clearly visible in the axial plane in QSM contrasts at this level. b The ventral tegmental area (VTA) curves around the RN, which is clearly visible in the coronal and axial plane in QSM contrasts at this level. c The ventral tegmental area (VTA) at a more caudal coronal level

References

    1. Alkemade A, Keuken MC, Forstmann BU. A perspective on terra incognita: uncovering the neuroanatomy of the human subcortex. Front Neuroanat. 2013;7:40. doi: 10.3389/fnana.2013.00040. - DOI - PMC - PubMed
    1. Alkemade A, de Hollander G, Keuken MC, et al. Comparison of T2*-weighted and QSM contrasts in Parkinson’s disease to visualize the STN with MRI. PLoS ONE. 2017;12:e0176130. doi: 10.1371/journal.pone.0176130. - DOI - PMC - PubMed
    1. Alkemade A, Mulder MJ, Groot JM, et al. The Amsterdam Ultra-high field adult lifespan database (AHEAD): a freely available multimodal 7 Tesla submillimeter magnetic resonance imaging database. Neuroimage. 2020;221:117200. doi: 10.1016/j.neuroimage.2020.117200. - DOI - PubMed
    1. Alkemade A, Pine K, Kirilina E, et al. 7 Tesla MRI followed by histological 3D reconstructions in whole-brain specimens. Front Neuroanat. 2020 doi: 10.3389/fnana.2020.536838. - DOI - PMC - PubMed
    1. Andersen HH, Johnsen KB, Moos T. Iron deposits in the chronically inflamed central nervous system and contributes to neurodegeneration. Cell Mol Life Sci. 2014;71:1607–1622. doi: 10.1007/s00018-013-1509-8. - DOI - PMC - PubMed

LinkOut - more resources