. 2021 Oct 29;6(64):eabi8800.
doi: 10.1126/sciimmunol.abi8800. Epub 2021 Oct 29.

Lack of CD8+ T cell effector differentiation during priming mediates checkpoint blockade resistance in non-small cell lung cancer

Affiliations

Lack of CD8+ T cell effector differentiation during priming mediates checkpoint blockade resistance in non-small cell lung cancer

Brendan L Horton et al. Sci Immunol. .

Abstract

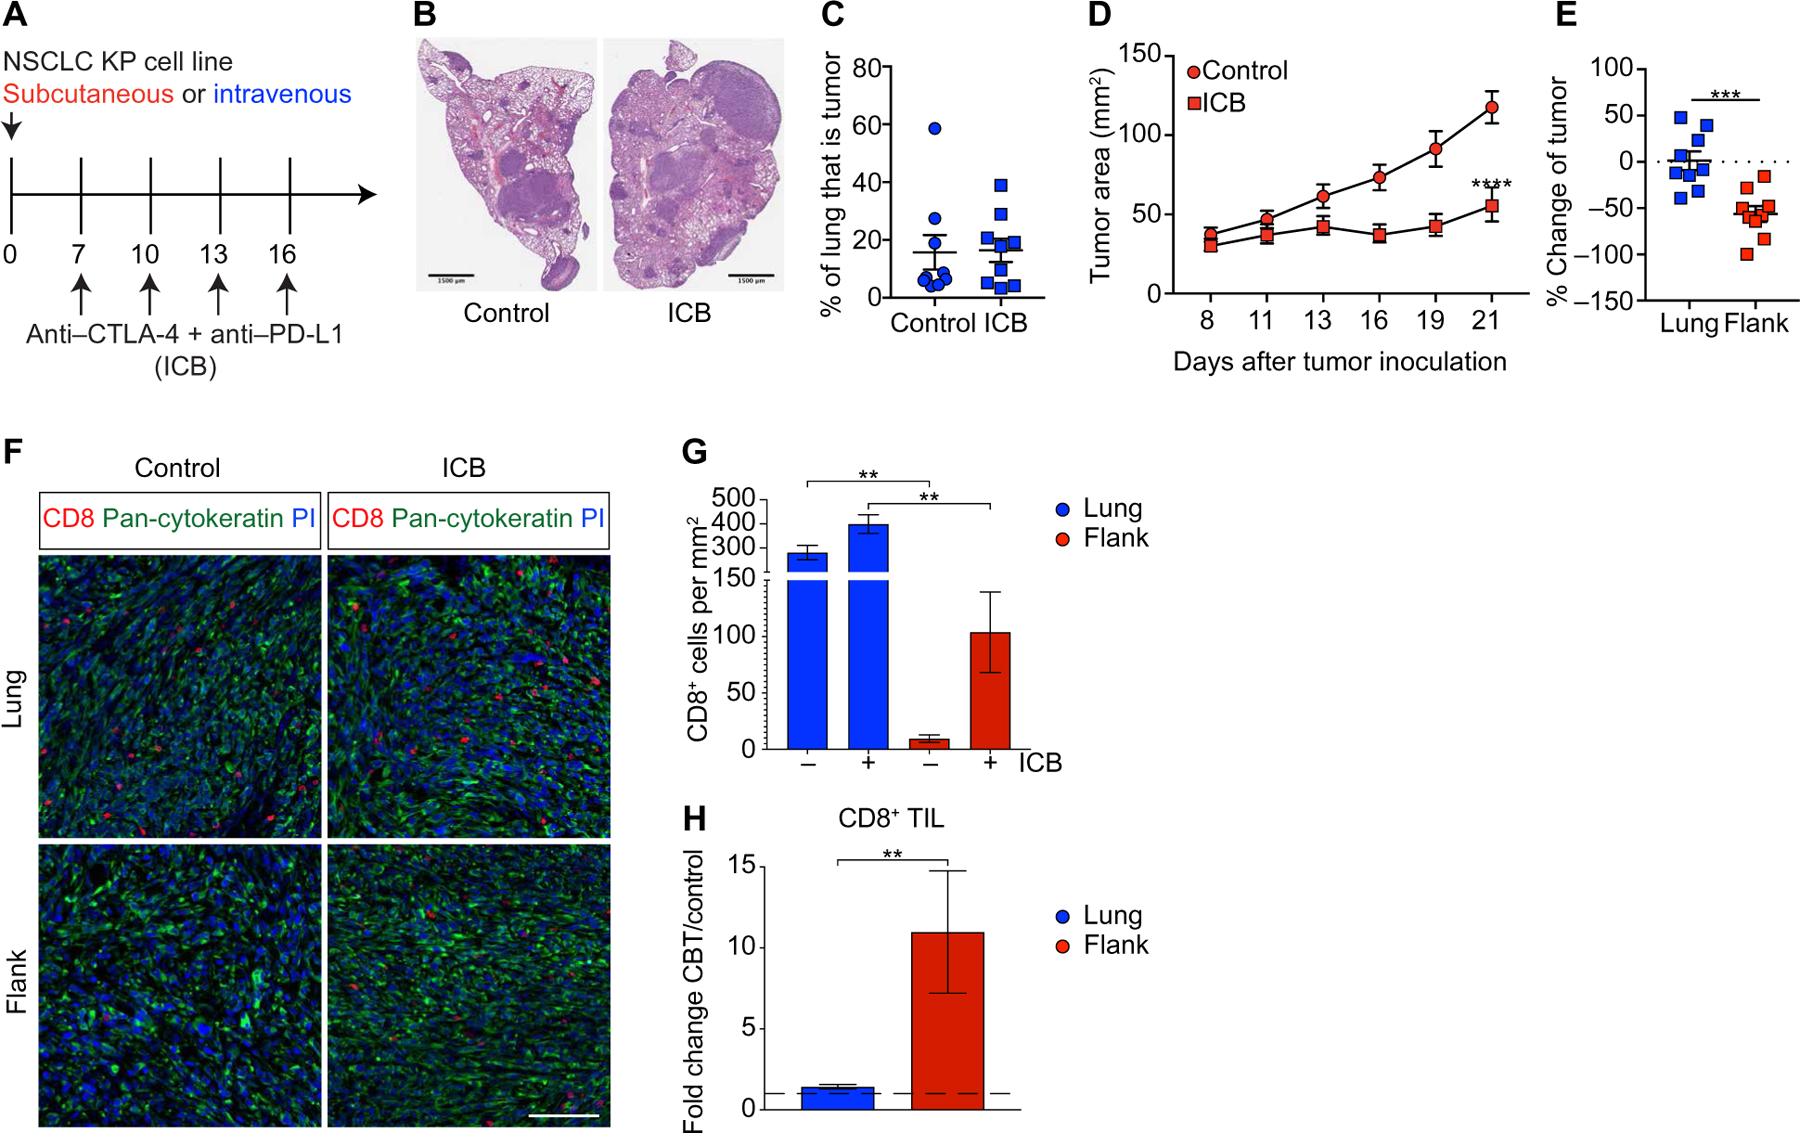
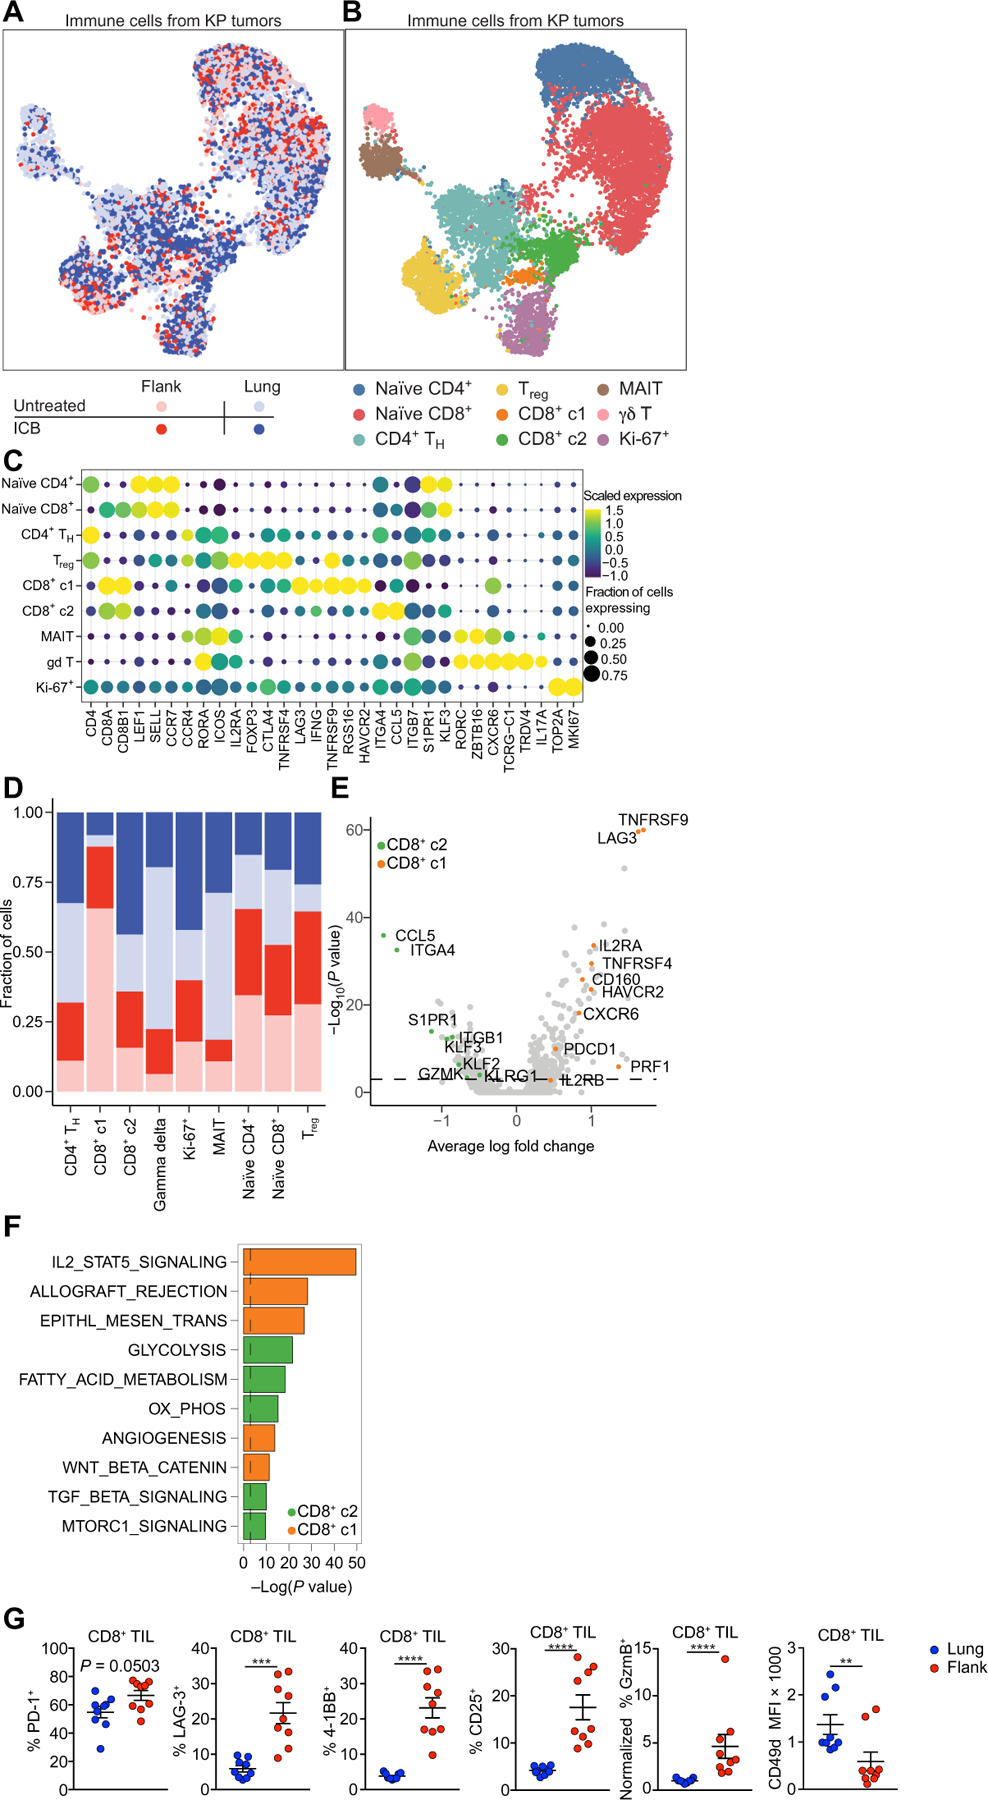
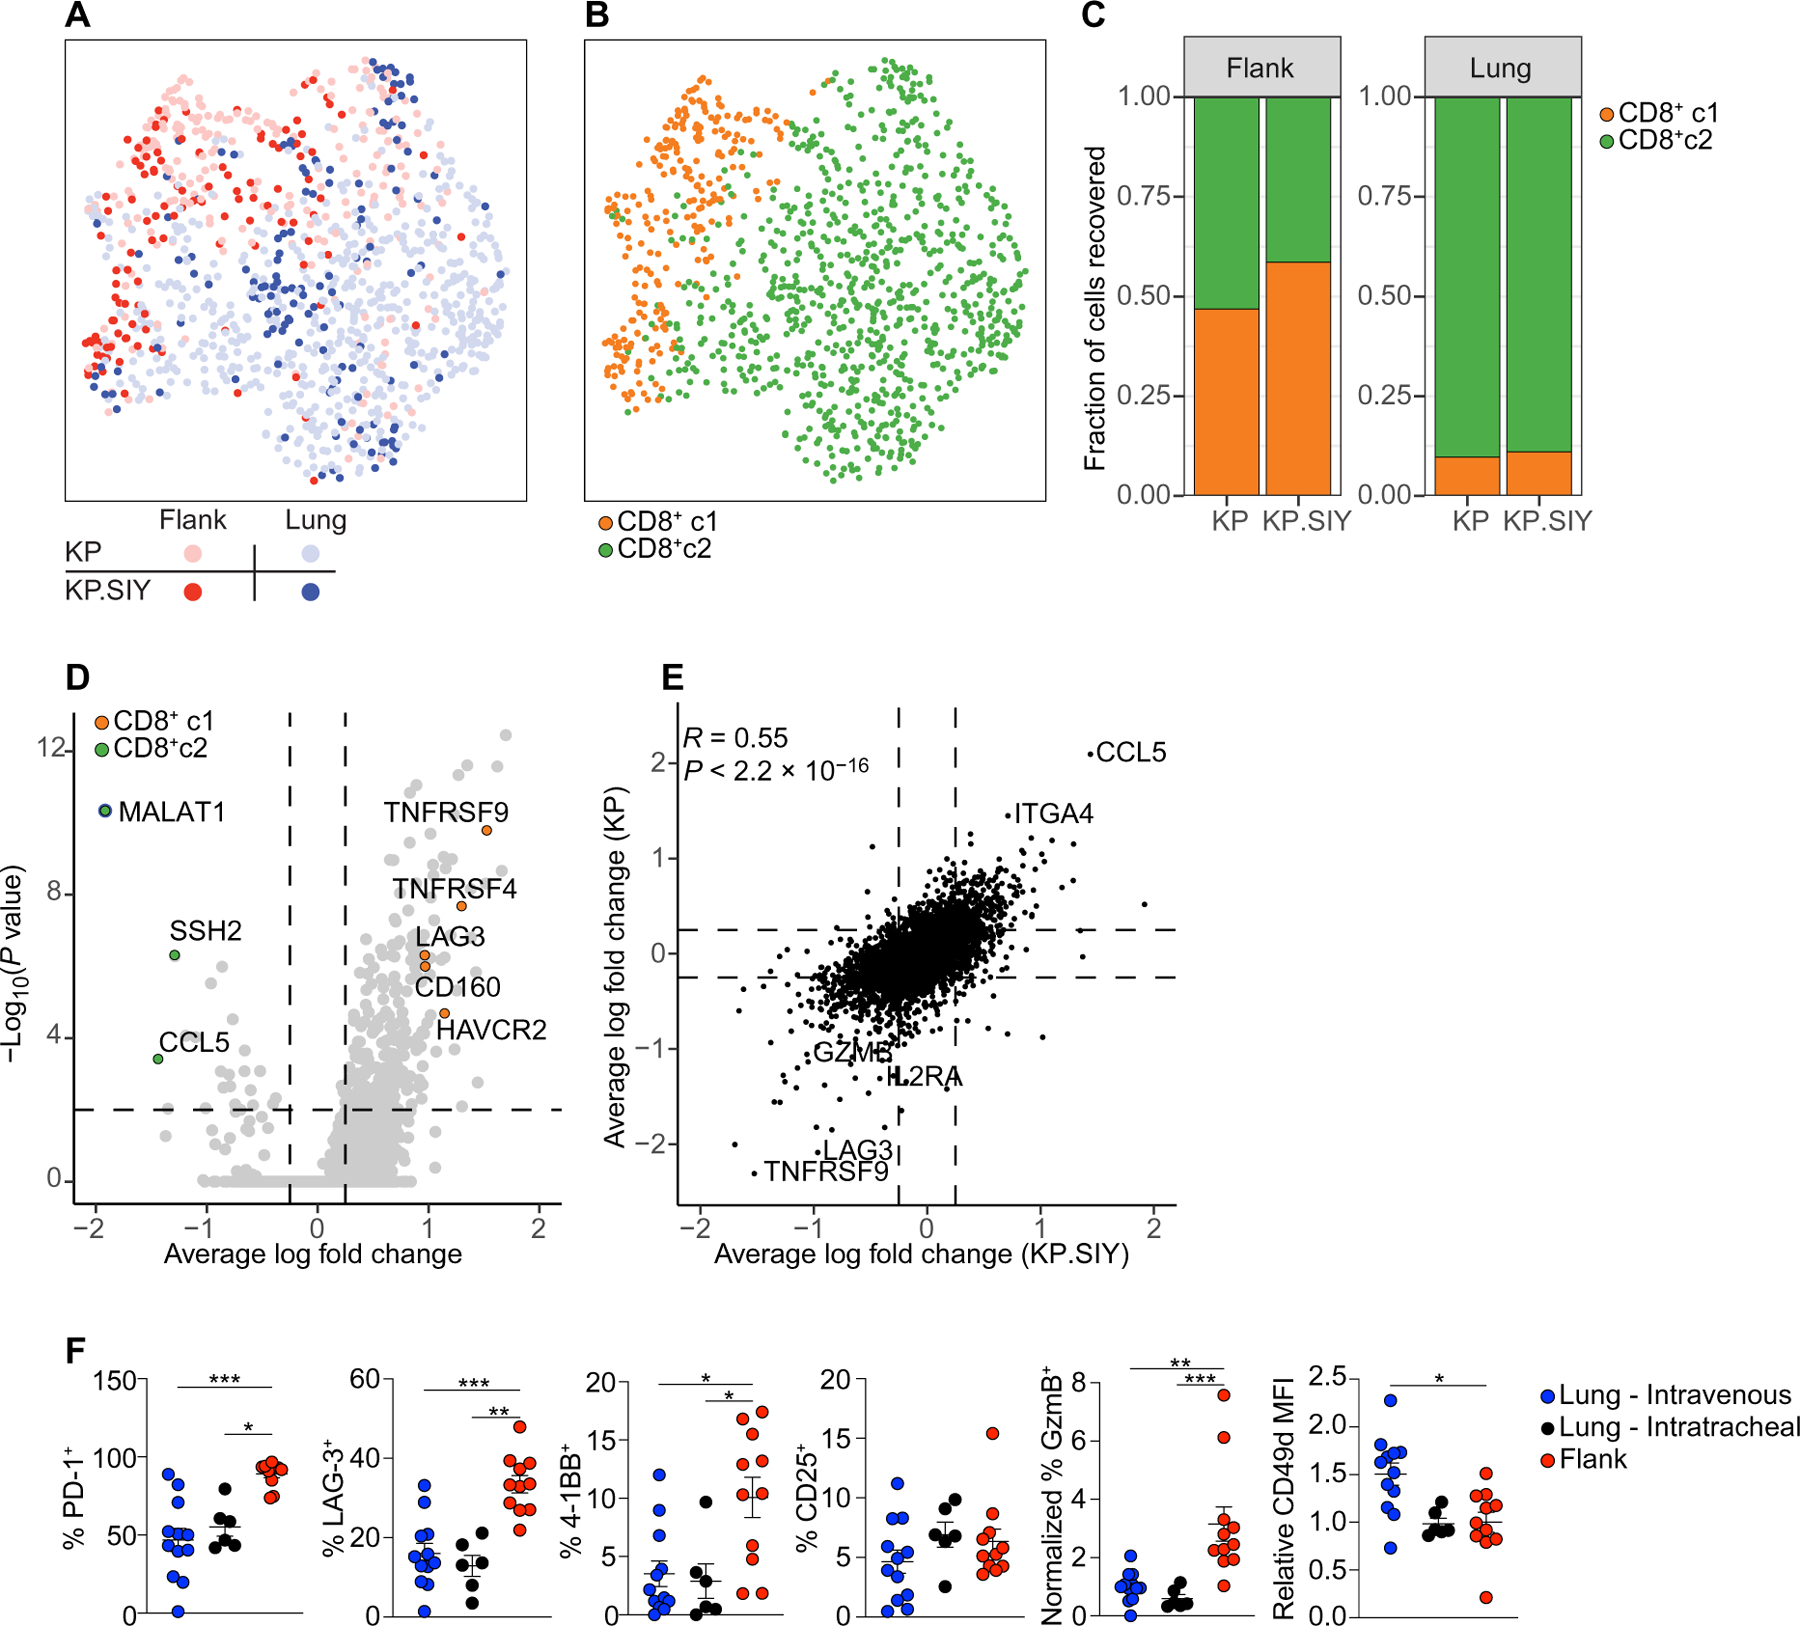
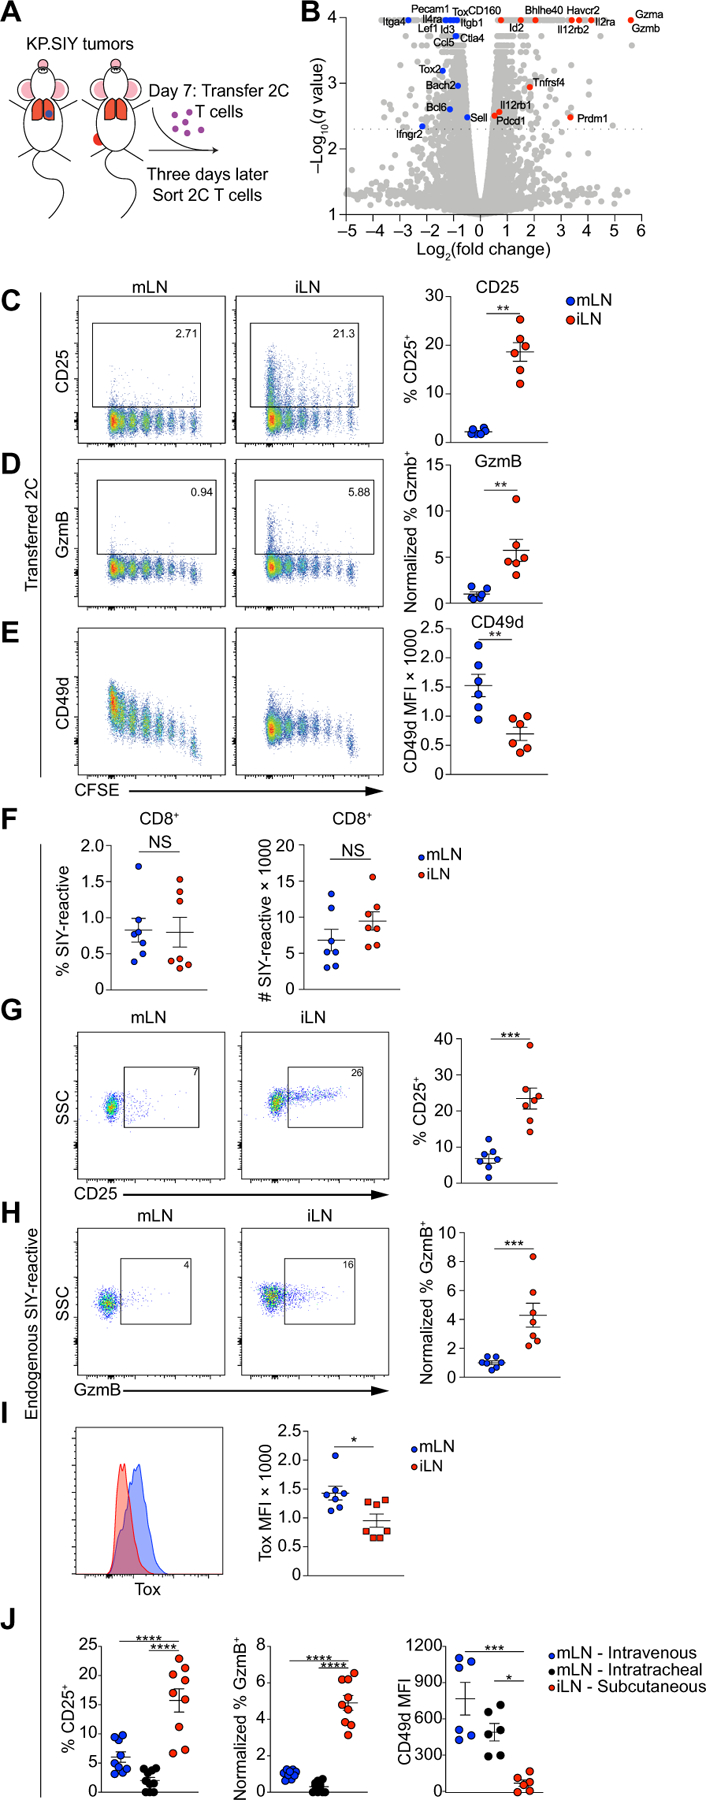
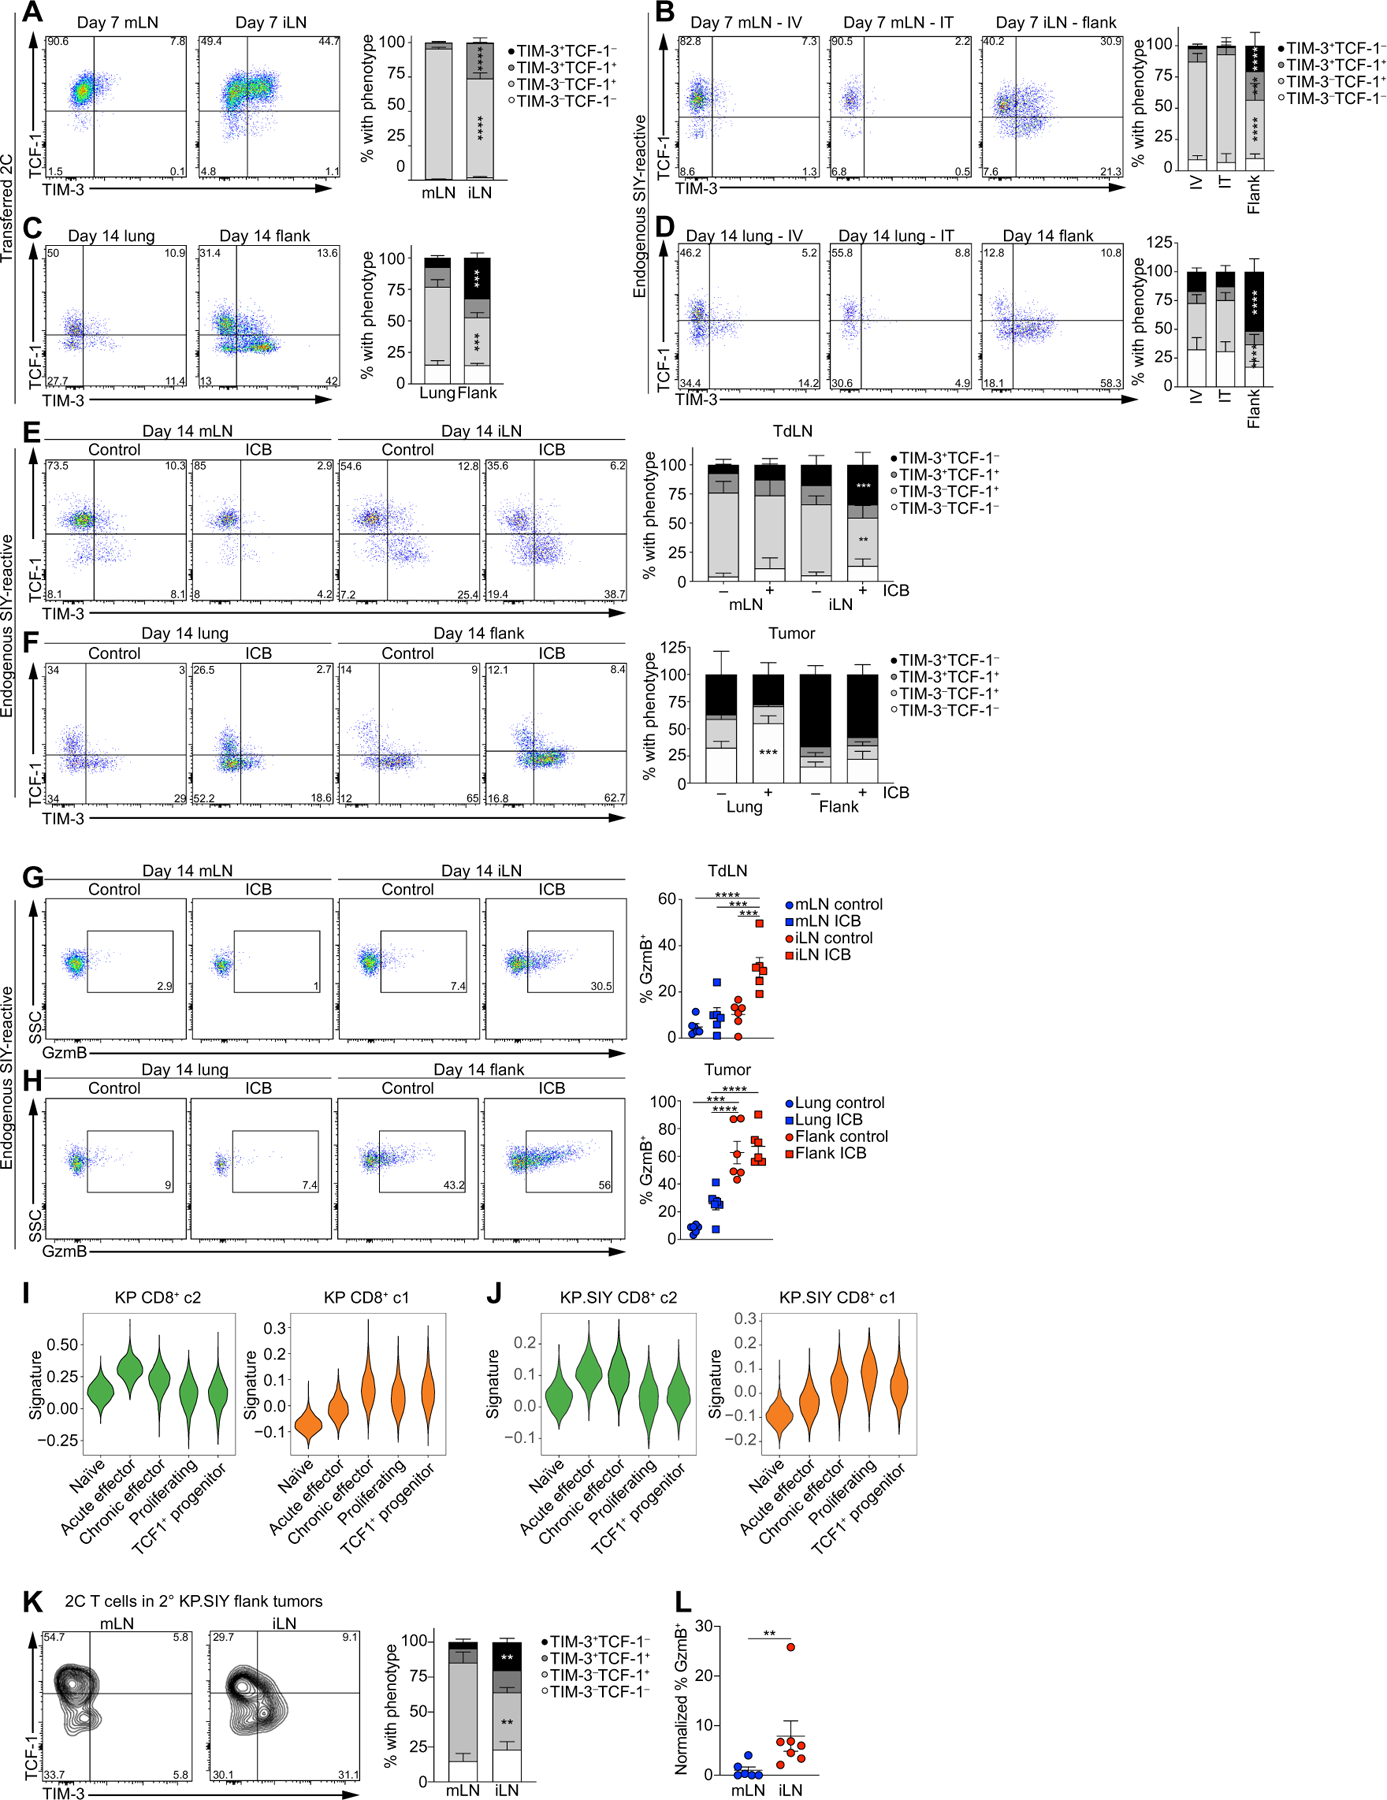
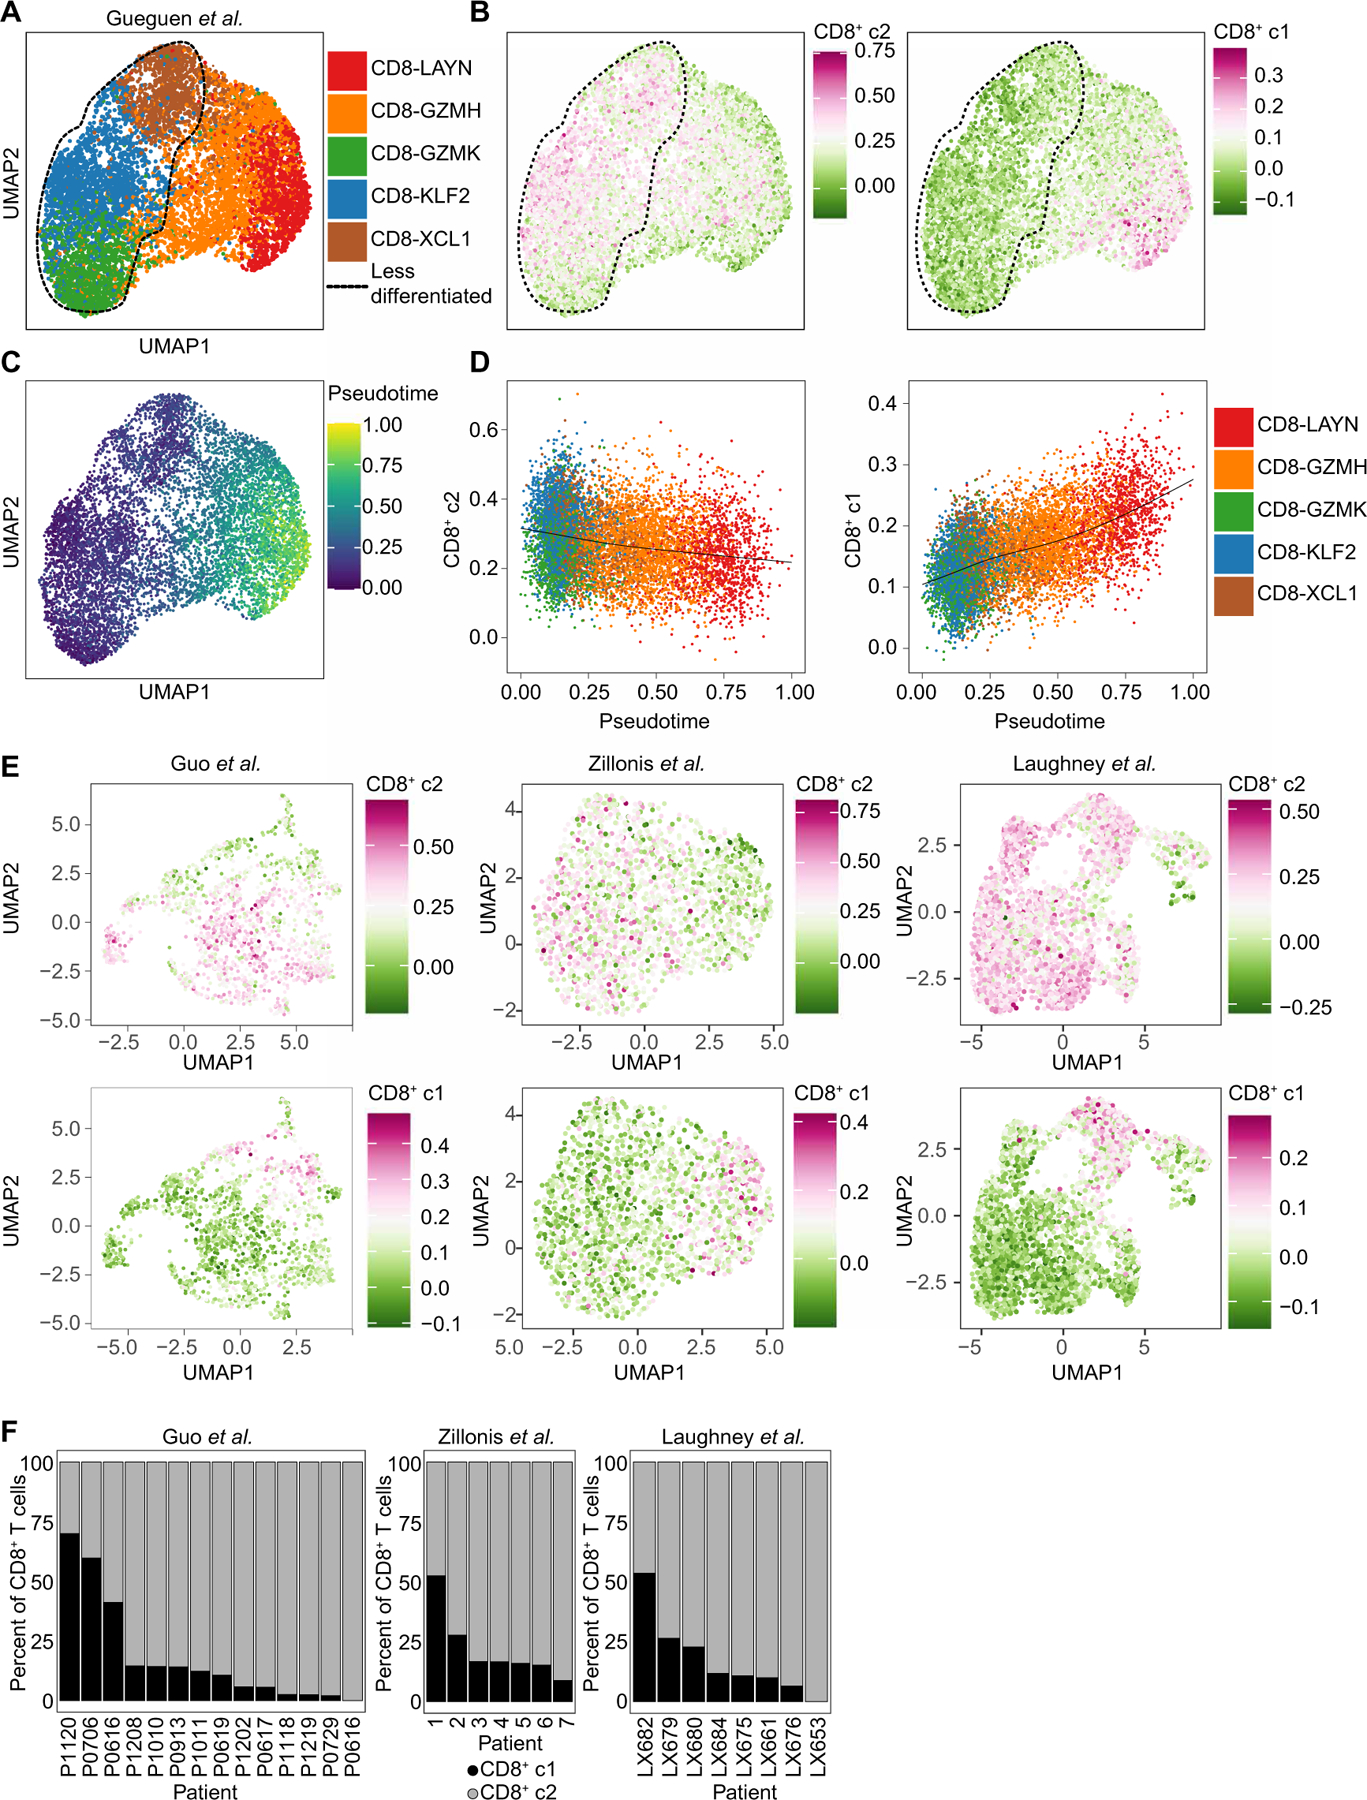
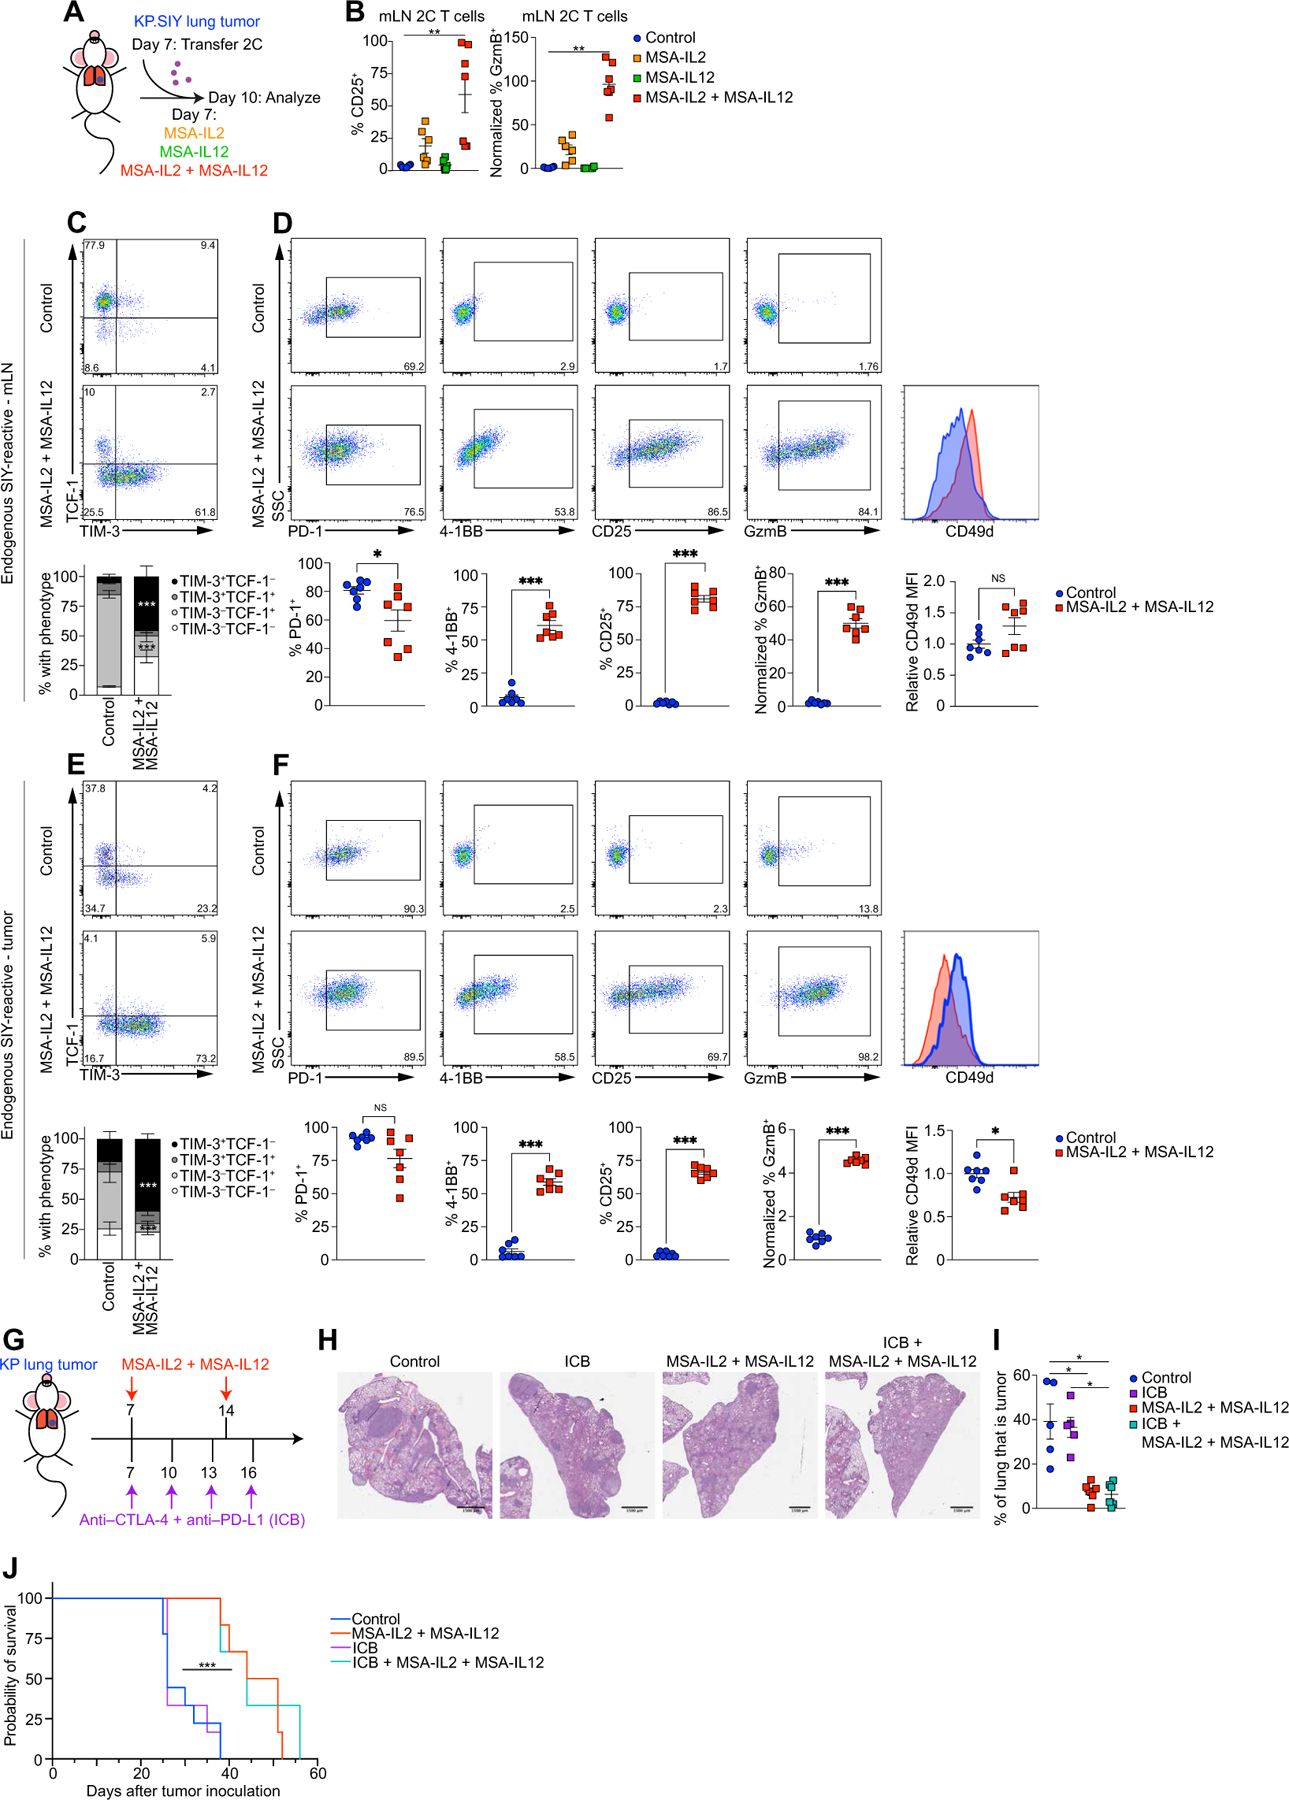
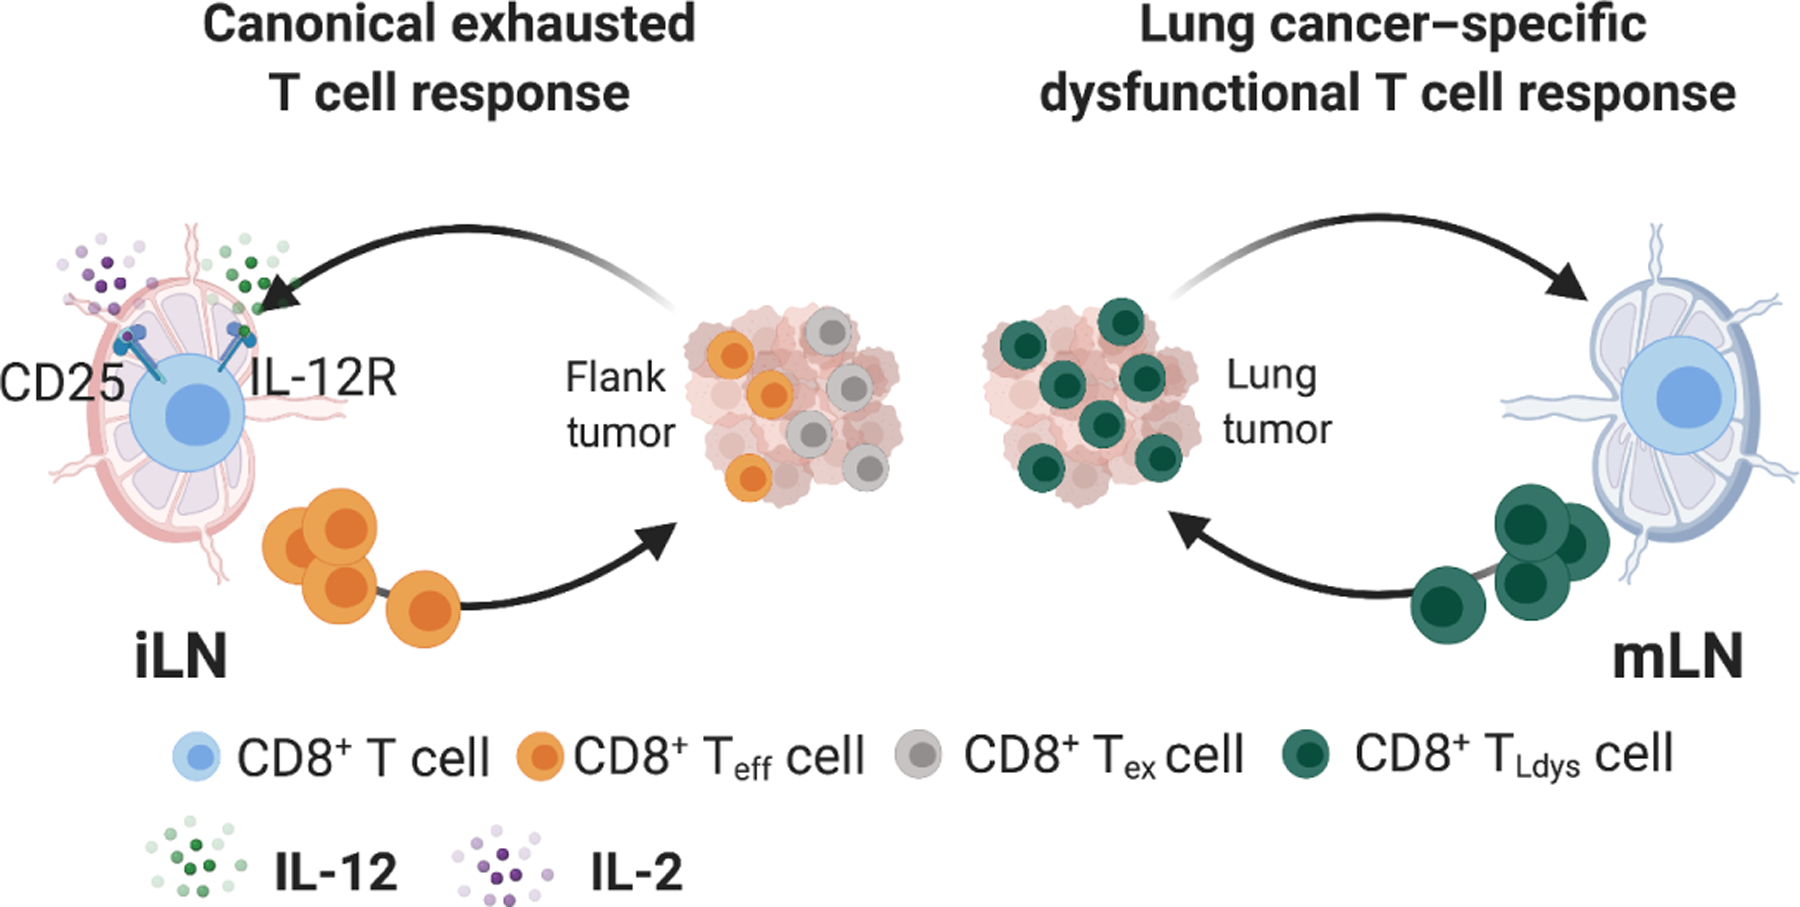
In non–small cell lung cancer (NSCLC), response to immune checkpoint blockade (ICB) is associated with programmed cell death ligand 1 expression that is induced by interferon-γ–producing, tumor-infiltrating CD8+ T cells. However, not all tumors with a CD8+ T cell infiltrate respond to ICB, and little is known about the mechanisms governing ICB resistance in T cell–infiltrated NSCLC. We used an orthotopic NSCLC mouse model to study ICB-refractory CD8+ T cell responses. Single-cell RNA sequencing of the NSCLC mouse tumors revealed that lung cancer–specific tumor-infiltrating CD8+ T cells exhibited clonal expansion but lacked expression of genes associated with effector and exhausted T cell responses, indicating that they underwent a differentiation program distinct from conventional T cell exhaustion. This lung cancer–specific T cell dysfunction program was established early during priming in the mediastinal lymph node and was characterized by robust proliferation but a failed up-regulation of effector and exhausted T cell characteristics. Intriguingly, CD8+ T cells from patients with NSCLC expressed an analogous gene expression program, which appeared distinct from conventional T cell exhaustion. Administration of recombinant interleukin-2 (IL-2) and IL-12 was sufficient to restore effector T cell differentiation and induce control of KP lung tumors. These findings imply that a CD8+ T cell differentiation trajectory, activated during T cell priming in the mediastinal lymph node, limits the response of CD8+ T cells to ICB and thereby may contribute to failure of ICB in a subset T cell–infiltrated NSCLC.


Conflict of interest statement

Competing interests: S.S. is a SAB member for Arcus Biosciences and Venn Therapeutics. S.S. is a consultant for TAKEDA, Merck, Tango Therapeutics, and Ribon Therapeutics and received funding for unrelated projects from Exelicis and TAKEDA. J.C.L. has interests in Sunflower Therapeutics PBC, Pfizer, Honeycomb Biotechnologies, OneCyte Biotechnologies, SQZ Biotechnologies, Alloy Therapeutics, QuantumCyte, Amgen, and Repligen. J.C.L.’s interests are reviewed and managed under MIT’s policies for potential conflicts of interest. J.C.L. receives sponsored research support at MIT from Amgen, the Bill & Melinda Gates Foundation, Biogen, Pfizer, Roche, Takeda, and Sanofi. B.L.H., D.M.M., K.D.W., J.C.L., and S.S. are inventors on patent application 63/158,225 submitted by the MIT that covers lung cancer–specific T cell dysfunction.

Figures

Fig. 1.
Fig. 1.. Orthotopic KP tumors in the lung are resistant to ICB.
(A) Scheme of tumor inoculation and ICB. (B) Representative example and (C) quantification of lung tumor burden on day 21 in control and ICB-treated mice assessed by H&E stain (control n = 9, ICB n = 9, combined data from three experiments). (D) Outgrowth of flank KP tumors treated with ICB or control (control n = 9, ICB n = 9, combined data from three experiments). (E) Comparison between ICB efficacy in lung and flank tumors shown as percent change of tumor size over control treatment (lung n = 9, flank n = 9, combined data from three experiments). Dotted line represents no change from the untreated controls. (F) Representative IF images of lung and flank tumors on day 21 from control mice or mice treated with ICB. For uncropped images, see fig. S1. PI, propidium iodide. Scale bar, 100 mm. (G) Density of CD8+ T cells in control and ICB-treated lung and flank KP tumors on day 21 determined by IF. (H) Fold change of tumor-infiltrating CD8+ T cells between ICB-treated and control mice. Dashed line is at 1, which is no change from the control. Regions analyzed in (G) and (H): flank, n = 12 from three mice; flank + ICB, n = 14 from four mice; lung, n = 58 from three mice; and lung + ICB, n = 73 from four mice. Data are shown as means ± SEM, and statistical analysis was conducted using a two-way ANOVA (D), MWU test (C, E, and H), or one-way ANOVA (G) with **P < 0.01, ***P < 0.001, and ****P < 0.0001.
Fig. 2.
Fig. 2.. Lung tumor–infiltrating CD8+ T cells do not acquire effector or exhausted phenotypes observed in flank TIL.
(A) UMAP plots of scRNA-seq indicating treatment status and tumor location and (B) curated clusters. TH, T helper. MAIT, mucosal associated invariant T cell. (C) Bubble plot of gene expression analysis of curated clusters. (D) Stack charts of contributions to each curated cluster based on treatment condition and tumor location. (E) Volcano plot of DEGs between CD8+ c1 and CD8+ c2 CD8+ T cells. Selected DEGs in CD8+ c2 (green) or CD8+ c1 (orange) TIL are highlighted. (F) Pathway analysis of DEGs showing enriched MSigDb hallmarks pathways for CD8+ c2 (green) and CD8+ c1 (orange) TIL. (G) Validation of differentially expressed key effector/exhaustion markers on lung and flank CD8+ TIL (lung, n = 9 and flank, n = 9, combined data from three experiments). Data are shown as means ± SEM, and statistical analysis was conducted using an MWU test (G) with **P < 0.01, ***P < 0.001, and ****P < 0.0001, or as indicated in Materials and Methods (A to F). MFI, mean fluorescence intensity.
Fig. 3.
Fig. 3.. TLdys T cells in lung tumors and Tex T cells in flank tumor respond to the same antigen.
(A) Combined UMAP plot of scRNA-seq of polyclonal CD8+ T cells (lung and flank KP tumors) and SIY-pentamer+ CD8+ T cells (lung and flank KP.SIY tumors) indicating tumor cell line and location. (B) UMAP plot showing clusters CD8+ c1 and CD8+ c2 of combined datasets from (A). (C) Proportions of cluster CD8+ c1 or CD8+ c2 within flank and lung TIL. (D) Volcano plot of DEGs between CD8+ c1 and CD8+ c2 SIY-reactive CD8+ T cells. Genes of interest are highlighted. (E) The log fold change values of DEGs between CD8+ c1 and CD8+ c2 were compared between SIY-reactive CD8+ T cells from KP.SIY tumors and polyclonal CD8+ T cells from KP tumors. (F) Flow cytometry of SIY-reactive TIL from KP.SIY lung and flank tumors (lung intravenous, n = 12; lung intratracheal, n = 6; and flank n = 11; data pooled from four independent experiments, two with intratracheal tumor administration). Data are shown as means ± SEM, and statistical analysis was conducted using an MWU test (F) with *P < 0.05, **P < 0.01, and ***P < 0.001, or as indicated in Materials and Methods (A to E).
Fig. 4.
Fig. 4.. CD8+ T cells primed in the mLN fail to acquire an effector phenotype.
(A) Schematic of experimental setup. Mice were inoculated with KP.SIY lung or flank tumors, and on day 7 of tumor growth, 1 × 10⁶ naïve, congenically marked 2C T cells were transferred to tumor-bearing mice. On day 10 of tumor growth, the 2C T cells were isolated from the mLN of lung tumor–bearing mice and iLN of flank tumor–bearing mice using FACS. (B) Volcano plot of DEGs between 2C T cells primed in the mLN and iLN of tumor-bearing mice. mLN, n = 3 and iLN, n = 4 biological replicates. Genes of interest are highlighted. (C to E) Representative example and quantification (means ± SEM) of CD25 (C), GzmB (D), and CD49d (E) expression levels on CFSE-labeled 2C T cells primed in the mLN and iLN of tumor-bearing mice at 72 hours after adoptive transfer, day 10 of tumor growth (mLN, n = 6 and iLN, n = 6; data pooled from two experiments). CFSE dilution is shown on the x axis. (F to I) Representative example and quantification (means ± SEM) of the percent and absolute number of SIY+-reactive T cells (F) as well as CD25 (G), GzmB (H), and Tox (I) expression levels on endogenous SIY-reactive T cells in the mLN and iLN of tumor-bearing mice 7 days after tumor inoculation. NS, not significant; SSC, side scatter. (J) Mice were inoculated with KP.SIY cells either intravenously, intratracheally, or subcutaneously. On day 7 of tumor growth, mLNs and iLNs were isolated, and endogenous SIY-reactive CD8+ T cells were analyzed with flow cytometry for the expression of CD25, GzmB, and CD49d (n = 9 for CD25 and GzmB and n = 6 for CD49d comparisons, data pooled from three experiments). Data are shown as means ± SEM, and statistical analysis was conducted using an MWU test (C to J) with *P < 0.05, **P < 0.01, ***P < 0.001, and ****P < 0.0001 or as indicated in Materials and Methods (B).
Fig. 5.
Fig. 5.. TLdys T cell state is functionally distinct from conventional Tex T cell state.
(A to D) Flow cytometry analysis of TCF-1 and TIM-3 expression on adoptively transferred 2C T cells in the mLN and iLN of KP.SIY tumor–bearing mice 72 hours after adoptive transfer (10 days after tumor inoculation; n = 14 for mLN and n = 10 for iLN, data pooled from two experiments). (B) Endogenous, SIY-reactive CD8+ T cells in KP.SIY tumor–bearing mice 7 days after intravenous, intratracheal, or subcutaneous inoculation (n = 9 for IV mLN, n = 10 for IT mLN, and n = 9 for iLN, data pooled from three experiments). (C) Adoptively transferred 2C T cells in lung or flank KP.SIY tumors 14 days after tumor inoculation and 7 days after adoptive transfer (n = 6 for lung and n = 5 for flank, data pooled from two experiments). (D) Endogenous, SIY-reactive CD8+ TIL in KP.SIY tumor–bearing mice 14 days after tumor inoculation (n = 6 for all conditions, data pooled from two experiments). (E to H) Analysis of SIY-reactive CD8+ T cells in KP.SIY tumor untreated or treated with ICB given on days 7 and 10 after tumor inoculation. TCF-1 and TIM-3 expression in mLN and iLN (E) and lung and flank tumors (F) 14 days after tumor inoculation (n = 6, data pooled from two experiments). GzmB expression on SIY-reactive CD8+ T cells in (G) mLN and iLN and lung and flank tumors (H) 14 days after tumor inoculation (n = 6, data pooled from two experiments). (I and J) Comparison of CD8+ c2 (green) or CD8+ c1 (orange) signatures from KP parental (I) and KP. SIY (J) datasets with previously published CD8+ T cell signatures from acute and chronic LCMV infection. (K and L) Flow cytometric analysis of TCF1–1, TIM-3 (K), and GzmB (L) expression in serially transferred 2C T cells on day 5 after transfer to RAG2−/− (n = 6 for mLN and n = 7 for iLN, data pooled from two experiments) Data are shown as means ± SEM, and statistical analysis was conducted using an MWU test with **P < 0.01, ***P < 0.001, and ****P < 0.0001 (A to H and K to L).
Fig. 6.
Fig. 6.. TLdys T cell state is detectable in human NSCLC TIL populations.
(A) UMAP plot of CD8+ T cell clusters from Gueguen et al. (53). (B) CD8+ c2 or CD8+ c1 signatures mapped onto the CD8+ T cell clusters from Gueguen et al. in (A). (C) Pseudotemporal analysis of CD8+ T cell clusters from Gueguen et al. in (A). (D) Pseudo-temporal analysis of CD8+ c2 or CD8+ c1 signatures and CD8+ T cell clusters from Gueguen et al. in (A). (E) UMAP feature plots from three human datasets analyzed for expression of CD8+ c2 (top) and CD8+ c1 (bottom) signatures. (F) Proportions of CD8+ T cells from individual patients that have CD8+ c1 (black) or CD8+ c2 (gray) signatures.
Fig. 7.
Fig. 7.. TLdys can be overcome by combined IL-2 and IL-12 therapy.
(A) Schematic of experimental design. Mice were inoculated with KP.SIY lung tumors. On day 7 of tumor growth, 2C T cells were adoptively transferred to tumor-bearing mice. Immediately after adoptive transfer, mice were given either IL-2 or IL-12 fusions to MSA or the combination. Seventy-two hours after adoptive 2C T cell transfer, the mLNs were analyzed with flow cytometry. (B) Percentage of CD25 (left) and Gzmb (right) on 2C T cells in mLNs for control or cytokine treatments (control, IL-2, and IL-12, n = 6 and IL-2 + IL-12, n = 7, data pooled from two experiments). (C and D) Endogenous SIY-reactive CD8+ T cells in the mLNs were analyzed for (C) TCF-1 and TIM-3 expression or (D) for PD-1, 4–1BB, CD25, GzmB, and CD49d expression. (E and F) Analysis of endogenous SIY-reactive CD8+ TIL from the same mice as (C) and (D). (E) TCF-1 and TIM-3 expression. (F) PD-1, 4–1BB, CD25, GzmB, and CD49D expression. [(C to F) n = 7 each condition, data pooled from two experiments] (G) Schematic of experiment combining ICB with MSA-IL2 + MSA-IL12 therapy. Mice were inoculated with KP.SIY lung tumors. Mice received either control treatments, ICB on days 7, 10, 13, and 16, MSA-IL2 + MSA-IL12 on days 7 and 10, or the combination of ICB and MSA-IL2 and MSA-12. (H and I) Lung tumor burden assessed on day 21 with (H) showing a representative H&E example and (I) showing the quantification of tumor area per lung lobe (control and ICB, n = 5 and MSA-IL2 + MSA-IL12 and ICB + MSA-IL2 + MSA-IL12, n = 6, data pooled from two experiments). (J) Mice were inoculated with lung KP tumors, treated as in (G), and monitored for survival (control, n = 9; ICB, n = 6; MSA-IL2 + MSA-IL12, n = 6; and ICB + MSA-IL2 + MSA-IL12, n = 3; data pooled from three experiments). Data are shown as means ± SEM, and statistical analysis was conducted using an MWU test with *P < 0.05, **P < 0.01, and ***P < 0.001 (B to I), or with a Kaplan-Meier analysis (J).
Fig. 8.
Fig. 8.. Schematic summary.
(Left) In response to flank tumors, tumor-reactive CD8+ T cells primed in the iLN up-regulate CD25 and IL-12R, express effector molecules, show signs of conventional exhaustion, and respond to CBT. (Right) In response to lung tumors, however, tumor-reactive CD8+ T cells primed in the mLN activate a lung-specific dysfunctional program (TLdys), do not up-regulate CD25 and IL-12R, fail to gain effector molecule expression, and do not acquire a conventional Tex phenotype. CD8+ TLdys cells do not respond to CBT. This suggests that differentiation of CD8+ T cells into dysfunctional states other than conventional Tex drives CBT resistance in a subset of T cell–infiltrated NSCLCs. Teff, effector T cell. Created with Biorender.com.

References

    1. Topalian SL, Hodi FS, Brahmer JR, Gettinger SN, Smith DC, McDermott DF, Powderly JD, Carvajal RD, Sosman JA, Atkins MB, Leming PD, Spigel DR, Antonia SJ, Horn L, Drake CG, Pardoll DM, Chen L, Sharfman WH, Anders RA, Taube JM, McMiller TL, Xu H, Korman AJ, Jure-Kunkel M, Agrawal S, McDonald D, Kollia GD, Gupta A, Wigginton JM, Sznol M, Safety, activity, and immune correlates of anti–PD-1 antibody in cancer. N. Engl. J. Med 366, 2443–2454 (2012). - PMC - PubMed
    1. Rafei H, El-Bahesh E, Finianos A, Nassereddine S, Tabbara I, Immune-based therapies for non-small cell lung cancer. Anticancer Res 37, 377–387 (2017). - PubMed
    1. Herbst RS, Soria JC, Kowanetz M, Fine GD, Hamid O, Gordon MS, Sosman JA, McDermott DF, Powderly JD, Gettinger SN, Kohrt HE, Horn L, Lawrence DP, Rost S, Leabman M, Xiao Y, Mokatrin A, Koeppen H, Hegde PS, Mellman I, Chen DS, Hodi FS, Predictive correlates of response to the anti–PD-L1 antibody MPDL3280A in cancer patients. Nature 515, 563–567 (2014). - PMC - PubMed
    1. Fehrenbacher L, Spira A, Ballinger M, Kowanetz M, Vansteenkiste J, Mazieres J, Park K, Smith D, Artal-Cortes A, Lewanski C, Braiteh F, Waterkamp D, He P, Zou W, Chen DS, Yi J, Sandler A, Rittmeyer A; POPLAR Study Group, Atezolizumab versus docetaxel for patients with previously treated non-small-cell lung cancer (POPLAR): A multicentre, open-label, phase 2 randomised controlled trial. Lancet 387, 1837–1846 (2016). - PubMed
    1. Larkin J, Chiarion-Sileni V, Gonzalez R, Grob JJ, Rutkowski P, Lao CD, Cowey CL, Schadendorf D, Wagstaff J, Dummer R, Ferrucci PF, Smylie M, Hogg D, Hill A, Marquez-Rodas I, Haanen J, Guidoboni M, Maio M, Schoffski P, Carlino MS, Lebbe C,McArthur G, Ascierto PA, Daniels GA, Long GV, Bastholt L, Rizzo JI, Balogh A, Moshyk A, Hodi FS, Wolchok JD, Five-year survival with combined nivolumab and ipilimumab in advanced melanoma. N. Engl. J. Med 381, 1535–1546 (2019). - PubMed

Publication types

Substances