

Screening of key biomarkers of tendinopathy based on bioinformatics and machine learning algorithms
- PMID: 34714891
- PMCID: PMC8555777
- DOI: 10.1371/journal.pone.0259475
Screening of key biomarkers of tendinopathy based on bioinformatics and machine learning algorithms
Abstract
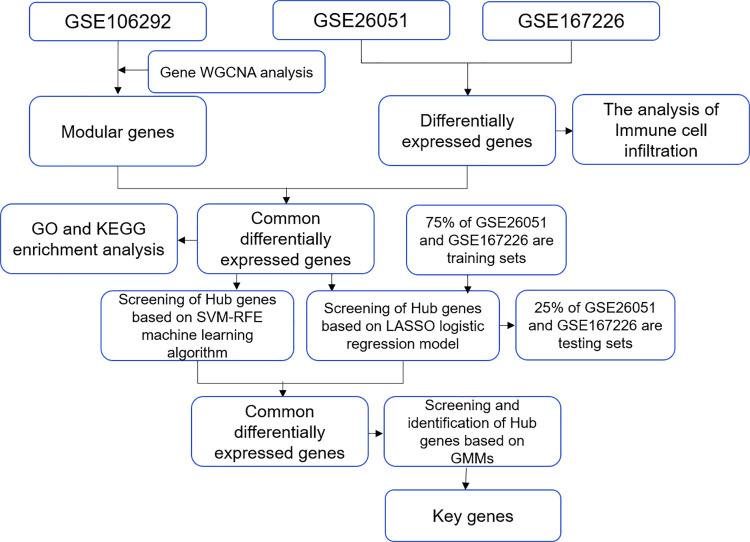
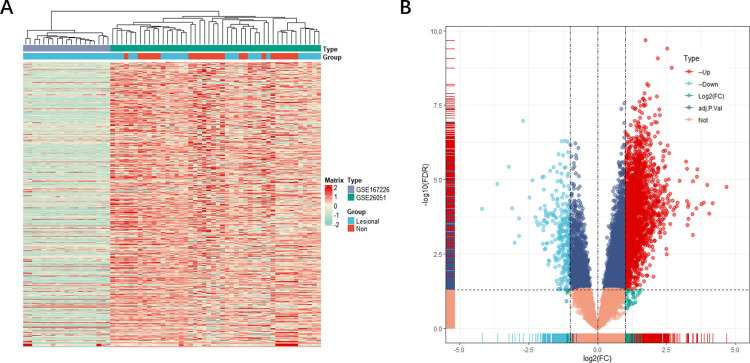
Tendinopathy is a complex multifaceted tendinopathy often associated with overuse and with its high prevalence resulting in significant health care costs. At present, the pathogenesis and effective treatment of tendinopathy are still not sufficiently elucidated. The purpose of this research is to intensely explore the genes, functional pathways, and immune infiltration characteristics of the occurrence and development of tendinopathy. The gene expression profile of GSE106292, GSE26051 and GSE167226 are downloaded from GEO (NCBI comprehensive gene expression database) and analyzed by WGCNA software bag using R software, GSE26051, GSE167226 data set is combined to screen the differential gene analysis. We subsequently performed gene enrichment analysis of Gene Ontology (GO) and "Kyoto Encyclopedia of Genes and Genomes" (KEGG), and immune cell infiltration analysis. By constructing the LASSO regression model, Support vector machine (SVM-REF) and Gaussian mixture model (GMMs) algorithms are used to screen, to identify early diagnostic genes. We have obtained a total of 171 DEGs through WGCNA analysis and differentially expressed genes (DEGs) screening. By GO and KEGG enrichment analysis, it is found that these dysregulated genes were related to mTOR, HIF-1, MAPK, NF-κB and VEGF signaling pathways. Immune infiltration analysis showed that M1 macrophages, activated mast cells and activated NK cells had infiltration significance. After analysis of THE LASSO SVM-REF and GMMs algorithms, we found that the gene MACROD1 may be a gene for early diagnosis. We identified the potential of tendon disease early diagnosis way and immune gene regulation MACROD1 key infiltration characteristics based on comprehensive bioinformatics analysis. These hub genes and functional pathways may as early biomarkers of tendon injuries and molecular therapy level target is used to guide drug and basic research.
Conflict of interest statement
The authors have declared that no competing interests exist.
Figures


Similar articles
-
Six potential biomarkers in septic shock: a deep bioinformatics and prospective observational study.Front Immunol. 2023 Jun 8;14:1184700. doi: 10.3389/fimmu.2023.1184700. eCollection 2023. Front Immunol. 2023. PMID: 37359526 Free PMC article.
-
Screening of key immune-related gene in Parkinson's disease based on WGCNA and machine learning.Zhong Nan Da Xue Xue Bao Yi Xue Ban. 2024 Feb 28;49(2):207-219. doi: 10.11817/j.issn.1672-7347.2024.230307. Zhong Nan Da Xue Xue Bao Yi Xue Ban. 2024. PMID: 38755717 Free PMC article. Chinese, English.
-
Identification of DTL as Related Biomarker and Immune Infiltration Characteristics of Nasopharyngeal Carcinoma via Comprehensive Strategies.Int J Gen Med. 2022 Mar 2;15:2329-2345. doi: 10.2147/IJGM.S352330. eCollection 2022. Int J Gen Med. 2022. PMID: 35264872 Free PMC article.
-
Identification of TYR, TYRP1, DCT and LARP7 as related biomarkers and immune infiltration characteristics of vitiligo via comprehensive strategies.Bioengineered. 2021 Dec;12(1):2214-2227. doi: 10.1080/21655979.2021.1933743. Bioengineered. 2021. PMID: 34107850 Free PMC article.
-
Identification and Verification of the Oxidative Stress-Related Signature Markers for Intracranial Aneurysm-Applied Bioinformatics.Front Biosci (Landmark Ed). 2024 Aug 20;29(8):294. doi: 10.31083/j.fbl2908294. Front Biosci (Landmark Ed). 2024. PMID: 39206894
Cited by
-
Mast Cell Involvement in the Pathogenesis of Selected Musculoskeletal Diseases.Life (Basel). 2023 Aug 5;13(8):1690. doi: 10.3390/life13081690. Life (Basel). 2023. PMID: 37629547 Free PMC article. Review.
-
AMP-activated protein kinase (AMPK) is essential for tendon homeostasis and prevents premature senescence and ectopic calcification.bioRxiv [Preprint]. 2025 Apr 9:2025.01.31.635920. doi: 10.1101/2025.01.31.635920. bioRxiv. 2025. PMID: 39975248 Free PMC article. Preprint.
-
Characteristic genes and immune infiltration analysis of gastric cancer based on bioinformatics analysis and machine learning.Discov Oncol. 2025 May 23;16(1):872. doi: 10.1007/s12672-025-02624-x. Discov Oncol. 2025. PMID: 40407862 Free PMC article.
-
Screening of Potential Biomarkers in the Peripheral Serum for Steroid-Induced Osteonecrosis of the Femoral Head Based on WGCNA and Machine Learning Algorithms.Dis Markers. 2022 Feb 10;2022:2639470. doi: 10.1155/2022/2639470. eCollection 2022. Dis Markers. 2022. PMID: 35154510 Free PMC article.
-
Identification of Key Genes and Potential Therapeutic Targets in Sepsis-Associated Acute Kidney Injury Using Transformer and Machine Learning Approaches.Bioengineering (Basel). 2025 May 16;12(5):536. doi: 10.3390/bioengineering12050536. Bioengineering (Basel). 2025. PMID: 40428155 Free PMC article.
References
Publication types
MeSH terms
Substances
LinkOut - more resources
Full Text Sources
Medical
Miscellaneous
