. 2021 Nov 9;54(11):2632-2649.e6.
doi: 10.1016/j.immuni.2021.10.004. Epub 2021 Oct 12.

APOL1 risk variants in individuals of African genetic ancestry drive endothelial cell defects that exacerbate sepsis

Affiliations

APOL1 risk variants in individuals of African genetic ancestry drive endothelial cell defects that exacerbate sepsis

Junnan Wu et al. Immunity. .

Abstract

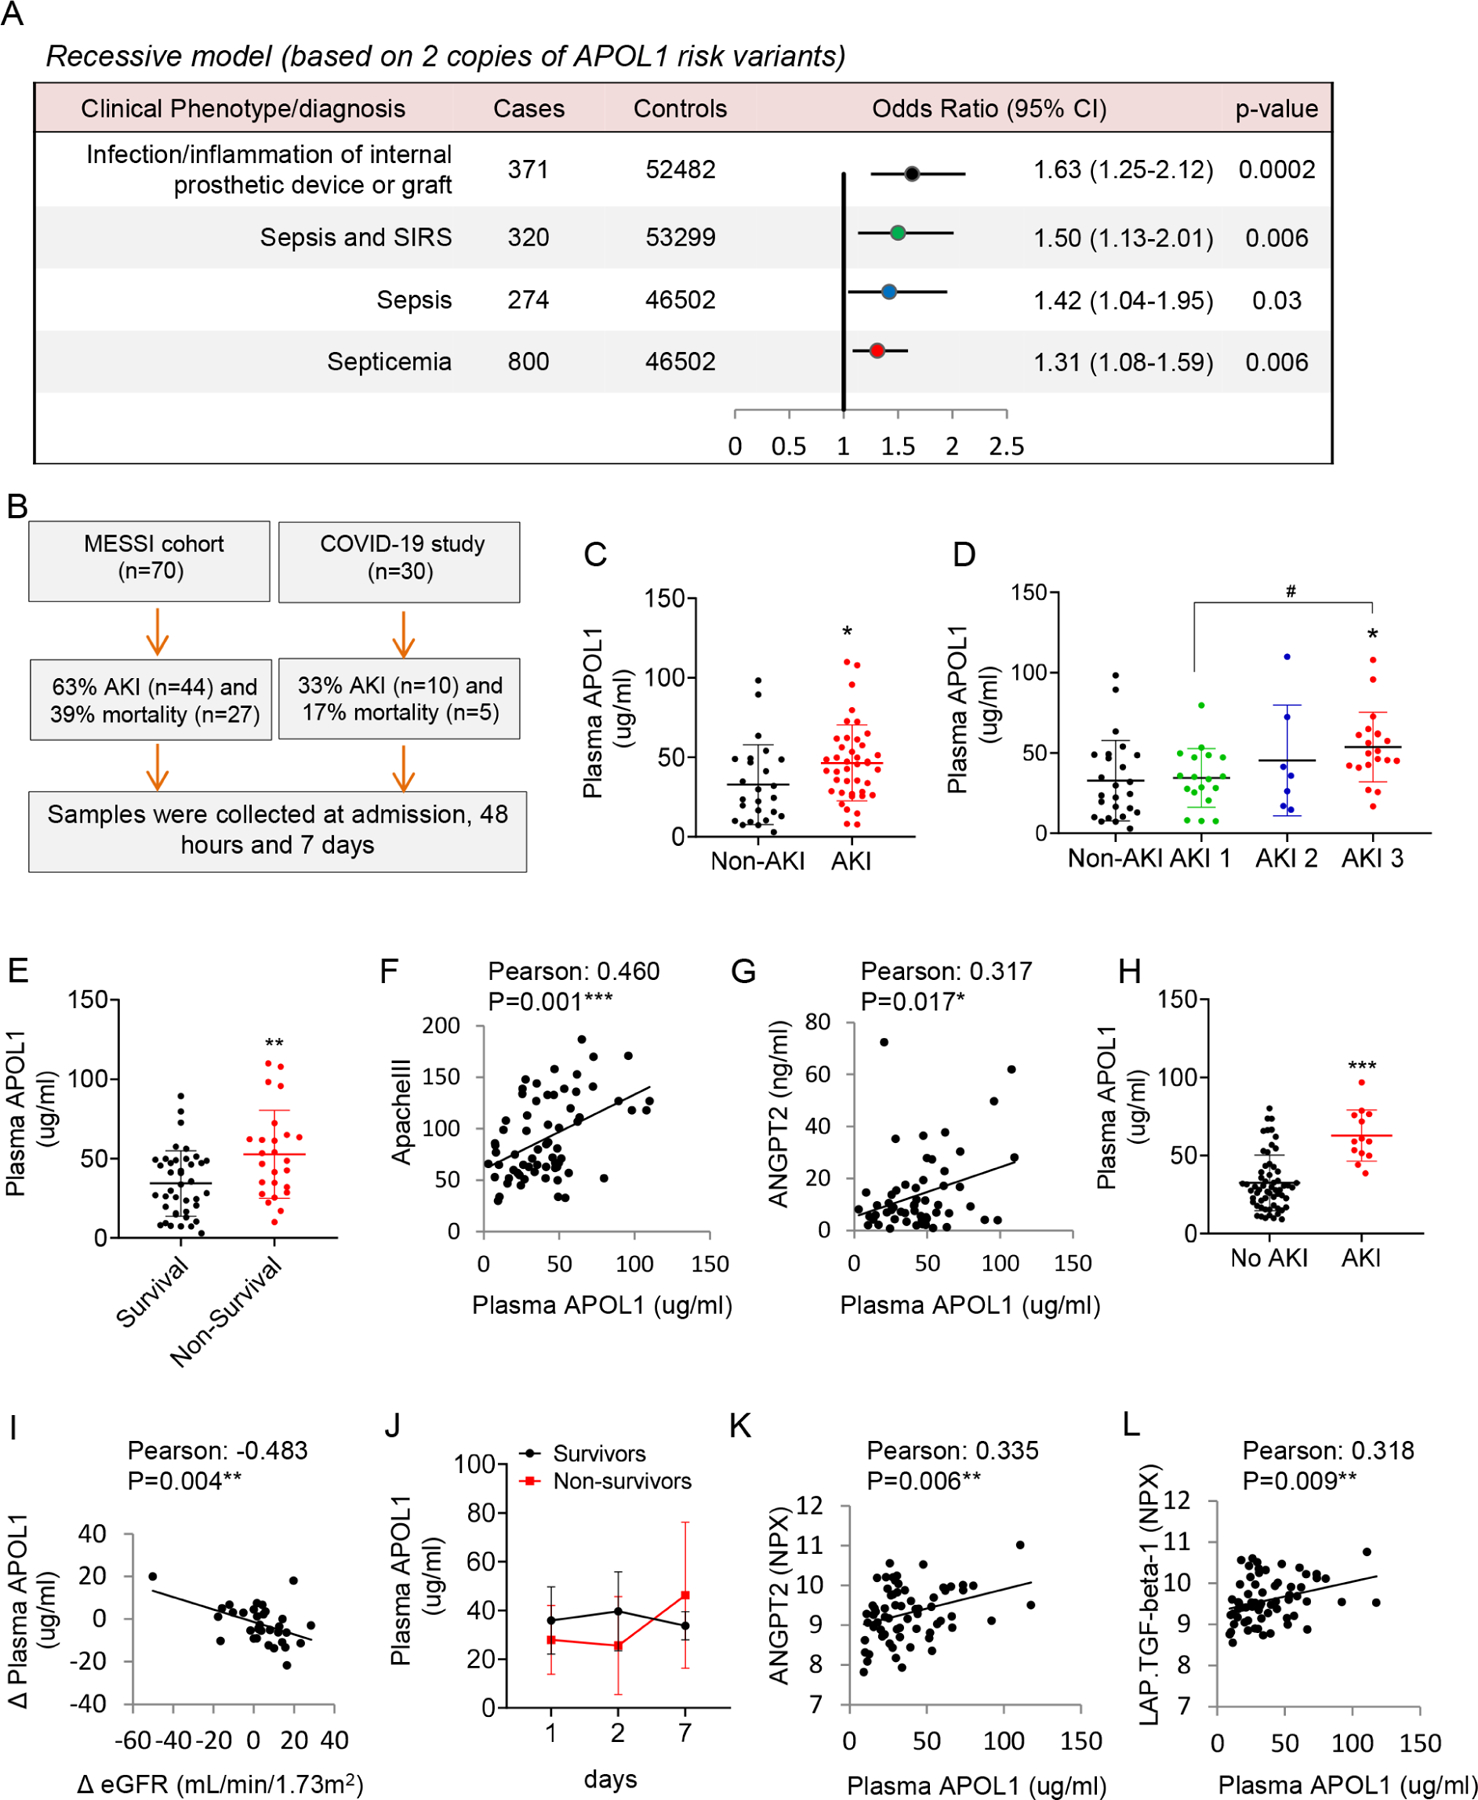
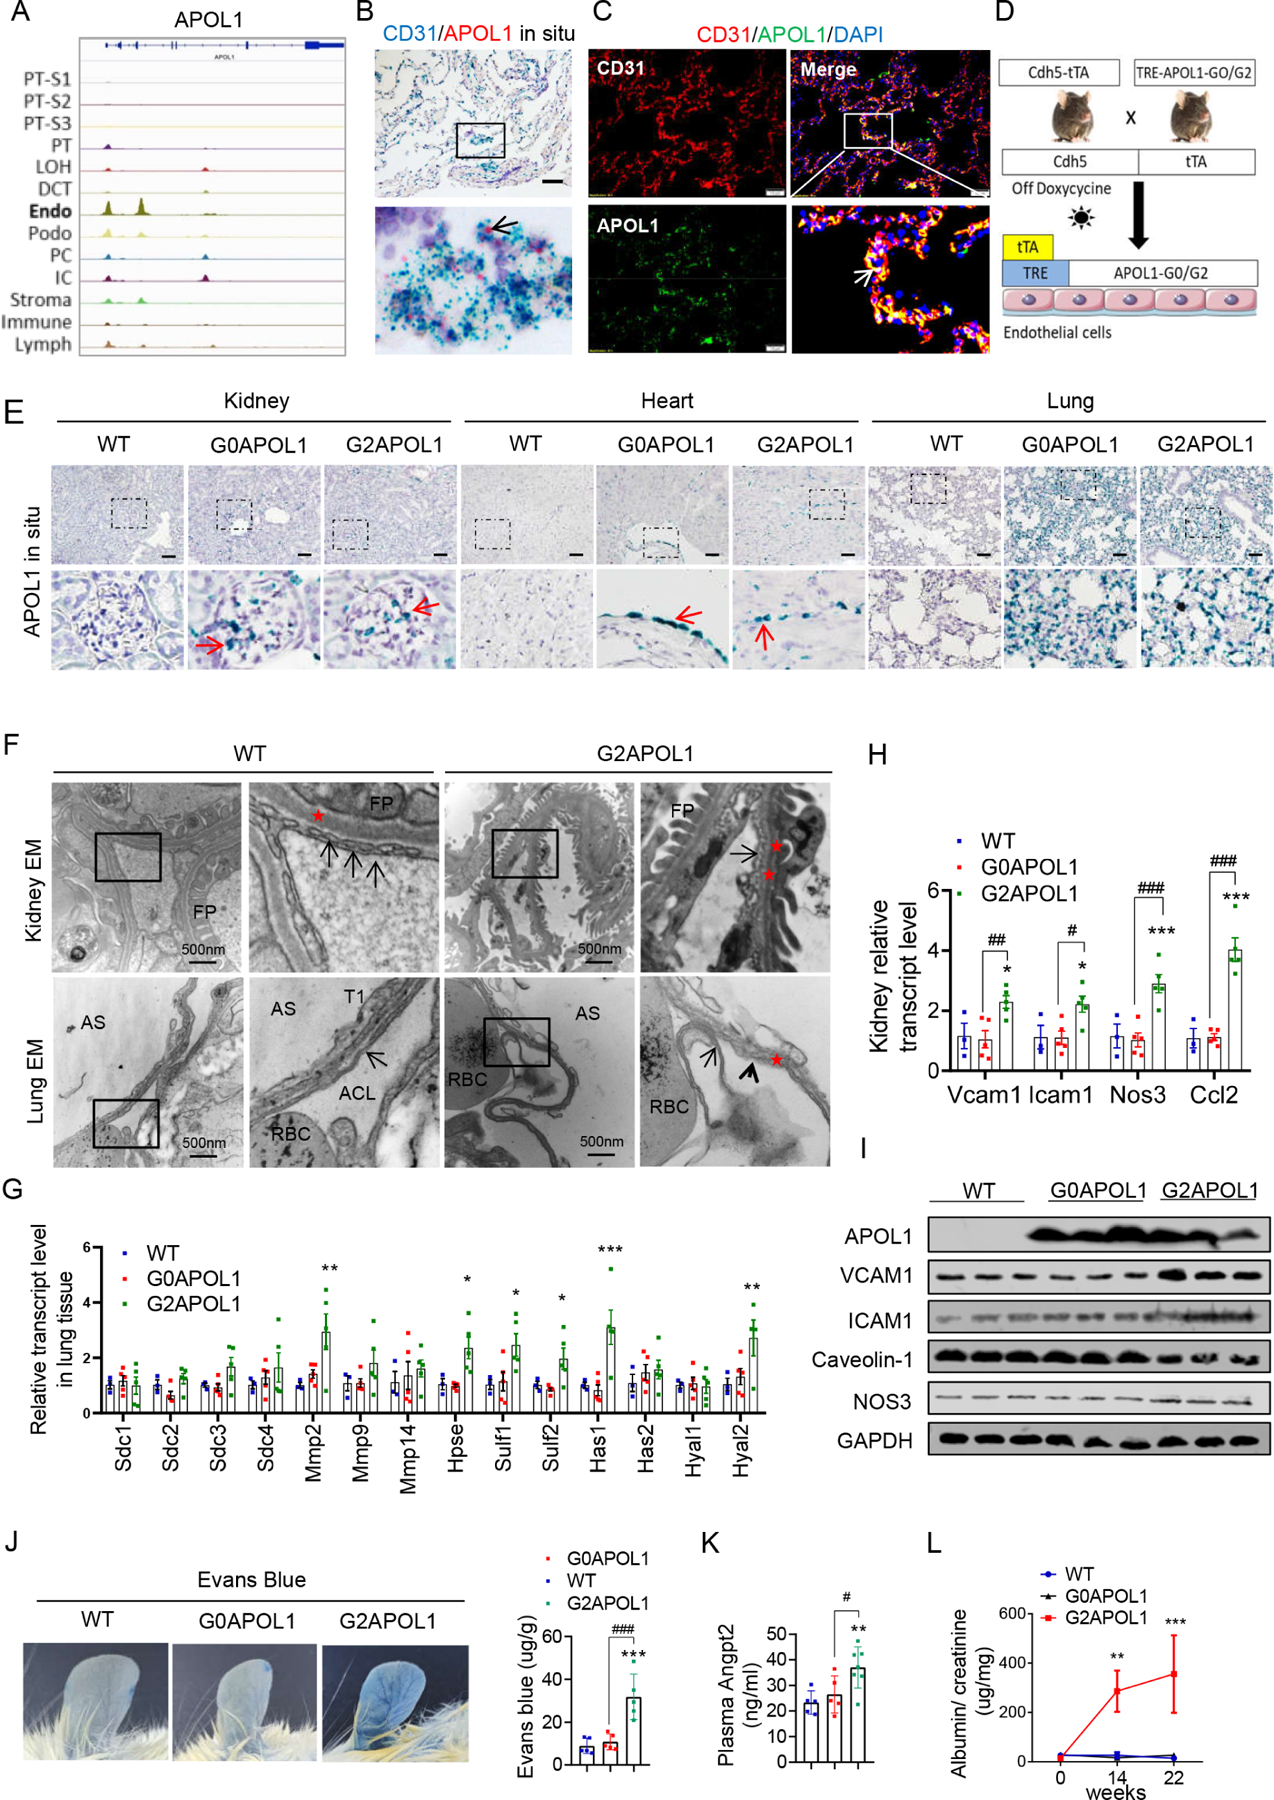
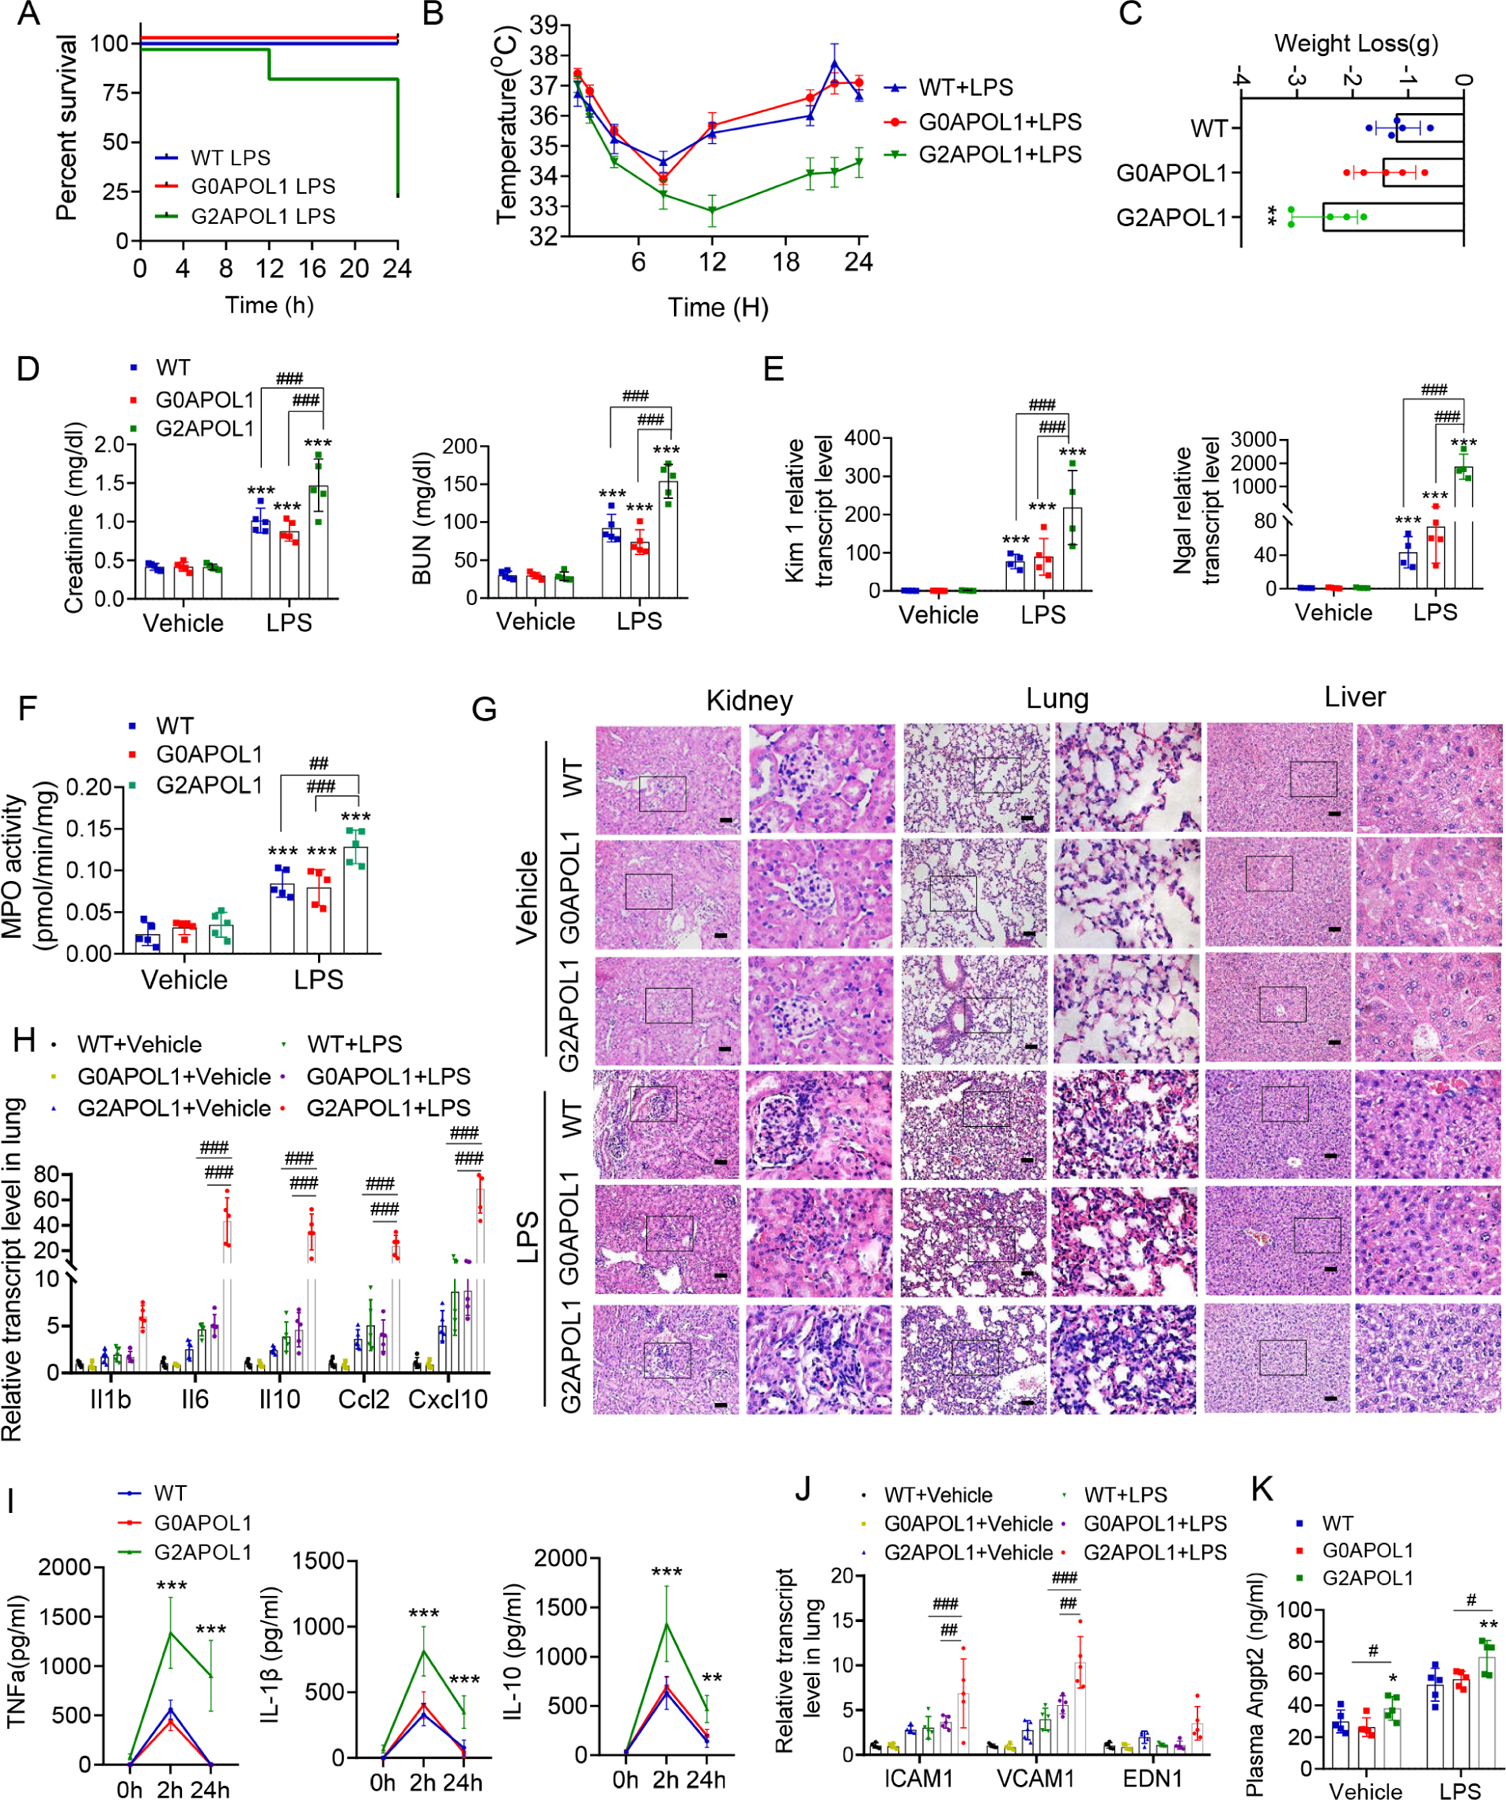
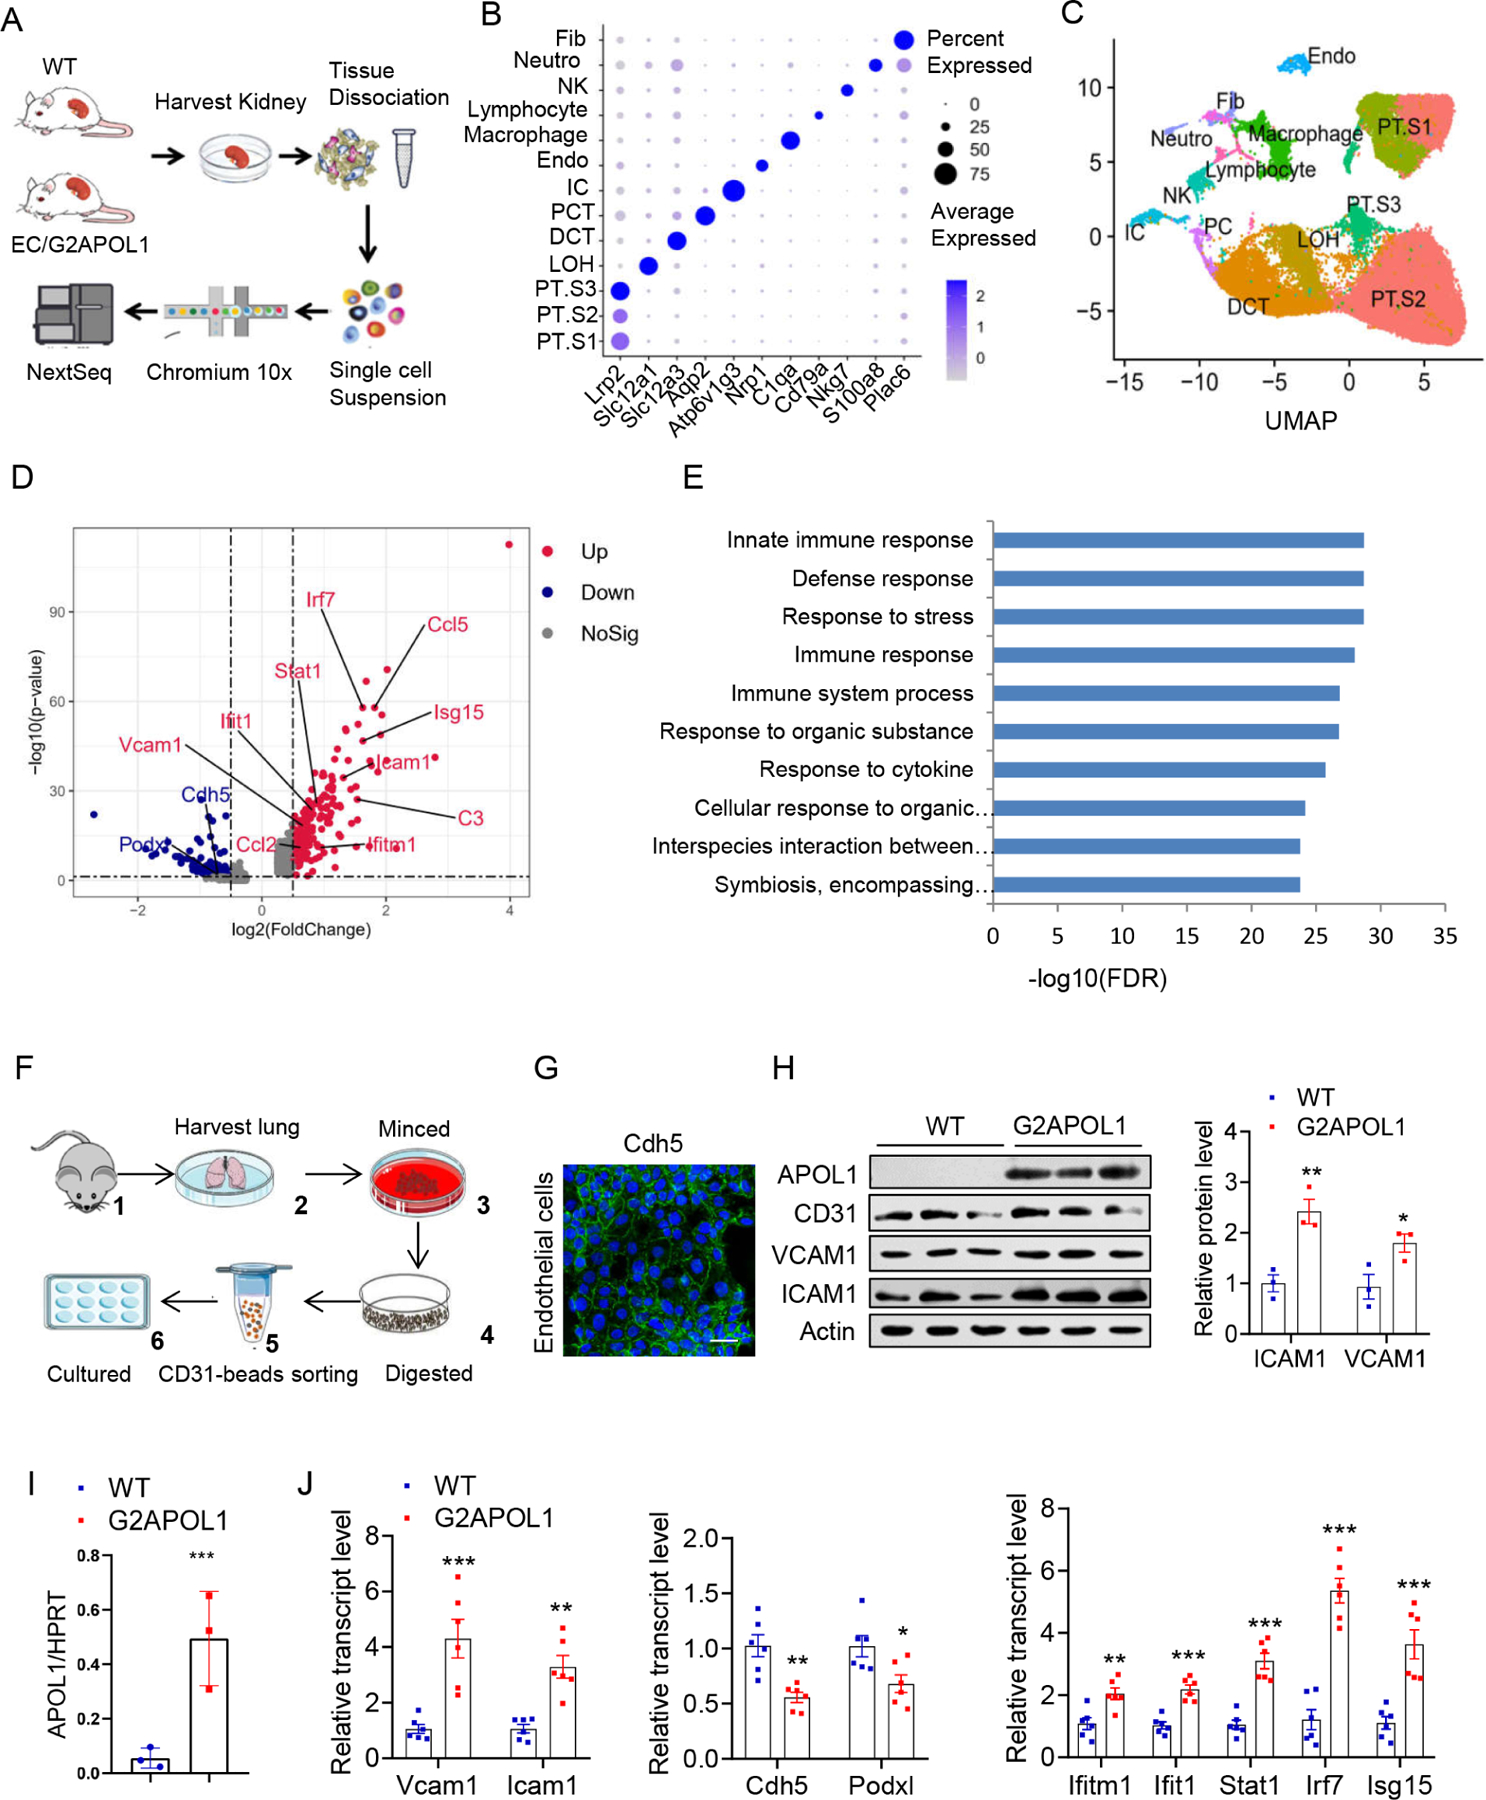
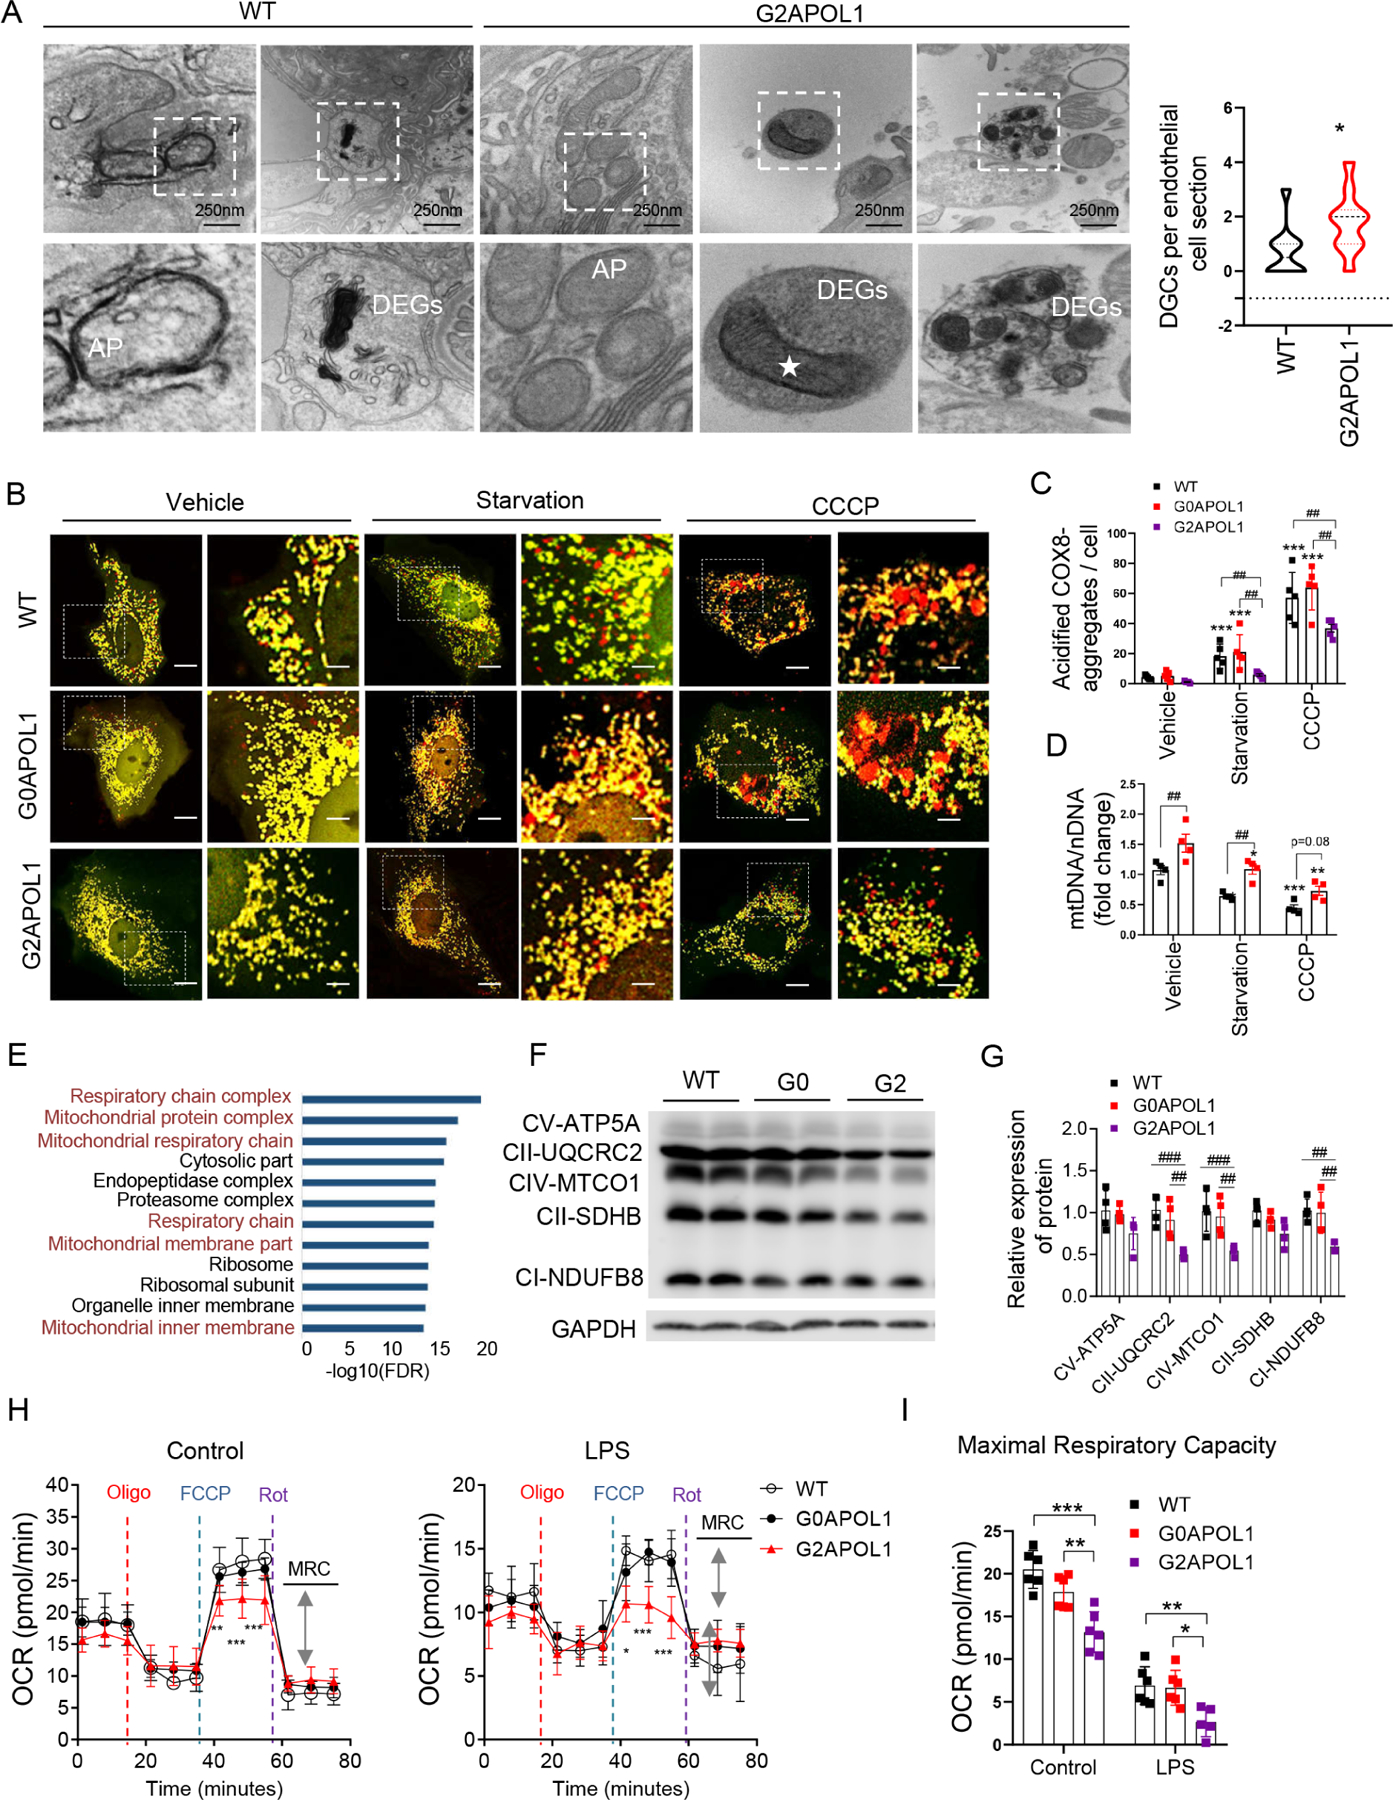
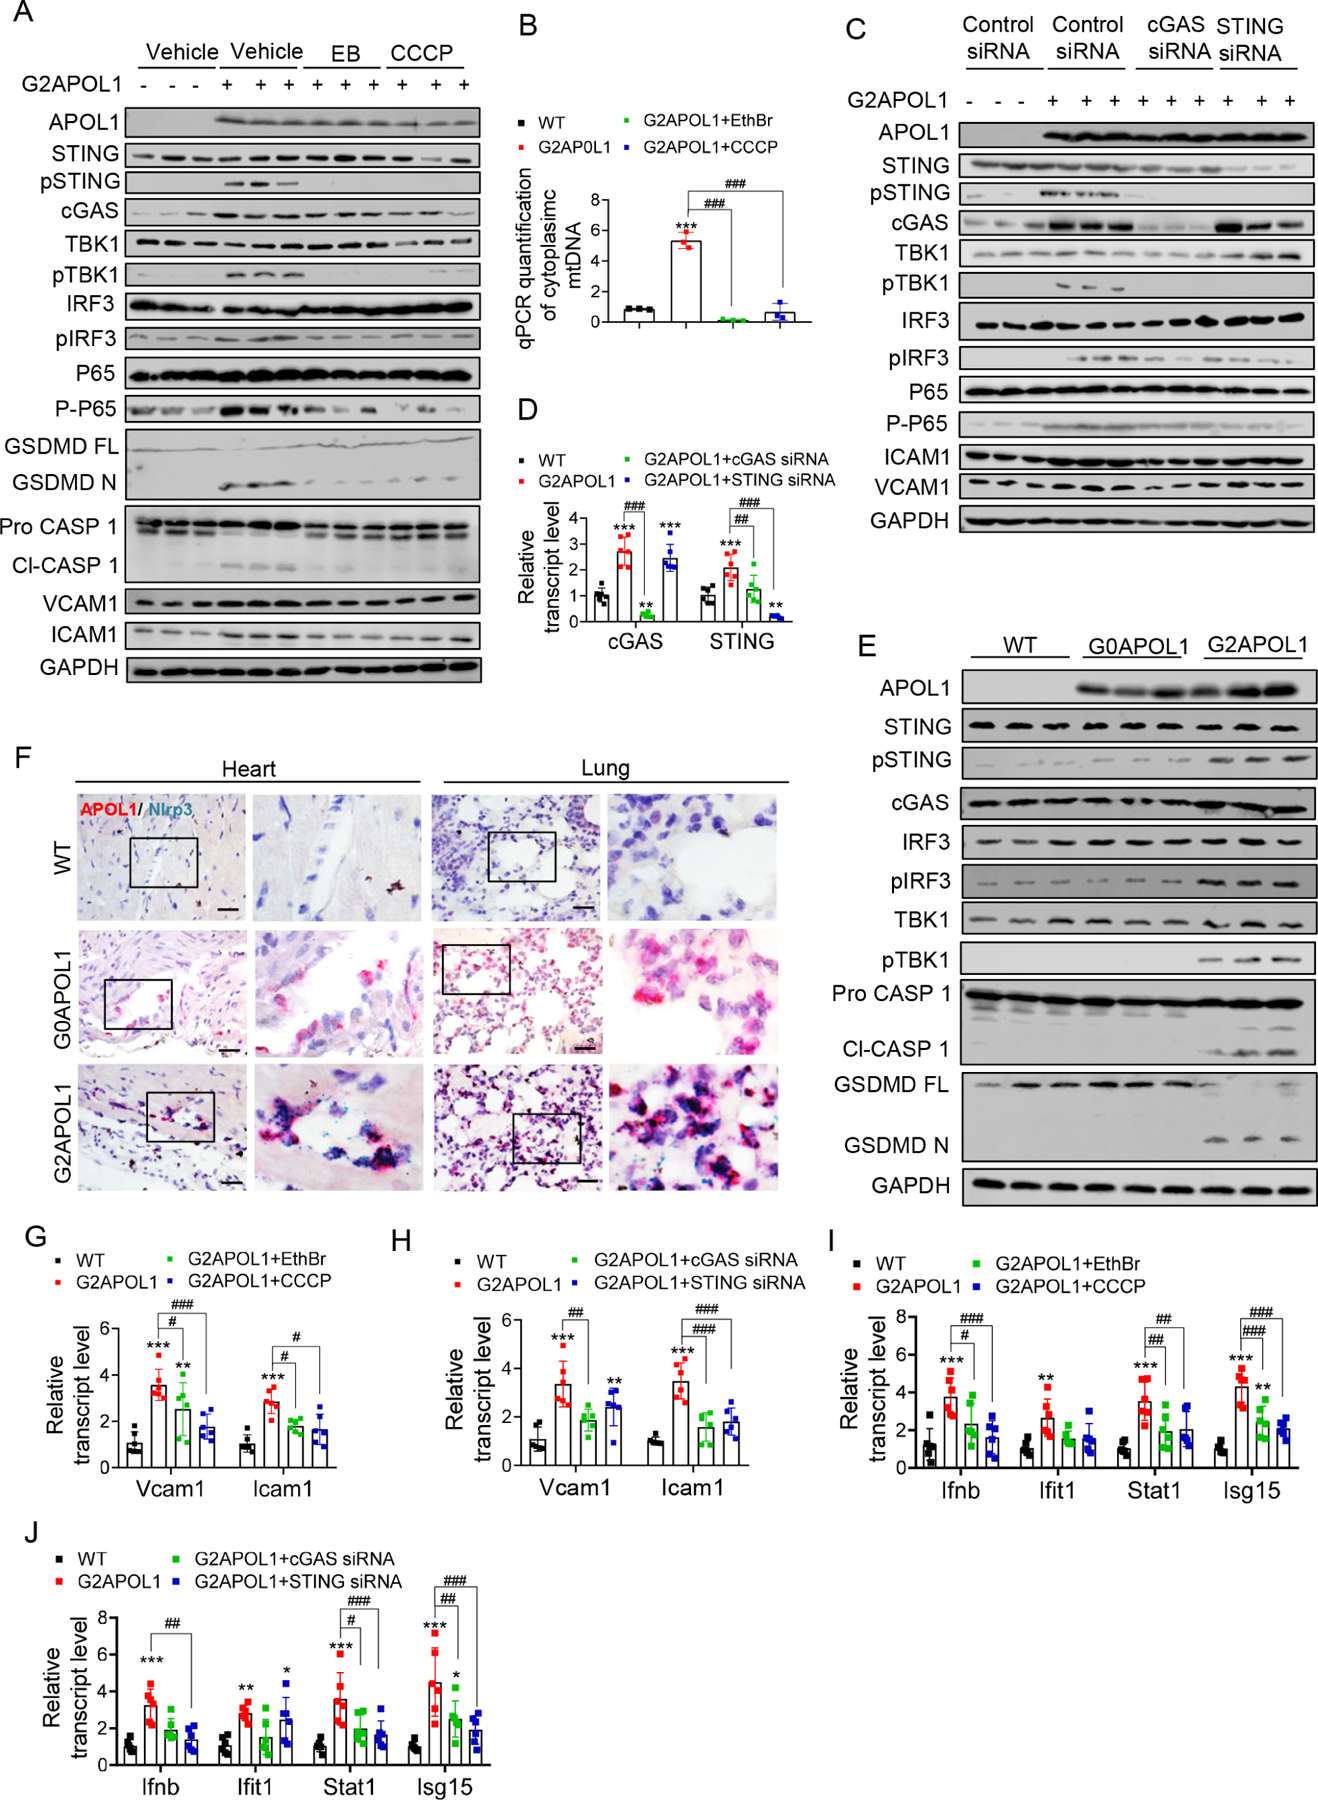
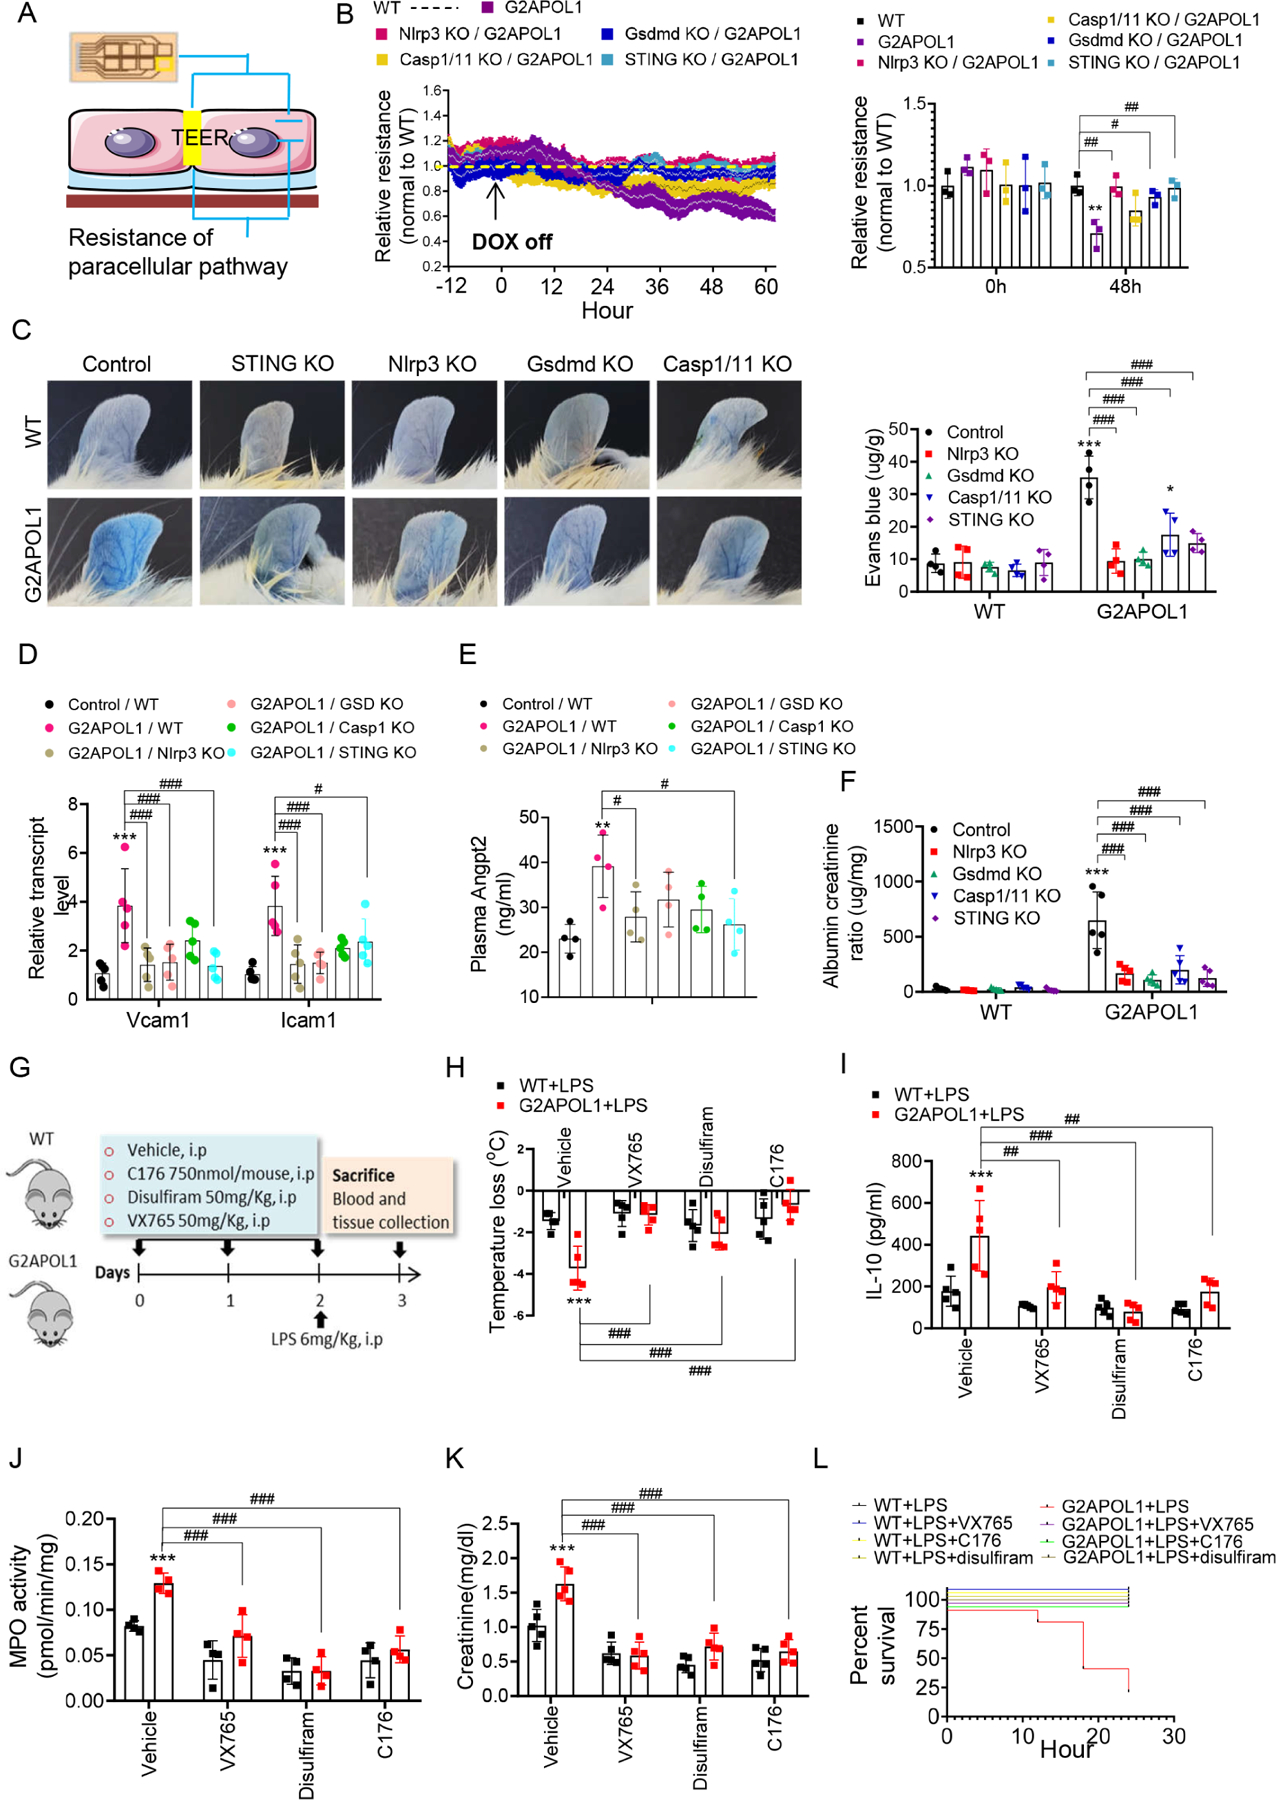
The incidence and severity of sepsis is higher among individuals of African versus European ancestry. We found that genetic risk variants (RVs) in the trypanolytic factor apolipoprotein L1 (APOL1), present only in individuals of African ancestry, were associated with increased sepsis incidence and severity. Serum APOL1 levels correlated with sepsis and COVID-19 severity, and single-cell sequencing in human kidneys revealed high expression of APOL1 in endothelial cells. Analysis of mice with endothelial-specific expression of RV APOL1 and in vitro studies demonstrated that RV APOL1 interfered with mitophagy, leading to cytosolic release of mitochondrial DNA and activation of the inflammasome (NLRP3) and the cytosolic nucleotide sensing pathways (STING). Genetic deletion or pharmacological inhibition of NLRP3 and STING protected mice from RV APOL1-induced permeability defects and proinflammatory endothelial changes in sepsis. Our studies identify the inflammasome and STING pathways as potential targets to reduce APOL1-associated health disparities in sepsis and COVID-19.

Keywords: APOL1; COVID-19; endothelial cell; mitophagy; sepsis.


Conflict of interest statement

Declaration of interests The Susztak lab is supported by Boehringer Ingelheim, Regeneron, Bayer, GSK, Novartis, and Novo Nordisk for work that is not related to the current manuscript. K.S. is on the advisory board of Jnana.

Figures

Figure 1.
Figure 1.. Association of APOL1 risk genotypes, plasma APOL1 levels with sepsis and COVID19 severity
A. Association between APOL1 risk alleles and Systemic infections/Sepsis phenotypes in the MVP cohort. A recessive model was used to estimated odds ratios (ORs) and 95% CIs. All analyses were adjusted for age and sex and 10 principal components of ancestry. B. Study flow-chart, showing AKI incidence and mortality. We enrolled n=70 participants with sepsis in the MESSI cohort (C-G) and n=30 in the COVID19 (H-L) cohorts. C. Plasma APOL1 levels (at presentation) (y-axis) in non-AKI and AKI patients in the MESSI cohort. *p<0.05. D. Plasma APOL1 levels (at presentation) in non-AKI, AKI stage 1 (AKI 1), AKI stage 2 (AKI 2), and AKI stage 3 (AKI 3) patients. *p<0.05 vs Non-AKI; #p < 0.05 vs. indicated group. E. Plasma APOL1 levels in surviving and non-surviving patients at presentation. **p<0.01. F. The correlation of plasma APOL1 levels at presentation and ApacheIII score. G. The correlation of plasma APOL1 levels at presentation and ANGPT2. H. Plasma APOL1 levels in participants with and without AKI in the COVID19 study. ***p<0.001. I. The correlation of change in plasma APOL1 level (Δ APOL1) (the increase in APOL1 from admission to day 2, day 7 and day 28) with change in eGFR (Δ eGFR) (between previous measurements). J. Plasma APOL1 levels on day 1, 2, and 7 in survivors (N=12) and non-survivors (N=6). K. The correlation of plasma APOL1 and ANGPT2 levels in the COVID19 cohort. NPX: Normalized Protein expression. L. The correlation of plasma APOL1 and LAP.TGF.beta-1 levels in the COVID19 cohort
Figure 2.
Figure 2.. Endothelial-specific expression of RV APOL1 in mice induced vascular leakage and inflammation
A. Genome browser view of read density in snATAC-seq clusters in human kidney cells at APOL1 locus, endo (endothelial cells). B. Representative images of CD31 (blue) and APOL1 (red) in situ hybridization in a healthy human lung sample. Black arrows indicate co-localizations of APOL1 with CD31. Scale bar=20μm. C. Representative images of double immunofluorescence staining of a healthy human lung sample with CD31 (red) and APOL1 (green). White arrows indicate the co-localization of APOL1 with CD31. Scale bar=10μm. D. Experimental design for the generation of Cdh5-tTA/TREG0APOL1-GFP (EC/G0APOL1) and Cdh5-rtTA/TREG2APOL1-GFP (EC/G2APOL1) mice. E. Representative images of APOL1 in situ hybridization in kidneys, hearts, and lungs of wild-type (WT), EC/G0APOL1 and EC/G2APOL1 mice. The red arrows indicate the expression of APOL1 mRNA. Scale bar=40μm F. (Upper panel) Representative kidney transmission electron micrographs (TEM) of WT and EC/G2APOL1 mice reveal endothelial cells with loss of glomerular capillary cell fenestrations (arrows), and asterisks show the basement membrane, FP, podocyte foot process. (Lower panel) Representative Lung TEM from EC/G2APOL1 mice show capillary endothelial cell membrane loss (arrowheads) and delamination compared to WT mice. Arrows show the capillary endothelial cell membrane, and asterisks show the basement membrane. RBCs within the alveolar capillary lumen (ACL) are shown. AS, alveolar space; T1, alveolar type 1 epithelial cell. Scale bars, 500 nm. G. Relative mRNA levels of glycoproteins; Syndecan 1 (Sdc1), Syndecan 2 (Sdc2), Syndecan 3 (Sdc3), Syndecan 4 (Sdc4), Metalloproteinase-2 (Mmp2), Metalloproteinase-9 (Mmp9), and Metalloproteinase-14 (Mmp14); Heparin sulfate genes Heparanase (Hpse), Sulfatase 1 (Sulf1), Sulfatase 2 (Sulf2); Hyaluronan genes Hyaluronan Synthase 1 (Has1), Hyaluronan Synthase 2 (Has2), Hyaluronidase 1 (Hyal1), and Hyaluronidase 2 (Hyal2) were evaluated in the lung of WT (N = 3), EC/G0APOL1 (N = 5) and EC/G2APOL1 (N = 5) mice. ; *p < 0.05, **p<0.01, ***p<0.001 vs WT. H. Relative mRNA levels of vascular cell adhesion molecule 1 (Vcam1), intercellular adhesion molecule 1 (Icam1), nitric oxide synthase 3 (Nos3), and monocyte chemoattractant protein-1 (Ccl2) were evaluated in kidneys of WT (N = 3), EC/G0APOL1 (N = 5) and EC/G2APOL1 (N = 5) mice. Gapdh was used for normalization. *p < 0.05, ***p<0.001 vs WT; #p < 0.05, ##p < 0.01, ###p < 0.001 vs. indicated group. I. Representative western blots from lung lysates of WT, EC/G0APOL1 and EC/G2APOL1 mice showing levels of APOL1, ICAM1, VCAM1, Caveolin-1, eNOS, and GAPDH. J. Representative ear photographs of Evan’s blue dye leakage after Evan’s blue injection into WT, EC/G0APOL1, and EC/G2APOL1 mice. Right panel, spectrophotometric analysis of the amount of extravasated Evans blue dye (N=5). ***p < 0.001, vs WT; ###p < 0.001 vs. indicated group. K. Plasma Angiopoietin 2 (Angpt2) level in WT (N=5), EC/G0APOL1 (N=5), and EC/G2APOL1 (N=6) mice. **p<0.01 vs WT; #p < 0.05 vs. indicated group. L. Urinary albumin/creatinine ratio (ACR) of EC/G0APOL1 and EC/G2APOL1 at baseline, 1, 14 and 22 weeks off doxycycline diet. Single transgenic littermates served as controls (WT) (N = 5, 6, 6 for WT, G0 and G2, respectively). **p<0.01, ***p<0.001, compares WT mice at the same time points.
Figure 3.
Figure 3.. Endothelial RV APOL1 increases sepsis and endotoxemia severity
A. Survival after intraperitoneal injection of LPS (6mg/kg) in WT (N=5), EC/G0APOL1 (N=5) and EC/G2APOL1 (N=20) mice. B. Body temperature response to LPS of WT (N=5), EC/G0APOL1 (N=5) and EC/G2APOL1 (N=5) mice. C. Weight loss after intraperitoneal injection of LPS (6mg/kg) at 24h in WT (N=5), EC/G0APOL1 (N=5) and EC/G2APOL1 (N=5) mice. **p<0.01 vs WT. D. Renal function of WT (N=5), EC/G0APOL1 (N=5) and EC/G2APOL1 (N=5) mice 24 hours after saline or LPS injection, assessed by serum BUN and creatinine. ***p<0.001 vs Vehicle; ##p < 0.01, ###p < 0.001 vs. indicated group. E. Relative transcript level of AKI injury markers Kidney injury molecule-1 (Kim1), and urine neutrophil gelatinase-associated lipocalin (Ngal) in the kidneys of WT (N = 4), EC/G0APOL1 (N=5) and EC/G2APOL1 (N = 4) mice 24 hours after saline or LPS injection. ***p<0.001 vs vehicle; ###p < 0.001 vs. indicated group. F. MPO activity was measured in lungs obtained 24 hours after administration of saline or LPS in WT (N = 5), EC/G0APOL1 (N=5) and EC/G2APOL1 (N = 5) mice. ***p<0.001 vs vehicle; ##p < 0.01, and ###p < 0.001 vs. indicated group. G. Representative images of H&E-stained sections of kidneys, hearts, and lungs 24 hours after saline or LPS injection in WT, EC/G0APOL1 and EC/G2APOL1 mice. Scale bar=40 μm. H. Relative mRNA levels of Il1b, Il6, Il10, Ccl2 and Cxcl10 in the lung of WT (N = 5), EC/G0APOL1 (N = 5) and EC/G2APOL1 (N = 5) mice. Gapdh was used for normalization. ###p < 0.001 vs. indicated group. I. Serum IL10, IL-1β and TNFα of WT (N = 5), EC/G0APOL1 (N = 5) and EC/G2APOL1 (N = 5) mice at 2 and 24hr after LPS injection; **p<0.01, ***p<0.001 vs WT; ###p < 0.001 vs. indicated group. J. Relative mRNA levels of Vcam1, Icam1, and Edn1 were evaluated in lungs of WT (N = 5), EC/G0APOL1 (N = 5) and EC/G2APOL1 (N = 5) mice; Gapdh was used for normalization. ##p < 0.01, ###p < 0.001 vs. indicated group. K. Plasma Angpt2 of WT (N = 5), EC/G0APOL1 (N = 5) and EC/G2APOL1 (N = 5) mice 24 hours after saline or LPS injection; *p<0.05, **p<0.001 vs WT; #p < 0.05 vs. indicated group.
Figure 4.
Figure 4.. Single cell profiling of EC/G2APOL1 highlighted endothelial inflammation
A. The diagram summarizes the process of cell isolation and single cell RNA-seq analysis of the WT and EC/G2APOL1 mouse kidney using the 10X Genomics platform. B. Bubble plots showing the expression levels of representative marker genes across the 13 main clusters. Fib, fibroblast; Neutro, neutrophil; NK, natural killer cell; lymph, lymphocyte; Macro, macrophage; Endo, containing endothelial; IC, intercalated cell; PCT, proximal convoluted tubule; DCT, distal convoluted tubule; LOH, ascending loop of Henle; PT.S3, proximal tubule S3; PT.S2, proximal tubule S2; PT.S1, proximal tubule S1. PC, principal cells C. UMAP dimension reduction of single cell RNAseq of mouse kidney samples from WT and EC/G2APOL1 mice. D. Volcano plot showing the difference of the mean expression between WT and G2APOL1 ECs in the single cell data. E. GO (gene ontology) functional analysis of DEGs when WT and G2APOL1 ECs were compared. The 10 most significantly (P<0.05) enriched GO terms in biological process are presented (p was negative 10-base log transformed). DEGs, differentially expressed genes; GO, gene ontology. F. Schematic representation of primary lung endothelial cell isolation and enrichment. G. Representative images of Cdh5 immunofluorescence stain in isolated primary pulmonary microvascular endothelial cells. Scale bar=20μm. H. Protein levels of APOL1, CD31, VCAM1, ICAM1, and Actin were analyzed by immunoblots in WT and G2APOL1 ECs. (Right panel) densitometric quantification of levels ICAM1 and VCAM1 normalized to GAPDH. *p<0.05 and **p<0.01 vs WT. I. Relative APOL1 transcript level in ECs from WT (N = 3) and EC/G2APOL1 (N = 3) mice. APOL1 mRNA level is normalized to HPRT. ***p<0.05 vs WT. J. Relative mRNA levels of Vcam1, Icam1, Ifitm1, Ifit1, Stat1, lrf7, Isg15, Cdh5 and Podxl in WT (N=6) and G2APOL1 (N=6) ECs. *p<0.05, **p<0.01, and ***p<0.001 vs WT.
Figure 5.
Figure 5.. RV APOL1 in endothelial cells induces autophagy and mitophagy defect
A. Representative EM images of the autophagosomes (AP) and DGCs in the kidney of WT and EC/G2APOL1 mice. White star, Autophagosome / autolysosome-engulfed mitochondria. Scale bars: 250 nm. (Right panel) Quantification of the number of DGCs per cell section; DGCs, cellular degradative compartments; *p < 0.05 vs. WT B. Mitophagy was examined in cells transiently expressing Cox8-EGFP-mCherry. WT, G0APOL1 or G2APOL1 ECs treated with vehicle, starvation (HBSS, 4h), or CCCP (40uM, 2h). The red punctate represent mitochondrial contents within acidic compartments. Scale Bar = 10 µm. C. Quantification of red-only punctate in panel (B). ***p<0.001 vs. Vehicle; ##p < 0.01 vs. indicated group. 30 cells in 6 fields were counted in each group. D. Mitochondrial mass determined by qRT-PCR analysis of the mtDNA/nuclear DNA (nDNA) ratio in WT (N=6) or G2APOL1 (N=6) ECs treated as in B; **p<0.01 and ***p<0.001 vs. Vehicle. ##p < 0.01 vs. indicated group. E. Gene ontology analysis (molecular function) of genes differentially expressed by endothelial cells (G2 vs WT) using DAVID. The 12 most significantly (P<0.05) enriched GO terms in cellular component branches are presented (p is negative 10-base log transformed). F. Western blots of WT, G0APOL1 and G2APOL1 ECs, showing levels of OXPHOS proteins (CV-ATP5A, CII-UQCRC2, CIV-MTCO1, CII-SDHB and CI-NDUFB8), and GAPDH. G. Densitometric quantification of OXPHOS proteins normalized to GAPDH. N=3 independent experiments; ##p < 0.01, ###p < 0.001 vs. indicated group. H. Real-time changes in the OCR of WT, G0APOL1 and G2APOL1 ECs after treatment with oligomycin (Oligo), FCCP, and rotenone (Rot) in the presence or absence of LPS (100ng/ml, 24h). MRC, maximal respiratory capacity (double-headed arrow). *p<0.05, **p<0.01, ***p<0.001, compares WT at the same time points. I. Maximal respiratory capacity of ECs measured by real-time changes in OCR. *p < 0.05, **p < 0.01, and ***p < 0.001 vs. indicated group.
Figure 6.
Figure 6.. Mitophagy defect in RV APOL1 ECs causes cytosolic mtDNA leakage and inflammasome and STING activation leading to an inflammatory, pro-adhesive endothelial phenotype
A. Protein expression of APOL1, VCAM1, ICAM1, inflammasome and cytosolic nucleotide sensors (STING, pSTING, cGAS, TBK1, pTBK1, IRF3, pIRF3, P65, P-P65, GSDMD and Caspase 1) were analysed on immunoblots in WT, and G2APOL1 ECs treated with Vehicle, ethidium bromide (EthBr) (150ng/ml 48hours), or CCCP (40uM, 2hours). B. Total DNA was harvested from cytosolic and nuclear fractions of WT or G2APOL1 ECs treated as (A) and analysed by qRT-PCR. Cytosolic mtDNA genes were normalized to respective nuclear Rpl13a; ***p<0.001 vs WT; ###p < 0.001 vs. indicated group. C. Western blot analysis of APOL1, VCAM1, ICAM1 and cGAS-STING proteins (STING, pSTING, cGAS, TBK1, pTBK1, IRF3, pIRF3) in WT and G2APOL1 ECs treated with vehicle, STING or cGAS siRNA. D. Relative transcript level of cGAS and STING in WT and G2APOL1 ECs treated as (C). **p<0.01, ***p<0.001 vs WT; ###p < 0.001 vs. indicated group. E. Immunoblot analysis using antibodies against STING, pSTING, cGAS, TBK1, pTBK1, IRF3, pIRF3, Caspase 1, GSDMD and Actin in lung tissue from WT, EC/G0APOL1 and EC/G2APOL1 mice. F. Representative images of Nlrp3 (blue) and APOL1 (red) in situ hybridization in heart and lung of WT, EC/G0APOL1 and EC/G2APOL1 mice. Scale bar=20μm. G. Relative transcript level of Icam1 and Vcam1 in WT and G2APOL1 ECs treated as (A); Gapdh was used for normalization. **p<0.01, ***p<0.001 vs WT; #p < 0.05, ###p < 0.001 vs. indicated group. H. Relative transcript level of Icam1 and Vcam1 in WT and G2APOL1 ECs treated as (C); Gapdh was used for normalization. **p<0.01, ***p<0.001 vs WT; ##p < 0.01, ###p < 0.001 vs. indicated group. I. Relative transcript level of Ifnb, Ifitm1, Stat1 and Isg15 in WT and G2APOL1 ECs treated as (A); **p<0.01, ***p<0.001 vs WT; #p < 0.05, ##p < 0.01, ###p < 0.001 vs. indicated group. J. Relative transcript level of Ifnb, Ifitm1, Stat1 and Isg15 in WT and G2APOL1 ECs treated as (C); **p<0.01, ***p<0.001 vs WT; #p < 0.05, ##p < 0.01, ###p < 0.001 vs. indicated group.
Figure 7.
Figure 7.. Genetic targeting of the NLRP3 and STING ameliorated endothelial RV APOL1 induced endotheliopathy and sepsis with pharmacological therapeutic potential
A. TEER: Trans-endothelial electrical resistance measurement of endothelial function B. (Left panel) TEER measured in real time in ECs from WT, EC/G2APOL1, Nlrp3−/−/G2APOL1, Gsdmd−/− /G2APOL1, Casp 1/11−/−/G2APOL1 and STING−/−/G2APOL1 mice. At each individual time point, TEER values were normalized to WT ECs. (Right panel) Relative TEER at 0 hr and 48 hr after removal of DOX. **p<0.01 vs. WT; #p < 0.05, ##p < 0.01 vs. indicated group. C. Representative photographs of Evan’s blue dye leakage in ears. (Right panel) Spectrophotometric analysis of the amount of extravasated Evans blue dye from mouse ears. *p<0.05, **p<0.01 vs. WT; ###p < 0.001 vs. indicated group. D. Relative mRNA levels of Vcam1 and Icam1 in indicated groups. ***p<0.001 vs. WT; #p < 0.05, ###p < 0.001 vs. indicated group. E. Plasma Angpt2 level in indicated groups. **p<0.01 vs. WT; #p < 0.05 vs. indicated group. F. Urinary albumin/creatinine ratio (ACR) of indicated groups at 10 weeks off doxcycyline diet. ***p<0.001 vs. WT; ###p < 0.001 vs. indicated group. G. Experimental design: Pharmacological targeting of the inflammasome and nucleotide sensing pathways in WT and EC/G2APOL1 mice. H. Body temperature response to saline or LPS at 12h in group as shown in Panel (G). I. Serum IL10 of mice as shown in Panel (G) 24h after saline or LPS injection; ***p<0.001 vs WT+LPS; ##p < 0.01, ###p < 0.001 vs. indicated group. J. MPO activity was measured in the lung obtained 24 hr after the administration of saline or LPS in in group as shown in Panel G; **p<0.01, ***p<0.001 vs WT+LPS; ##p < 0.01 vs. indicated groups K. Renal function of mice as shown in Panel G at 24h after saline or LPS injection, assessed by creatinine. ***p<0.001 vs WT+LPS; ###p < 0.001 vs. indicated group. L. Survival after intraperitoneal injection of LPS (6mg/kg) in group as shown in Panel G.

Comment in

References

    1. Aarreberg LD, Esser-Nobis K, Driscoll C, Shuvarikov A, Roby JA, and Gale M Jr. (2019). Interleukin-1beta Induces mtDNA Release to Activate Innate Immune Signaling via cGAS-STING. Mol Cell 74, 801–815 e806. - PMC - PubMed
    1. Alsan M, Stantcheva S, Yang D, and Cutler D (2020). Disparities in Coronavirus 2019 Reported Incidence, Knowledge, and Behavior Among US Adults. JAMA Netw Open 3, e2012403. - PMC - PubMed
    1. Bajaj A, Susztak K, and Damrauer SM (2017). APOL1 and Cardiovascular Disease: A Story in Evolution. Arterioscler Thromb Vasc Biol 37, 1587–1589. - PMC - PubMed
    1. Beckerman P, Bi-Karchin J, Park AS, Qiu C, Dummer PD, Soomro I, Boustany-Kari CM, Pullen SS, Miner JH, Hu CA, et al. (2017). Transgenic expression of human APOL1 risk variants in podocytes induces kidney disease in mice. Nat Med 23, 429–438. - PMC - PubMed
    1. Bick AG, Akwo E, Robinson-Cohen C, Lee K, Lynch J, Assimes TL, DuVall S, Edwards T, Fang H, Freiberg SM, et al. (2019). Association of APOL1 Risk Alleles With Cardiovascular Disease in Blacks in the Million Veteran Program. Circulation 140, 1031–1040. - PMC - PubMed

Publication types

MeSH terms