. 2021 Oct 28;184(22):5593-5607.e18.
doi: 10.1016/j.cell.2021.09.035.

Pan-ebolavirus protective therapy by two multifunctional human antibodies

Affiliations

Pan-ebolavirus protective therapy by two multifunctional human antibodies

Pavlo Gilchuk et al. Cell. .

Abstract

Ebolaviruses cause a severe and often fatal illness with the potential for global spread. Monoclonal antibody-based treatments that have become available recently have a narrow therapeutic spectrum and are ineffective against ebolaviruses other than Ebola virus (EBOV), including medically important Bundibugyo (BDBV) and Sudan (SUDV) viruses. Here, we report the development of a therapeutic cocktail comprising two broadly neutralizing human antibodies, rEBOV-515 and rEBOV-442, that recognize non-overlapping sites on the ebolavirus glycoprotein (GP). Antibodies in the cocktail exhibited synergistic neutralizing activity, resisted viral escape, and possessed differing requirements for their Fc-regions for optimal in vivo activities. The cocktail protected non-human primates from ebolavirus disease caused by EBOV, BDBV, or SUDV with high therapeutic effectiveness. High-resolution structures of the cocktail antibodies in complex with GP revealed the molecular determinants for neutralization breadth and potency. This study provides advanced preclinical data to support clinical development of this cocktail for pan-ebolavirus therapy.

Keywords: Ebolavirus; antibody therapeutics; ebolavirus infection; epitope mapping; glycoprotein; neutralizing antibodies; viral antibodies.


Conflict of interest statement

Declaration of interests J.E.C. has served as a consultant for Eli Lilly, GlaxoSmithKline and Luna Biologics, is a member of the Scientific Advisory Boards of CompuVax and Meissa Vaccines, and is Founder of IDBiologics. The Crowe laboratory at Vanderbilt University Medical Center has received unrelated sponsored research agreements from Takeda Vaccines, IDBiologics, and AstraZeneca. Vanderbilt University has applied for patents concerning ebolavirus antibodies that are related to this work. All other authors declare no competing interests.

Figures

Figure 1.
Figure 1.. Functional activities of pan-ebolavirus cocktail candidate mAbs rEBOV-442 and rEBOV-515.
(A) EBOV, BDBV, or SUDV neutralization. Ebolaviruses encoding enhanced green fluorescent protein (eGFP) were incubated with increasing concentrations of recombinantly produced purified mAbs, and infection was determined at 3 days after inoculation by measuring eGFP fluorescence in cells. Mean ± SD of technical triplicates from one experiment are shown. (B) In vitro killing capacity mediated by the Fc regions of IgG1-engineered variants of mAbs measured by rapid fluorometric antibody-mediated cytotoxicity (RFADCC) assay. Human PBMCs (effector cells) were incubated with a SNAP-tagged EBOV GP-expressing 293F cell line as a target in the presence of increasing concentrations of purified recombinant mAbs, and cytotoxic activity was measured by flow cytometry. Antibody rDENV 2D22 served as a negative control. The dotted line indicates assay background. Mean ± SD of technical duplicates from one experiment are shown. (C) Heat map summarizing reactivity breadth and potency of rEBOV-442 and rEBOV-515. * indicates data determined in our previous work using hybridoma-cell-secreted mAbs (Gilchuk et al., 2018a). (D) Results of viral selections with individual antibodies or the combination of rEBOV-442 + rEBOV-515 (defined as the “cocktail”), indicating the number of replicates with escape out of total number tested, resistance of selected escape variants to individual antibodies or the cocktail, and the selected mutations in the GP that escape neutralization by indicated mAb. Broadly-neutralizing mAbs ADI-15878 and ADI-15946 (Wec et al., 2017) were included for comparative purposes. The escape selection was performed using chimeric VSV expressing EBOV or BDBV GP. See also Figure S1.
Figure 2.
Figure 2.. Differential requirements for the Fc regions of mAbs rEBOV-442 and rEBOV-515 for optimal therapeutic protection in mice.
C57BL/6 mice were challenged with EBOV-MA (day 0), treated at 1 dpi with wild-type IgG1 or IgG1 LALA-PG variant of mAbs rEBOV-442 (5 mg/kg) and rEBOV-515 (1 mg/kg), and monitored for 28 days. Antibodies ADI-15946 IgG1 (1 mg/kg) and ADI-15878 IgG1 (5 mg/kg) were included for comparative purposes, and mAb rDENV 2D22 was used as a control. (A) Kaplan-Meier survival plot. The overall difference in survival between the groups was estimated using two-sided log-rank (Mantel–Cox) test. (B) Weight change. A historical control for protection from weight loss with 5 mg/kg of hybridoma-produced mAb EBOV-515 treatment (Gilchuk et al., 2018a) is indicated with a raspberry dotted line. (C) Clinical score. Mean values are shown in (B-C). For the rEBOV-515 and rEBOV-442 treatment groups a total of n=10 mice per group was analyzed in two independent experiments, for which cumulative data are shown. For the ADI-15946 and ADI-15878 treatment groups, data represent one experiment with 5 mice per group. Body-weight-change and clinical score data in (B-C) are shown only for the animals that survived at each indicated time point. Timepoints for mAb treatment are indicated with dotted vertical lines
Figure 3.
Figure 3.. Broad and synergistic neutralizing activity mediated by the cocktail of rEBOV-442 and rEBOV-515.
Neutralizing activity of individual mAbs or their mixture was assessed using chimeric VSV viruses and RTCA assay. (A) Neutralization of VSV/EBOV GP, VSV/BDBV GP, or VSV/SUDV GP by rEBOV-442 alone, rEBOV-515 alone, or a 1:1 mixture of rEBOV-442 and rEBOV-515. (B) Serially-diluted rEBOV-442 was titrated into serially-diluted rEBOV-515 to generate a pairwise combinatorial matrix of two mAbs in the mixture. The matrix shows neutralization dose-response data for VSV/EBOV GP, VSV/BDBV GP, or VSV/SUDV GP, by indicated concentrations of rEBOV-442 and rEBOV-515. Axes denote the concentration of each mAb, with the percent neutralization shown in each square. The heat map denotes a gradient of 0 (white) to 100% (red) neutralization. Examples of neutralization by rEBOV-515 alone (raspberry box) or rEBOV-442 alone (blue box) in comparison to a combined indicated concentration of two mAbs in the cocktail (green box) are shown. (C) Synergy distribution map generated from the dose-response neutralization matrix in (B). Red color indicates areas in which synergistic neutralization was observed; shaded grey box indicates the area of maximum synergy between the two mAbs, and the δ-score for this area is shown. The δ-score is a synergy score: values < −10 indicate antagonism; values −10 to 10 indicate an additive effect; values >10 indicate synergy. Data in (A-C) are from a representative experiment performed in technical duplicate and repeated three times. See also Figures S2-S3.
Figure 4.
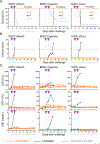
Figure 4.. The cocktail treatment provides pan-ebolavirus protection of nonhuman primates against disease.
Rhesus macaques were inoculated with a lethal dose of the EBOV/Kikwit or SUDV/Gulu viruses intramuscularly (i.m.) on day 0 and were treated with total 30 mg/kg of the cocktail (1:2 mixture of rEBOV-442 and rEBOV-515) intravenously on 3 and 6 dpi (EBOV/Kikwit; n = 5 per cohort), or 4 and 7 dpi (SUDV/Gulu; n = 5 per cohort). Cynomolgus monkeys were inoculated with a lethal dose of the BDBV/Uganda i.m. on day 0 and were treated with a total dose of 30 mg/kg of the cocktail (1:2 mixture of rEBOV-442 and rEBOV-515) intravenously on 6 and 9 dpi (n = 5 per cohort). The contemporaneous control was an untreated NHP challenged with the virus (n = 1 for each cohort). One experiment was performed. (A) Kaplan-Meier survival plot. The historical untreated controls (grey) are shown for comparative purposes (see Methods). The proportion surviving at day 28 after viral challenge in the treated cohort was compared to the respective historical untreated cohort using a 2-sided exact unconditional test of homogeneity. (B) Clinical score. (C) Selected blood chemistry measurements: ALP, alkaline phosphatase; GGT, gamma-glutamyl transpeptidase; CRE, creatinine. Antibody treatment times are indicated with blue dotted vertical lines. Orange curves indicate treated, and black indicate untreated animals in (A) to (C). The black dotted line in (B) indicates the clinical score threshold for euthanasia. Timepoints for mAb treatment are indicated with dotted vertical lines in (A-C). See also Tables S1-6.
Figure 5.
Figure 5.. The cocktail treatment provides pan-ebolavirus protection of nonhuman primates against viremia.
Blood viral loads were assessed from individual animals that were challenged with EBOV/Kikwit, BDBV/Uganda, or SUDV/Gulu and treated with the two-antibody cocktail as described in Figure 4. (A) Kinetics of blood viral load determined for genome equivalents (GEq) using qRT-PCR. (B) Kinetics of infectious virus blood viral load as determined by plaque assay. Orange curves indicate treated, and black indicate untreated animals. Antibody treatment times are indicated with blue dotted vertical lines. The black dotted line indicates the limit of detection (LOD), which was 3.7 log10GEq/mL (A) or 25 PFU/mL (B). Violet dot indicates one NHP confirmed to be viremic (5 PFU/mL; LOD = 2 PFU/mL) at 3 dpi upon repeated test using a lower plasma dilution. (C) Viral RNA load in various peripheral tissues of treated NHPs (28 dpi for EBOV and SUDV cohort, or 35 dpi for BDBV cohort). Tissues from succumbed untreated NHP from each cohort were used as controls. The black dotted vertical line indicates the limit of detection, which was 2.4 log10GEq/gram. The data are shown as an aligned dot plot with bar, where orange dots indicate measurement from individual treated animals, black dots and bars indicate measurement from untreated control animals, and orange bar indicates the mean value of the measurements for treated cohorts. For samples in which viral RNA was not detected, the measurement values were set to the limit of detection, 2.4 log10GEq/gram. Brain samples from untreated animals have not been tested. Arrows with numbers indicate immune privileged tissues selected for assessment of infectious virus load as in panel (D). (D) Plaque assay measurements of infectious virus load in representative immune privileged tissues of treated NHPs from each cohort that were selected based on the highest viral RNA load as in panel (C). The < symbol indicates infections virus was not detected, and the LOD was 250 PFU/gram of tissue. Each measurement in (A-D) represents the mean of technical duplicates. The dotted vertical lines in (A-B) indicate timepoints for mAb treatment.
Figure 6.
Figure 6.. rEBOV-515 binds to the major site of vulnerability in the GP base region in a distinct manner.
(A) Cryo-EM structure of rEBOV-442 (heavy chain in blue and light chain in grey) and rEBOV-515 (heavy chain in maroon and light chain in pink) Fab bound to EBOV GPΔMuc/Mak. A side view in relation to the viral membrane is shown. Fab constant domains were excluded by masking. (B) The predicted contact surface of broadly-neutralizing mAbs rEBOV-515 and rEBOV-520 on the surface representation of the EBOV GPΔMuc/Mak monomer model (PDB: 5JQ3). Non-overlapping contact surfaces for rEBOV-515 or rEBOV-520 are shown, respectively, in maroon or orange, and overlapping contact surface of both mAbs is shown in yellow. (C) Contact residue details of the rEBOV-515 heavy chain Fab interactions with the base of GP. CDRH3 contacts include a backbone-mediated hydrogen bond at S102H3 to N512GP2, a key contact that links the β17- β18 loop to the base of the IFL via W291 in unliganded GP1. Contacts near the 310 pocket include a potential hydrogen bond between S105H3 and E106GP1 that forms when a large portion of the CDRH3 loop displaces the β17-β18 loop. Within the CDRH2 loop, Y52H2 and Y55H2 make potential hydrogen bonds via their hydroxyl groups to H549GP2 or H516GP2 on GP2, respectively. One of the most extensive rEBOV-515 contacts is from W103H3, which forms a strong cation-pi bond with R136GP1, allowing R136 to make additional hydrogen bonds with Y34H1 and a salt bridge with E106H3. (D) Epitope details of the rEBOV-515 light chain interactions with the base of GP. The rEBOV-515 light chain makes contacts with all three CDRs exclusively within GP2. Contact features include a potential hydrogen bond between N32L1 and the backbone of C511GP2, and a salt bridge between D50L2 and K510GP2. Pi cation interactions at W94L3 with H549GP2 (black dashed line) and an additional potential hydrogen bond at N92L3 with N550GP2 provide additional stabilizing interactions. (E) Comparison of mAb CDRH3 loops that bind in and around the 310 pocket (blue dashed circle) and putative glycerol pocket (solid yellow line). rEBOV-520 and ADI-15946 replace and mimic residue W291GP1 (that anchors down the β17-β18 loop in apo-GP) with a tryptophan from their CDRH3 loops. rEBOV-515 uses an analogous tryptophan residue (W103H3) to contact R136GP1 via a strong cation-pi interactions bond, which causes a shift in the rotamer of R136GP1. W103H3 from rEBOV-515 also accesses a pocket that is occupied by a glycerol cryoprotectant molecule in the unliganded crystal structure of GP, which is also occupied by Y28L1 from ADI-15946. (F) A shift in the placement of the GP1 α2 helix that cased by the CDRH3 from rEBOV-520 but is lacking in rEBOV-515 binding due to a shorter CDR loop is shown. In (C-D), red dotted lines: hydrogen bonds; green dotted lines: salt bridge; purple dashed line: cation-pi interaction; black dashed line: carbon-pi or aromatic interactions. rEBOV-520-GP PDB: 6PCI; ADI-15946-GP PDB: 6MAM. See also Figures S4-6 and Table S7.
Figure 7.
Figure 7.. Conservation of the binding sites for broad mAbs rEBOV-515, rEBOV-520, and ADI-15946.
Apo-GP is surface-rendered according to residue conservation on the left, with no conservation in dark purple (0%) and complete conservation in white (100%). The corresponding mAb footprints are highlighted. On the right are aligned sequences of the interacting regions on GP from EBOV, BDBV, and SUDV. Total contacts for each residue at 4 Å distance or less were determined (see Table S7) and residues are highlighted in blue according to the number of contacts, with darker blue indicating more contacts and thus a higher likelihood for contributing critically to binding. Residues that are variable are marked with a green diamond. HC contacts are indicated below in dark purple and LC contacts in pink.

References

    1. Agirre J, Iglesias-Fernandez J, Rovira C, Davies GJ, Wilson KS, and Cowtan KD (2015). Privateer: software for the conformational validation of carbohydrate structures. Nat. Struct. Mol. Biol 22, 833–834. - PubMed
    1. Barad BA, Echols N, Wang RY, Cheng Y, DiMaio F, Adams PD, and Fraser JS (2015). EMRinger: side chain-directed model and map validation for 3D cryo-electron microscopy. Nat. Methods 12, 943–946. - PMC - PubMed
    1. Baum A, Fulton BO, Wloga E, Copin R, Pascal KE, Russo V, Giordano S, Lanza K, Negron N, Ni M, et al. (2020). Antibody cocktail to SARS-CoV-2 spike protein prevents rapid mutational escape seen with individual antibodies. Science 369, 1014–1018. - PMC - PubMed
    1. Bennett RS, Huzella LM, Jahrling PB, Bollinger L, Olinger GG Jr., and Hensley LE (2017). Nonhuman primate models of Ebola virus disease. Curr. Top. Microbiol. Immunol 411, 171–193. - PubMed
    1. Biasini M, Bienert S, Waterhouse A, Arnold K, Studer G, Schmidt T, Kiefer F, Gallo Cassarino T, Bertoni M, Bordoli L, et al. (2014). SWISS-MODEL: modelling protein tertiary and quaternary structure using evolutionary information. Nucleic Acids Res. 42, W252–258. - PMC - PubMed

Publication types

MeSH terms