. 2021 Nov 8;39(11):1497-1518.e11.
doi: 10.1016/j.ccell.2021.10.001. Epub 2021 Oct 28.

Determinants of anti-PD-1 response and resistance in clear cell renal cell carcinoma

Collaborators, Affiliations

Determinants of anti-PD-1 response and resistance in clear cell renal cell carcinoma

Lewis Au et al. Cancer Cell. .

Abstract

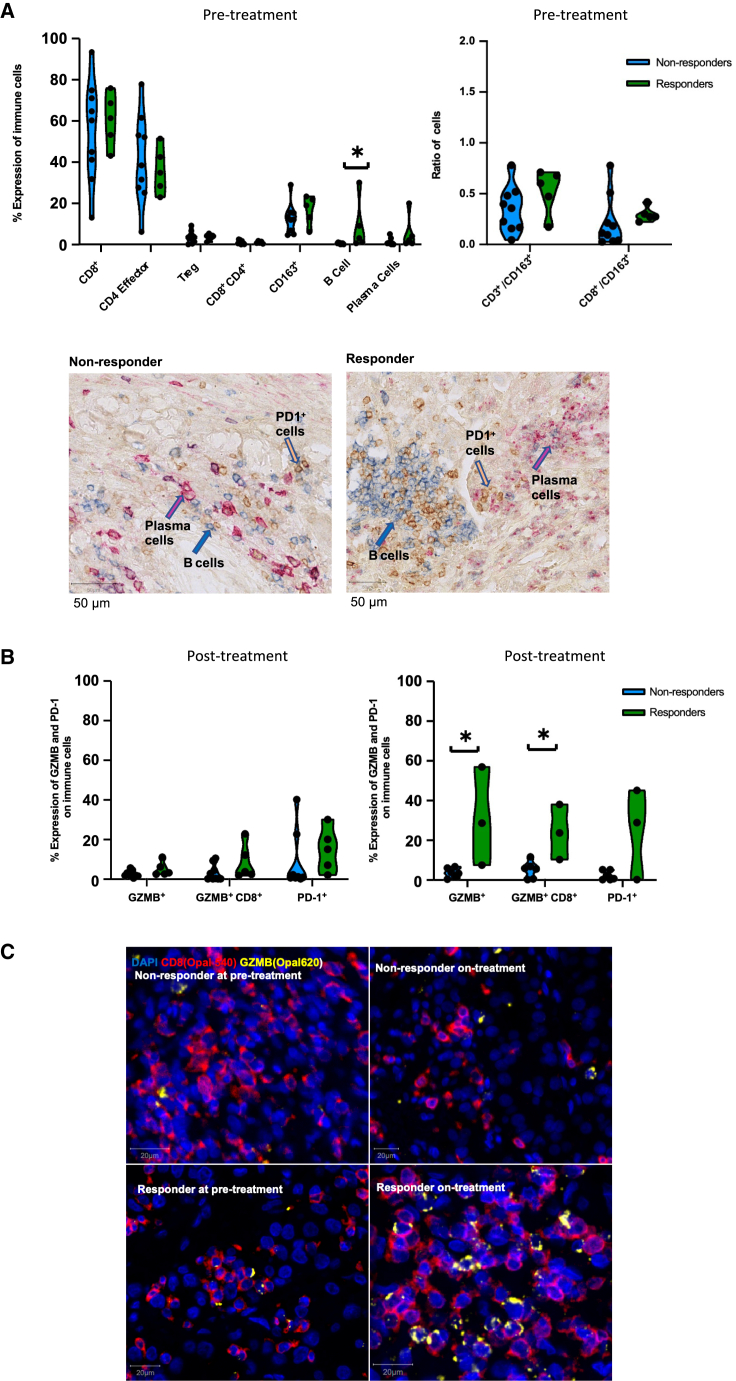
ADAPTeR is a prospective, phase II study of nivolumab (anti-PD-1) in 15 treatment-naive patients (115 multiregion tumor samples) with metastatic clear cell renal cell carcinoma (ccRCC) aiming to understand the mechanism underpinning therapeutic response. Genomic analyses show no correlation between tumor molecular features and response, whereas ccRCC-specific human endogenous retrovirus expression indirectly correlates with clinical response. T cell receptor (TCR) analysis reveals a significantly higher number of expanded TCR clones pre-treatment in responders suggesting pre-existing immunity. Maintenance of highly similar clusters of TCRs post-treatment predict response, suggesting ongoing antigen engagement and survival of families of T cells likely recognizing the same antigens. In responders, nivolumab-bound CD8+ T cells are expanded and express GZMK/B. Our data suggest nivolumab drives both maintenance and replacement of previously expanded T cell clones, but only maintenance correlates with response. We hypothesize that maintenance and boosting of a pre-existing response is a key element of anti-PD-1 mode of action.

Keywords: T cell receptor; TCR clonal maintenance; TCR clonal replacement; anti-PD-1; autopsy; clear cell renal cell carcinoma; human endogenous retrovirus; multiregion; nivolumab.


Conflict of interest statement

Declaration of interests L.A. is funded by the Royal Marsden Cancer Charity. E.H. and M.M. are funded by Cancer Research UK (CRUK). F.B. is funded by the Rosetrees Trust (M829). J.A. is a full-time employee of Hoffmann-La Roche AG (Basel, Switzerland). D.A.M has received consultancy fees from AstraZeneca, Thermo Fisher, and Eli Lilly. A.F. has received funding from the European Union’s Horizon 2020 research and innovation program under the Marie Skłodowska-Curie grant agreement No. 892360. L.P. has received research funding from Pierre Fabre, and honoraria from Pfizer, Ipsen, Bristol-Myers Squibb, and EUSA Pharma. R.S. has received non-financial support from Merck and Bristol Myers Squibb; research support from Merck, Puma Biotechnology, and Roche; and advisory board fees for Bristol Myers Squibb; and personal fees from Roche for an advisory board related to a trial-research project; all related to breast cancer research projects. R.S. reports no conflict of interests related to this project. M.J.H. is a Cancer Research UK (CRUK) Clinician Scientist (RCCFEL\100099) and has received funding from CRUK, National Institute for Health Research, Rosetrees Trust, UKI NETs and NIHR University College London Hospitals Biomedical Research Center. M.J.H. is a member of the Scientific Advisory Board and Steering Committee for Achilles Therapeutics. G.K. is a scientific co-founder of and consulting for Enara Bio and a member of its scientific advisory board. G.K. receives core funding from the Francis Crick Institute (FC0010099). B.C. is supported by a CRUK Project Grant. J.L. has received research funding from Bristol-Myers Squibb, Merck, Novartis, Pfizer, Achilles Therapeutics, Roche, Nektar Therapeutics, Covance, Immunocore, Pharmacyclics, and Aveo, and served as a consultant to Achilles, AstraZeneca, Boston Biomedical, Bristol-Myers Squibb, Eisai, EUSA Pharma, GlaxoSmithKline, Ipsen, Imugene, Incyte, iOnctura, Kymab, Merck Serono, Nektar, Novartis, Pierre Fabre, Pfizer, Roche Genentech, Secarna, and Vitaccess. C.S. acknowledges grant support from Pfizer, AstraZeneca, Bristol-Myers Squibb, Roche-Ventana, Boehringer-Ingelheim, Archer Dx Inc (collaboration in minimal residual disease sequencing technologies), and Ono Pharmaceutical, is an AstraZeneca Advisory Board member and Chief Investigator for the MeRmaiD1 clinical trial, has consulted for Pfizer, Novartis, GlaxoSmithKline, MSD, Bristol-Myers Squibb, Celgene, AstraZeneca, Illumina, Genentech, Roche-Ventana, GRAIL, Medicxi, Bicycle Therapeutics, and the Sarah Cannon Research Institute, has stock options in Apogen Biotechnologies, Epic Bioscience, GRAIL, and has stock options and is co-founder of Achilles Therapeutics. Patents: C.S. holds European patents relating to assay technology to detect tumor recurrence (PCT/GB2017/053289); to targeting neoantigens (PCT/EP2016/059401), identifying patent response to immune checkpoint blockade (PCT/EP2016/071471), determining HLA LOH (PCT/GB2018/052004), predicting survival rates of patients with cancer (PCT/GB2020/050221), identifying patients who respond to cancer treatment (PCT/GB2018/051912), a US patent relating to detecting tumor mutations (PCT/US2017/28013) and both a European and US patent related to identifying insertion/deletion mutation targets (PCT/GB2018/051892). C.S. is Royal Society Napier Research Professor (RP150154). His work is supported by the Francis Crick Institute, which receives its core funding from Cancer Research UK (FC001169), the UK Medical Research Council (FC001169), and the Wellcome Trust (FC001169). C.S. is funded by Cancer Research UK (TRACERx, PEACE and CRUK Cancer Immunotherapy Catalyst Network), Cancer Research UK Lung Cancer Center of Excellence, the Rosetrees Trust, Butterfield and Stoneygate Trusts, NovoNordisk Foundation (ID16584), Royal Society Research Professorship Enhancement Award (RP/EA/180007), the NIHR BRC at University College London Hospitals, the CRUK-UCL Center, Experimental Cancer Medicine Center and the Breast Cancer Research Foundation, USA (BCRF). His research is supported by a Stand Up To Cancer-LUNGevity-American Lung Association Lung Cancer Interception Dream Team Translational Research Grant (SU2C-AACR-DT23-17). Stand Up To Cancer is a program of the Entertainment Industry Foundation. Research grants are administered by the American Association for Cancer Research, the Scientific Partner of SU2C. C.S. also receives funding from the European Research Council (ERC) under the European Union’s Seventh Framework Program (FP7/2007-2013) Consolidator Grant (FP7-THESEUS-617844), European Commission ITN (FP7-PloidyNet 607722), an ERC Advanced Grant (PROTEUS) from the European Research Council under the European Union’s Horizon 2020 research and innovation program (835297), and Chromavision from the European Union’s Horizon 2020 research and innovation program (665233). S.A.Q. is a CRUK Senior Cancer Research Fellowship (C36463/A22246) and is funded by a CRUK Biotherapeutic Program Grant (C36463/A20764) and the Rosetrees and Stonygate Trusts (A1388) and a donation from the Khoo Teck Puat UK Foundation via the UCL Cancer Institute Research Trust (539288). S.T. is funded by Cancer Research UK (grant reference number C50947/A18176), the Francis Crick Institute, which receives its core funding from Cancer Research UK (FC0010988), the UK Medical Research Council (FC0010988), and the Wellcome Trust (FC0010988), the National Institute for Health Research (NIHR) Biomedical Research Center at the Royal Marsden Hospital and Institute of Cancer Research (grant reference number A109), the Royal Marsden Cancer Charity, The Rosetrees Trust (grant reference number A2204), Ventana Medical Systems Inc (grant reference numbers 10467 and 10530), the National Institutes of Health (Bethesda, MD) and Melanoma Research Alliance. ST has received speaking fees from Roche, Astra Zeneca, Novartis, and Ipsen. S.T. has the following patents filed: Indel mutations as a therapeutic target and predictive biomarker PCTGB2018/051892 and PCTGB2018/051893 and Clear Cell Renal Cell Carcinoma Biomarkers P113326GB.

Figures

None
Graphical abstract
Figure 1
Figure 1
Experimental workflow, patients and samples overview, and genomic characteristics of the ADAPTeR cohort (A) Overview of experimental workflow. The numbers (n) of patients contributing to sample collection at different timepoints are shown. (B) Heatmap of WES analysis demonstrating nsSNV and INDEL burden, somatic driver alterations annotated with pre/post-treatment, tumor site, IMDC risk category, and nivolumab response. Composite mutations are annotated with dual colors. Composite mutations (two or more non-synonymous somatic mutations in the same gene and tumor sample [Gorelick et al., 2020]) involving SETD2, KDM5C, and TSC2 are shown. Complex mutations in ADR002: PBRM1 frameshift insertion chr3:52584573:->T and non-frameshift deletion chr3:52584576:TAT>-; TP53 missense mutation chr17:7572969:A>T and frameshift insertion chr3:7572962:->CT. Denotes two distinct fsINDEL mutations in one tumor sample in ADR013. See also Figures S1, S2, Tables S1, and S2.
Figure 2
Figure 2
Expression of HERVs and LTR-overlapping transcripts in ccRCC according to tumor purity (A) Hierarchical clustering of patient samples according to the relative expression of HERVs previously associated with cytotoxic T cell presence, response to immunotherapy, or the provision of antigenic epitopes. (B) Hierarchical clustering patient samples according to the 12 LTR-overlapping transcripts that were differentially expressed (≥2-fold change, q ≤ 0.05) between responders and non-responders or affected by nivolumab. (C) Comparisons of tumor purity. Median values are shown; top whiskers indicate range from third quartile to maximum. ∗∗∗∗p < 0.0001; Mann-Whitney U test. (D) Distribution plot of significant Spearman’s rank-order correlation between tumor purity and TPM expression of the 12 HERVs differentially expressed between responders and non-responders. See also Figure S3 and Table S3.
Figure 3
Figure 3
GSEA and immune deconvolution by RNA-seq shows higher levels of immune infiltration and activation in responders compared with non-responders under nivolumab (A) Transcripts differentially regulated pre-treatment between responders and non-responders (n = 33 samples, 14 patients, negative binomial Wald test, Benjamini-Hochberg corrected p values). A total of 3,382 transcripts were differentially regulated (false discovery rate [FDR] <0.05); the ones that overlap with the Danaher immune score gene list are labeled. No differentially regulated genes were downregulated between response groups, hence the left side of the plot appears unannotated. (B) Heatmap showing the relative expression (Z scores) of genes from eight Danaher immune modules in pre-treatment samples. (C) Transcripts differentially regulated post-treatment between responders and non-responders (n = 27 samples, 10 patients, negative binomial Wald test, Benjamini-Hochberg corrected p values). A total of 7,975 transcripts were differentially regulated (FDR <0.05); the ones that overlap with the Danaher immune score gene list are labeled. No differentially regulated genes were downregulated between response groups, hence the left side of the plot appears unannotated. (D) Heatmap showing the relative expression (Z scores) of genes from eight Danaher immune modules in post-treatment samples. (E) GOBP pathway analysis of genes preferentially upregulated and downregulated pre-treatment in responders, Overlap (n), number of significant genes from a pathway (hypergeometric test). (F) Gene ontology biological process (GOBP) pathway analysis of genes preferentially upregulated and downregulated post-treatment in responders, Overlap (n), number of significant genes from a pathway (hypergeometric test). See also Figures S4 and S5.
Figure 4
Figure 4
Quantification and immunophenotyping of pre- and post-treatment infiltrating immune cells by IHC and mIF (A) Comparison of T cell subset (out of total T cells), CD163+ myeloid cells, B cell and plasma cell infiltration in treatment-naive samples in responders (n = 5) and non-responders (n = 9) is shown on the left. On the right is the ratio between CD3+ (total T cells) and CD163+ myeloid cells and CD8+ and CD163+ cells at baseline. B cell and plasma cell scoring was done by using IHC. Other markers were scored by using IF. IHC images of representative responder and non-responder patients pre-treatment showing B cell (blue), PD-1+ cells (yellow), and plasma cells (magenta) infiltration. (B) Level of overall GZMB, GZMB+CD8+, and overall PD-1 expression in responders and non-responders in treatment-naive and on-treatment samples is shown. PD-1 staining was performed with IHC. All other markers were stained with IF. (C) mIF images showing GZMB+CD8+ cells in a representative responder and non-responder patient at baseline and post-nivolumab treatment. Median values were used for each patient and a two-sided Mann-Whitney U statistical test was used for the analysis. p < 0.05. See also Figure S6.
Figure 5
Figure 5
TCR-seq demonstrates maintained clonal expansion through persistent antigenic stimulation associate with nivolumab response (A) The intratumoral and peripheral TCR repertoire clonality scores are shown for each patient at each time point. (B) The intratumoral TCR repertoire clonality scores pre-treatment are shown for each patient, categorized by response to nivolumab. Mixed-effect model p value shown. (C) Correlated clone sizes in tumor samples. Scatterplots of tumor clone size pre- and post-treatment are shown for all patients. Clones are colored by expansion/contraction status (STAR Methods). (D) The intratumoral similarity (cosine) scores between pre-treatment (red) and on-treatment (blue) are shown for each patient (n = 12). Patients are split between responders and non-responders. Responding patients exhibit greater cosine score, with the two-sided Mann-Whitney test p value shown. (E) The frequency distribution of the intratumoral expanded TCRs pre-treatment (red circles; n = 469 individual TCRs combined from 12 patients) and post-treatment (blue circles). Only TCRs that were detected post-treatment were included. (F) The clustering algorithm was run on all patients, and the pre-treatment normalized number of clusters for the networks containing expanded sequences is shown. Two-sided Mann-Whitney test p value shown; n = 14 patients. The minimum and maximum are indicated by the extreme points of the box plot; the median is indicated by the thick horizontal line; and the first and third quartiles are indicated by box edges. See also Figures S7–S9 and Table S4.
Figure 6
Figure 6
Nivolumab binding correlates with upregulation of T cell activation genes and clones expanded through persistent antigenic stimulation (A) GOBP pathway analysis of genes preferentially upregulated in drug-bound CD8+ cells in ADR001 (non-responder) and ADR013 (responder), circle size indicative of number of genes overlapping with GOBP term. (B) Uniform manifold approximation and projection (UMAP) of scRNA-seq data from non-responder and responder colored by frequency of clone. (C) Clonal proportion plot of CD8, CD4 effector, and Treg compartments in non-responder and responder. (D) Heatmaps showing top genes which positively correlated (Pearson’s correlation, CD8+ cells only) with TCR expansion in the responder. (E) Proportion of cells in each expansion class that are nivolumab-bound or unbound. (F) Representative network diagrams of post-treatment intratumoral CDR3 β-chain sequences for ADR001 and ADR013. Clustering was performed within the bulk TCR-seq data around expanded intratumoral TCRs, subdivided between clones that were expanded in the post-treatment repertoire exclusively (blue circles) and clones that were also expanded pre-treatment (orange circles). The network shows clusters for which at least one CDR3 was also detected in the scTCR repertoire. IgG4 negative clones that were detected in the scTCR repertoire but not expanded in the bulk TCR repertoire and are represented (yellow circle). The network was then split between clones that were mapping to a majority of IgG4 negative cells (top) or a majority of IgG4 positive cells (bottom) in the single-cell data. Clustering networks derived from bulk post-treatment tissue are shown (gray circles). See also Figures S10–S13 and Table S5.
Figure 7
Figure 7
Meta-analysis of scRNA/TCR-seq data across Braun et al., Krishna et al., Borcherding et al., and ADAPTeR cohorts (A) Uniform manifold approximation and projection (UMAP) of merged CD8+ (CD8+/CD4/FOXP3), CD4+ effector (CD8/CD4+/FOXP3), and Treg (CD8/FOXP3+) cells from four cohorts: Braun et al., Krishna et al., Borcherding et al., and ADAPTeR (ADR001 and ADR013), colored by cell types. (B) UMAP of scTCR-seq data of all cohorts colored by TCR expansions status (expanded or singleton clonotypes). Only CD8+ T cells are represented in color, NA denotes CD4+ T cells, Tregs, and unannotated CD8+ TCR clones (STAR Methods). (C) The TCR clonal expansion index is shown for each patient (median value of multiple regions for each patient where applicable). Patients are split between responders and non-responders of CPI treatment, or no CPI treatment. Disease stages (I–IV) are annotated. Only CD8+ T cell data are shown. Patient annotations from each cohort are: ADAPTeR – ADR013 (responder), ADR001 (non-responder); Brocherding et al. – GU0700, GU0744, GU0715; Braun et al. – S1, S2, S3, S5, S6, S7, S8, S11, S12, S14, S15, S16; Krishna et al. – t1, t2, t3, t4, UT1, UT2. Two-sided Mann-Whitney test p value shown; n = 23 patients. The minimum and maximum are indicated by the extreme points of the box plot; the median is indicated by the thick horizontal line; and the first and third quartiles are indicated by box edges. (D) Principal component analysis (PCA) analysis shows the differential gene expression pattern in expanded and non-expanded TCRs in CD8 cells based on CPI treatment and response status in the Braun et al., Krishna et al., Borcherding et al., and ADAPTeR cohorts. See also Figure S14.
Figure 8
Figure 8
Longitudinal profiling by bulk and single-cell RNA/TCR-seq reveal dynamic immune correlates of response and resistance to nivolumab. (1) Clonally expanded CD8+ T cells pre-treatment in ADR013 (responder). High TCR clonality. (2) Maintenance of pre-existing clonally expanded and expansion of novel CD8+ T cells under nivolumab. Drug-binding activates CD8+ T cells during therapy response. (3) Limited clonal expansion of CD8+ T cells pre-treatment in non-responders. Low TCR clonality. (4) Replacement of expanded CD8+ T cells under nivolumab. Drug-binding occurs on CD8+ T cells that lack a cytotoxic phenotype and tumor progression ensues.

Comment in

References

    1. Abou Alaiwi S., Nassar A.H., Xie W., Bakouny Z., Berchuck J.E., Braun D.A., Baca S.C., Nuzzo P.V., Flippot R., Mouhieddine T.H., et al. Mammalian SWI/SNF complex genomic alterations and immune checkpoint blockade in solid tumors. Cancer Immunol. Res. 2020;8:1075. - PMC - PubMed
    1. Aggen D.H., Drake C.G. Biomarkers for immunotherapy in bladder cancer: a moving target. J. Immunother. Cancer. 2017;5:94. - PMC - PubMed
    1. Albiges L., Powles T., Staehler M., Bensalah K., Giles R.H., Hora M., Kuczyk M.A., Lam T.B., Ljungberg B., Marconi L., Merseburger A.S. Updated European association of urology guidelines on renal cell carcinoma: immune checkpoint inhibition is the new backbone in first-line treatment of metastatic clear-cell renal cell carcinoma. Eur. Urol. 2019;76:151–156. - PubMed
    1. Alexandrov L.B., Nik-Zainal S., Wedge D.C., Aparicio S.A., Behjati S., Biankin A.V., Bignell G.R., Bolli N., Borg A., Borresen-Dale A.L., et al. Signatures of mutational processes in human cancer. Nature. 2013;500:415–421. - PMC - PubMed
    1. Altavilla G., Fassan M., Busatto G., Orsolan M., Giacomelli L. Microsatellite instability and hMLH1 and hMSH2 expression in renal tumors. Oncol. Rep. 2010;24:927–932. - PubMed

Publication types

MeSH terms

Supplementary concepts