Review
. 2021 Oct 29;22(1):301.
doi: 10.1186/s13059-021-02519-4.

Over 1000 tools reveal trends in the single-cell RNA-seq analysis landscape

Affiliations
Review

Over 1000 tools reveal trends in the single-cell RNA-seq analysis landscape

Luke Zappia et al. Genome Biol. .

Abstract

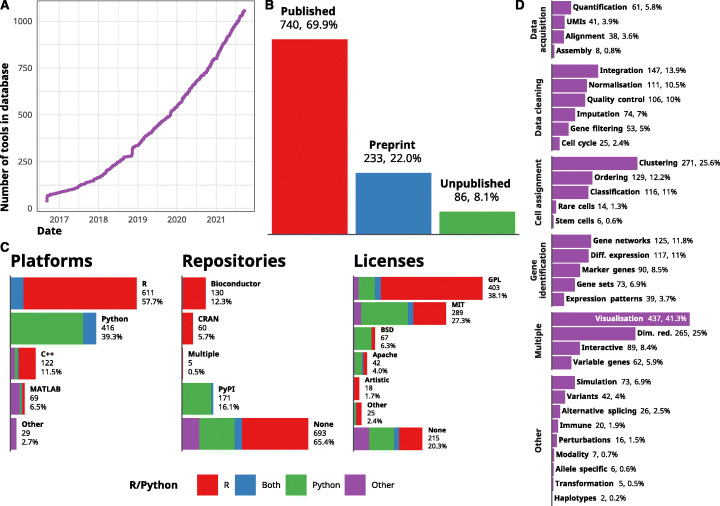
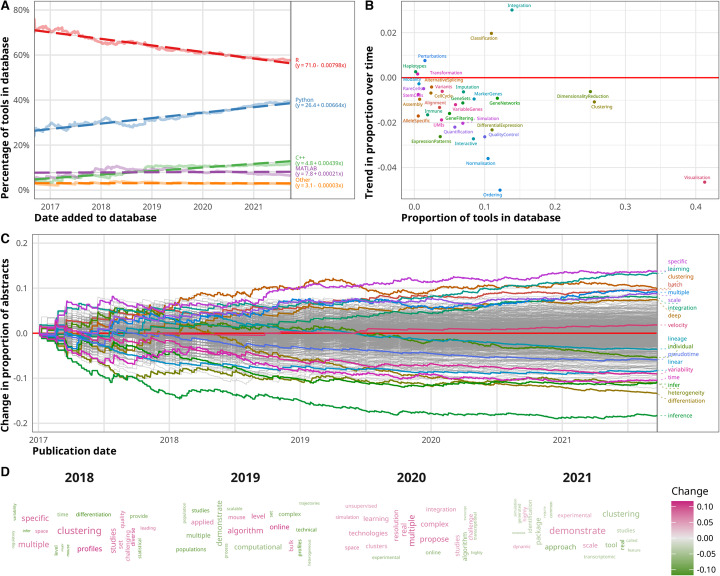
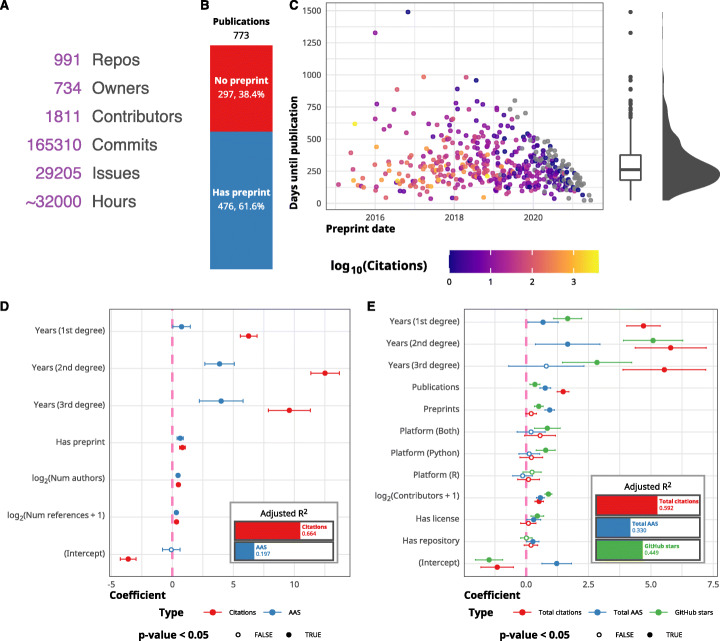
Recent years have seen a revolution in single-cell RNA-sequencing (scRNA-seq) technologies, datasets, and analysis methods. Since 2016, the scRNA-tools database has cataloged software tools for analyzing scRNA-seq data. With the number of tools in the database passing 1000, we provide an update on the state of the project and the field. This data shows the evolution of the field and a change of focus from ordering cells on continuous trajectories to integrating multiple samples and making use of reference datasets. We also find that open science practices reward developers with increased recognition and help accelerate the field.


Conflict of interest statement

FJT reports receiving consulting fees from ImmunAI and an ownership interest in Dermagnostix. The other author declares no competing interests.

Figures

Fig. 1
Fig. 1
Overview of the scRNA-tools database. A Line plot of the number of tools in the scRNA-tools database over time. The development of tools for analyzing scRNA-seq data has continued to accelerate with more than 1000 tools currently recorded. B Publication status of tools in the scRNA-tools database. Around 70% of tools have at least one peer-reviewed publication while more than 20% have an associated preprint. C Bar charts showing the distribution of platforms, software licenses, and software repositories for tools in the scRNA-tools database. Colors indicate proportions of tools using R or Python. D Bar chart showing the proportion of tools in the database assigned to each analysis category. Categories are grouped by broad phases of a standard scRNA-seq analysis workflow
Fig. 2
Fig. 2
Trends in scRNA-seq analysis tools. A Line plot of platform usage of tools in the scRNA-tools database over time. Python usage has increased over time while R usage has decreased. Darker dashed lines show linear fits with coefficients given in the legend. B Scatter plot of trends in scRNA-tools analysis categories over time. The current proportion of tools in the database is shown on the x-axis, and the trend in proportion change is shown on the y-axis. C Line plot of trend in word use in scRNA-seq analysis tool publication abstracts over time. Publication date is shown on the x-axis and change in the proportion of abstracts containing a word on the y-axis. Some important and highly variable terms are highlighted. D Word clouds of abstract terms by year. Word size indicates the proportion of abstracts that included the term in that year. The color of words shows the change in proportion compared to the previous year with pink indicating an increase and green indicating decreases. The 20 words with the greatest change in proportion are shown for each year
Fig. 3
Fig. 3
Open science in scRNA-seq tools development. A GitHub summary statistics for scRNA-seq tool repositories. B Stacked bar plot showing the proportion of publications with and without an associated preprint. C Scatter plot showing preprint date against the number of days until publication, colors indicate the number of citations (log scale). Box plot and density on the right show the distribution of time delay in publication. D Coefficients for log-linear models predicting citations and Altmetric Attention Score (AAS) for publications. Years since publication are modeled as a cubic spline with three degrees of freedom. Error bars show a 95% confidence interval. The inlaid bar chart shows the adjusted R2for each model. E Coefficients for log-linear models predicting total citations, total AAS, and GitHub stars for tools. Error bars show a 95% confidence interval. The inlaid bar chart shows the adjusted R2for each model

References

    1. Tang F, Barbacioru C, Wang Y, Nordman E, Lee C, Xu N, et al. mRNA-Seq whole-transcriptome analysis of a single cell. Nat Methods. 2009;6:377–382. doi: 10.1038/nmeth.1315. - DOI - PubMed
    1. Angerer P, Simon L, Tritschler S, Wolf FA, Fischer D, Theis FJ. Single cells make big data: new challenges and opportunities in transcriptomics. Curr Opin Syst Biol. 2017;4:85–91. doi: 10.1016/j.coisb.2017.07.004. - DOI
    1. Svensson V, Vento-Tormo R, Teichmann SA. Exponential scaling of single-cell RNA-seq in the past decade. Nat Protoc. 2018;13:599. doi: 10.1038/nprot.2017.149. - DOI - PubMed
    1. Cusanovich DA, Daza R, Adey A, Pliner HA, Christiansen L, Gunderson KL, et al. Multiplex single cell profiling of chromatin accessibility by combinatorial cellular indexing. Science. 2015;348:910–914. doi: 10.1126/science.aab1601. - DOI - PMC - PubMed
    1. Buenrostro JD, Wu B, Litzenburger UM, Ruff D, Gonzales ML, Snyder MP, et al. Single-cell chromatin accessibility reveals principles of regulatory variation. Nature. 2015;523:486–490. doi: 10.1038/nature14590. - DOI - PMC - PubMed

Publication types

LinkOut - more resources