. 2021 Oct;9(10):e003163.
doi: 10.1136/jitc-2021-003163.

Anti-GD2 IgA kills tumors by neutrophils without antibody-associated pain in the preclinical treatment of high-risk neuroblastoma

Affiliations

Anti-GD2 IgA kills tumors by neutrophils without antibody-associated pain in the preclinical treatment of high-risk neuroblastoma

Mitchell Evers et al. J Immunother Cancer. 2021 Oct.

Abstract

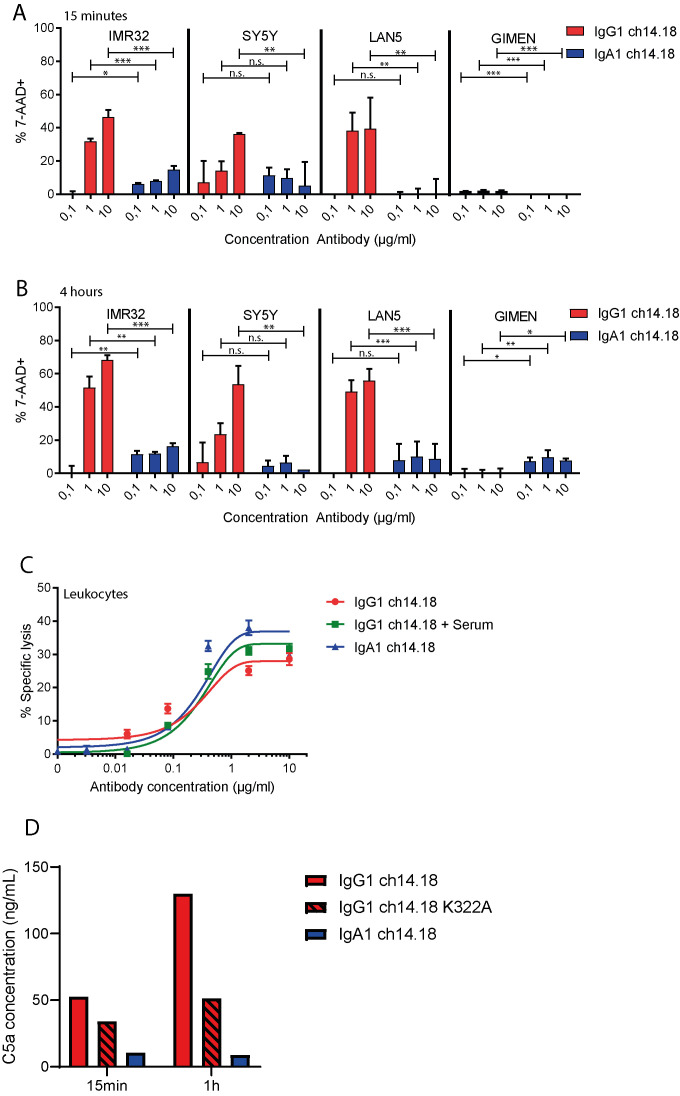
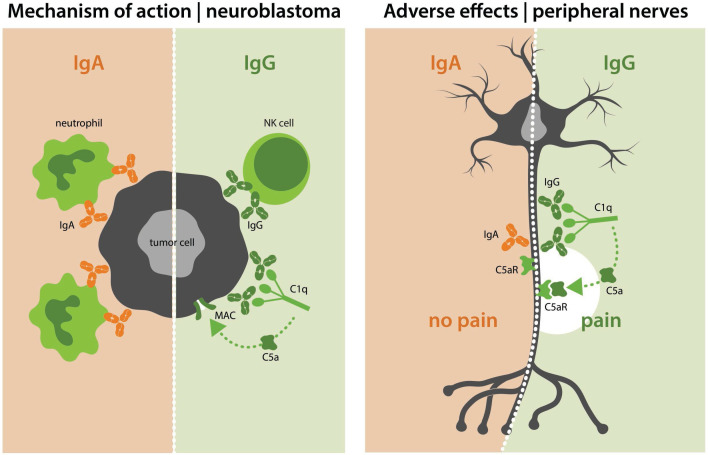
Background: The addition of monoclonal antibody therapy against GD2 to the treatment of high-risk neuroblastoma led to improved responses in patients. Nevertheless, administration of GD2 antibodies against neuroblastoma is associated with therapy-limiting neuropathic pain. This severe pain is evoked at least partially through complement activation on GD2-expressing sensory neurons.

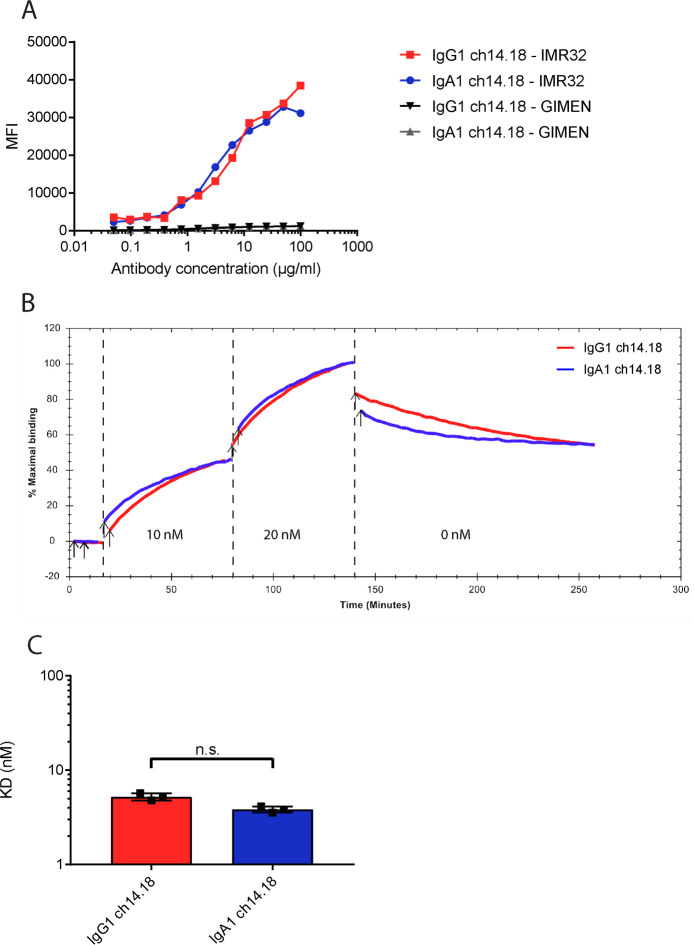
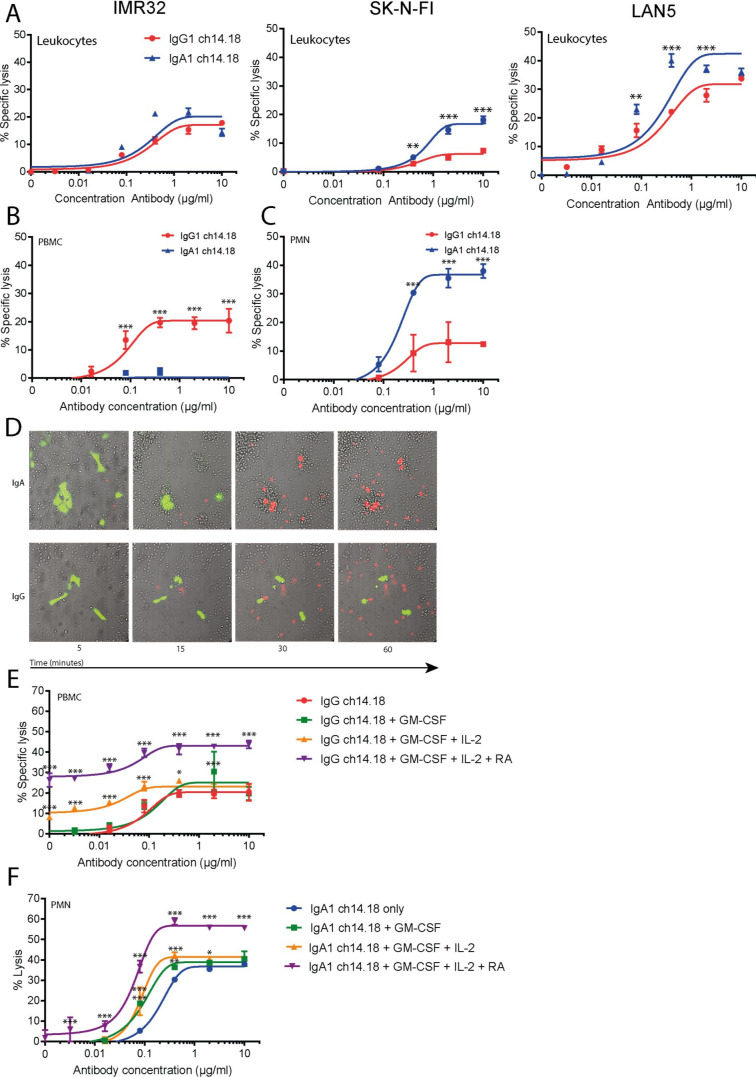
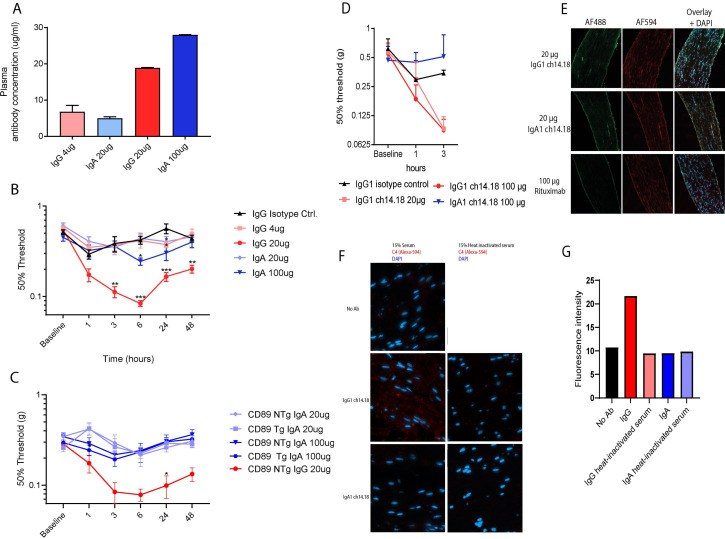
Methods: To reduce pain while maintaining antitumor activity, we have reformatted the approved GD2 antibody ch14.18 into the IgA1 isotype. This novel reformatted IgA is unable to activate the complement system but efficiently activates leukocytes through the FcαRI (CD89).

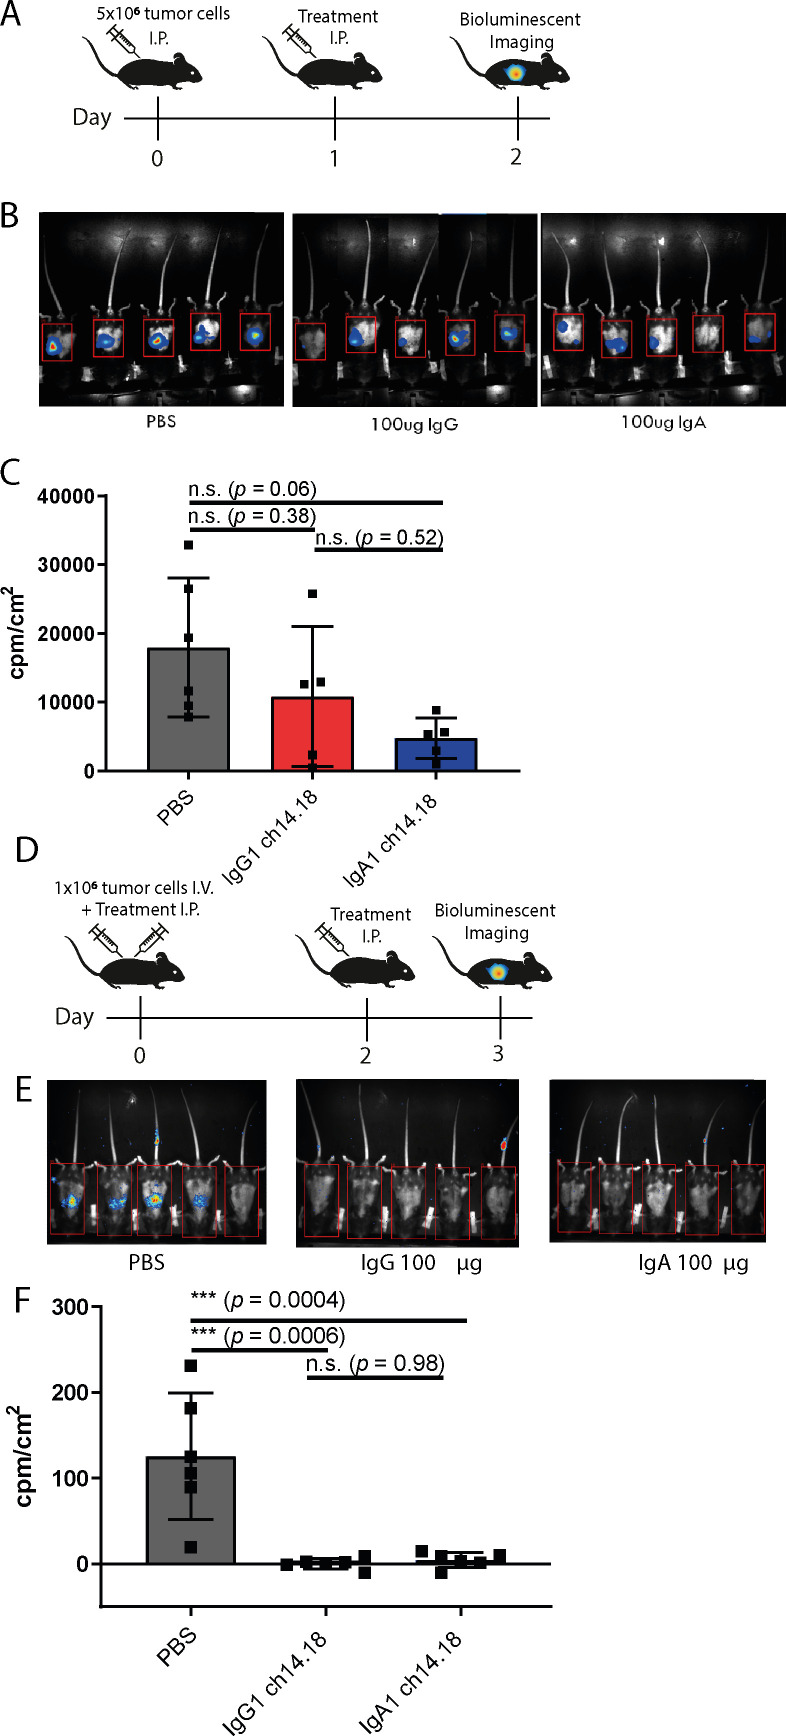
Results: IgA GD2 did not activate the complement system in vitro nor induced pain in mice. Importantly, neutrophil-mediated killing of neuroblastoma cells is enhanced with IgA in comparison to IgG, resulting in efficient tumoricidal capacity of the antibody in vitro and in vivo.

Conclusions: Our results indicate that employing IgA GD2 as a novel isotype has two major benefits: it halts antibody-induced excruciating pain and improves neutrophil-mediated lysis of neuroblastoma. Thus, we postulate that patients with high-risk neuroblastoma would strongly benefit from IgA GD2 therapy.

Keywords: immunotherapy; neuroblastoma; pain; pediatrics.


Conflict of interest statement

Competing interests: JL is co-founder of TigaTx and ME is employed by TigaTx.

Figures

Figure 1
Figure 1
Binding of IgG1 and IgA1 ch14.18 antibodies to neuroblastoma cell lines. (A) Flow cytometric assessment of antibody binding of IgA1-FITC and IgG1-FITC ch14.18 to GD2-expressing neuroblastoma cell line IMR-32 and GD2-negative cell line GI-ME-N. (B) Real-time cell-based affinity measurement of FITC-labeled IgA1 and IgG1 ch14.18 on IMR-32 cells. IMR-32 cell lines were treated with 10 nM of antibody. Subsequently, antibody concentration was increased to 20 nM of antibody. Dissociation was followed for 2 hours. The traces show the fluorescent signal of three individual measurements per antibody (IgG1 in red, IgA1 in blue,). (C) Calculated affinities from cell-based affinity measurements shown in B using one-to-one fitting. Data show mean affinity ±SD (n=3, technical triplicate). MFI, mean fluorescent intensity; FITC, fluorescein isothiocyanate; n.s., no statistical significance.
Figure 2
Figure 2
Induction of ADCC by IgA1 and IgG1 ch14.18 against neuroblastoma cell lines. (A) ADCC assays with IgA1 and IgG1 ch14.18 on three different neuroblastoma cell lines with leukocytes from blood as effector cells. (B) ADCC assays with IgG1 and IgA1 ch14.18 on neuroblastoma cell line IMR-32 with isolated PBMCs (E:T ratio of 100:1) as effector cells. (C) ADCC assays with IgG1 and IgA1 ch14.18 on IMR-32 neuroblastoma cell line with isolated neutrophils (E:T ratio of 40:1) as effector cells. (D) Live-cell imaging of PMN-mediated ADCC. Calcein-AM labeled IMR-32 cells (Green) were treated with 10 µg/mL IgG1 ch14.18 or IgA ch14.18. eFluor450-labeled PMNs were added at an 83:1 E:T ratio to tumor cells. Cell death was visualized with TO-PRO-3 (Red). (E) ADCC assays with IgG1 ch14.18 on IMR-32 neuroblastoma cell line with isolated PBMCs (E:T ratio of 100:1) as effector cells with or without co-treatment of GM-CSF, IL-2 and 11-cis retinoic acid. (F) ADCC assays as in (E) with IgA1 ch14.18 with isolated neutrophils (E:T ratio of 40:1) as effector cells. All ADCC assays were incubated for 4 hours at 37°C. Data represent mean lysis of a representative donor ±SD (technical triplicate at least n=3 donors per assay). Statistical significance was determined by two-way analysis of variance. ADCC, antibody-dependent cell-mediated cytotoxicity; E:T, effector-to-target; IL, interleukin; RA, 11-cis retinoic acid; GM-CSF, granulocyte-macrophage colony-stimulating factor; PMN, polymorphonuclear cells; PBMC, peripheral blood mononuclear cells.
Figure 3
Figure 3
Complement assays on a panel of neuroblastoma cell lines by IgG1 and IgA1 ch14.18 antibodies. (A) Lysis by IgG1 or IgA1 ch14.18 antibodies on four different neuroblastoma cell lines. Cells were incubated with three different concentrations of antibody for 30 min and subsequently with 15% pooled human serum for 15 min. Data represents mean percentage of 7-AAD+cells ± SD (n=3). (B) Lysis by IgG1 or IgA1 ch14.18 antibodies on four different neuroblastoma cell lines. Cells were incubated with three different concentrations of antibody for 30 min and subsequently with 15% pooled human serum for 4 hours. Data represents mean percentage of 7-AAD+cells±SD (n=3). Statistical significance was determined by two-way analysis of variance. (C) ADCC assays with IgA1 ch14.18 or IgG1 ch14.18 with or without 15% serum on IMR-32 neuroblastoma cell line and with leukocytes from peripheral blood as effector cells. Data represent mean±SD. (D) C5a quantification in pooled human serum after incubation with plate-bound antibody for 15 min, or 60 min. Data show a representative example (n=3).
Figure 4
Figure 4
In vivo efficacy of IgG1 and IgA1 ch14.18 antibodies. (A) Graphical representation of treatment schedule of mice used in short IP model. (B) Bioluminescent imaging of EL4-Luc2 tumor cells after 24 hours of treatment with PBS, IgA1 or IgG1 ch14.18. (C) Quantification of bioluminescent signal in B. Data represents mean counts/cm2—background ±SD of at least five mice. Statistical significance was determined by one-way analysis of variance (ANOVA) with Tukey’s post-hoc correction. (D) Graphical representation of treatment schedule of mice used in i.v. model. (E) Bioluminescent imaging of EL4-Luc2 tumor cells on day 3 of treatment after i.v. injection of tumor cells. (F) Quantification of bioluminescent signal after 3 days of treatment. Data represents mean counts/cm2—background ±SD of six mice per group. Statistical significance was determined by one-way ANOVA. i.p., intraperitoneally; i.v., PBS, phosphate-buffered saline; n.s., no statistical significance.
Figure 5
Figure 5
Neuronal exposure of to IgA1 does not lead to decreases in mechanical withdrawal thresholds nor C4 deposition. (A) Plasma concentrations of IgA1 and IgG1 ch14.18 3 hours after i.v. injection determined by ELISA. Data represents mean antibody concentration in µg/ml±SD of at least two mice per group. (B) Course of mechanical sensitivity as determined with von Frey test over time after i.v. injection of IgA1 or IgG1 ch14.18. Data represents mean 50% withdrawal thresholds±SEM of at least eight mice per group. Statistical significance was determined by repeated measures analysis of variance (ANOVA) followed by Sidak’s post-hoc analyses. (C) Von-Frey withdrawal thresholds over time after i.v. injection of IgA1 or IgG1 ch14.18 in mice expressing FcαR (CD89 Tg) or control littermate (NTg) mice. Data represents mean withdrawal thresholds±SEM of at least five mice per group pooled from separate experiments. Statistical significance was determined by repeated repeated-measures ANOVA followed by Sidak’s post-hoc analyses. (D) Mechanical sensitivity as determined with von Frey test over time after i.v. injection of IgA1-AF488 or IgG1-AF488 ch14.18. Data represents mean withdrawal thresholds±SEM of at least two mice per group. (E) Left column: Visualization of intravenously injected Alexa-488 labeled GD2 antibodies on sciatic nerves. Middle column: Visualization of ex-vivo staining of GD2 by incubation of sciatic nerve slides with Alexa-549 labeled IgG1 ch14.18. Right column: Overlay (F) Visualization of ex vivo C4 fixation on sciatic nerves by IgG1 and IgA1 ch14.18 with complement active or heat-inactivated mouse serum. (G) Quantification of C4 deposition from F. i.v., intravenously.
Figure 6
Figure 6
Summarizing figure. The left side of the figure shows the mechanism of action of IgA and IgG antibodies against GD2. IgA antibodies mediate killing of neuroblastoma cells with neutrophils as effector cells, while IgG antibodies do so via NK cells and CDC. On the right side of the figure, effects on GD2-expressing peripheral neurons are shown. Here, IgG activates the complement system, leading to pain. In contrast, IgA does not. CDC, complement-dependent cytotoxicity; NK, natural killer.

References

    1. Maris JM. Recent advances in neuroblastoma. N Engl J Med 2010;362:2202–11. 10.1056/NEJMra0804577 - DOI - PMC - PubMed
    1. Yu AL, Gilman AL, Ozkaynak MF, et al. . Anti-GD2 antibody with GM-CSF, interleukin-2, and isotretinoin for neuroblastoma. N Engl J Med 2010;363:1324–34. 10.1056/NEJMoa0911123 - DOI - PMC - PubMed
    1. Armideo E, Callahan C, Madonia L. Immunotherapy for high-risk neuroblastoma: management of side effects and complications. J Adv Pract Oncol 2017;8:44–55. 10.6004/jadpro.2017.8.1.4 - DOI - PMC - PubMed
    1. Bertolizio G, Otis A, Tam K, et al. . Multimodal analgesic plan for children undergoing chimeric 14.18 immunotherapy. J Pediatr Hematol Oncol 2021;43:e169–72. 10.1097/MPH.0000000000001722 - DOI - PubMed
    1. Gilman AL, Ozkaynak MF, Matthay KK, et al. . Phase I study of ch14.18 with granulocyte-macrophage colony-stimulating factor and interleukin-2 in children with neuroblastoma after autologous bone marrow transplantation or stem-cell rescue: a report from the Children’s Oncology Group. J Clin Oncol 2009;27:85–91. 10.1200/JCO.2006.10.3564 - DOI - PMC - PubMed

Publication types