. 2021 Nov 2;118(44):e2103104118.
doi: 10.1073/pnas.2103104118.

Power spectra reveal distinct BOLD resting-state time courses in white matter

Affiliations

Power spectra reveal distinct BOLD resting-state time courses in white matter

Muwei Li et al. Proc Natl Acad Sci U S A. .

Abstract

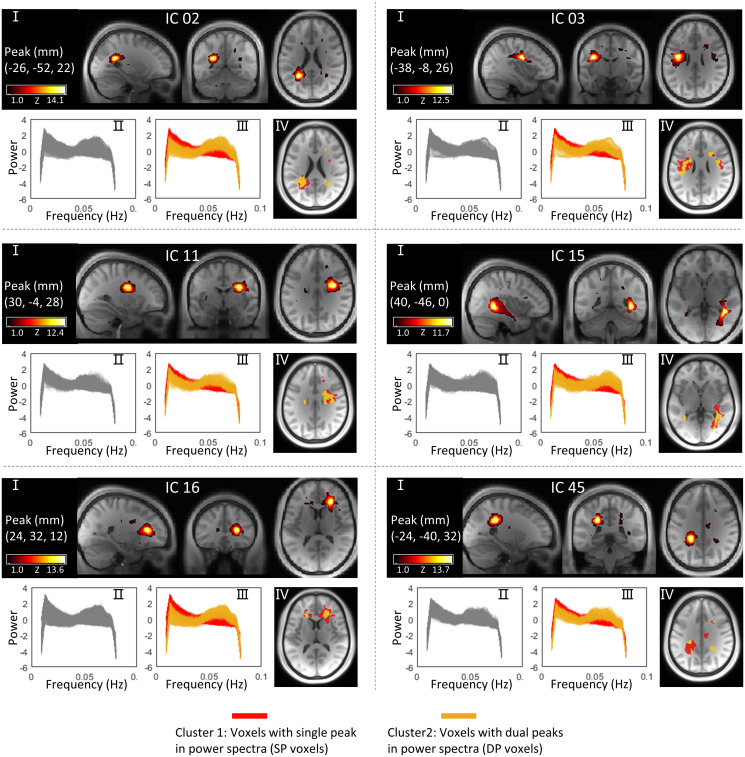
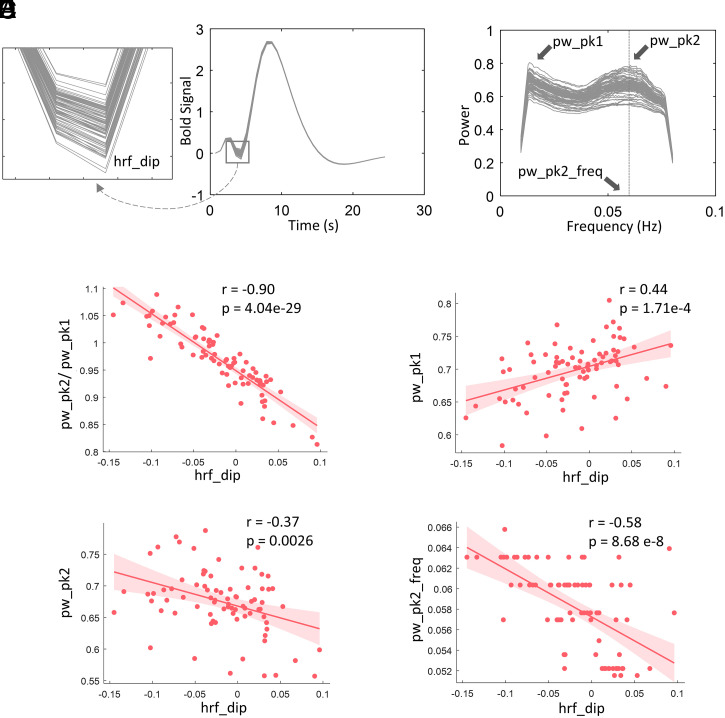
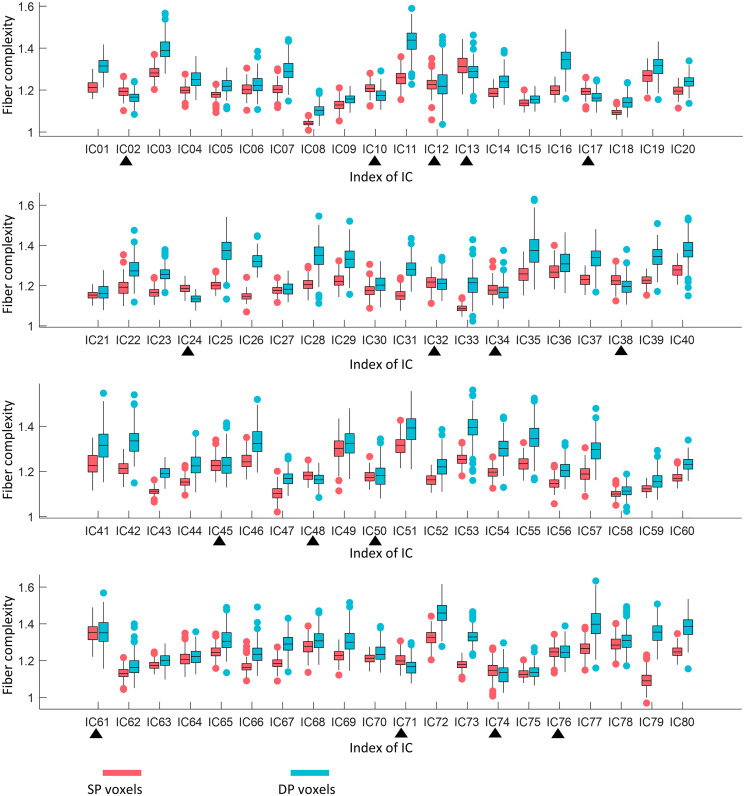
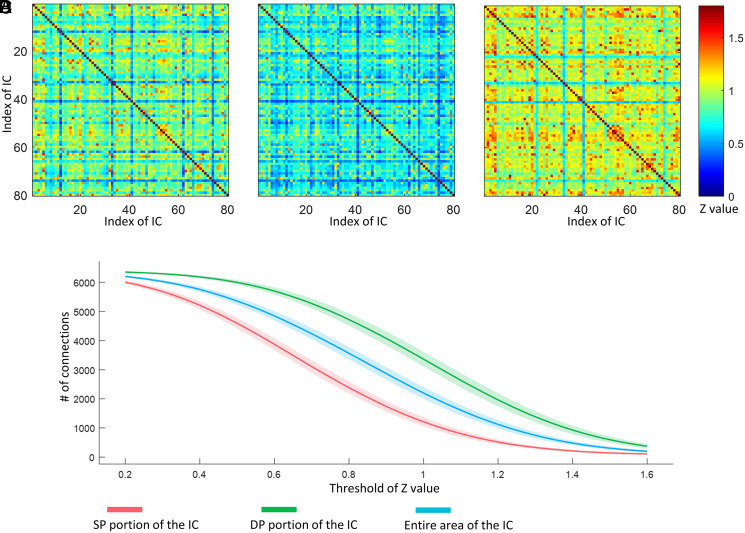
Accurate characterization of the time courses of blood-oxygen-level-dependent (BOLD) signal changes is crucial for the analysis and interpretation of functional MRI data. While several studies have shown that white matter (WM) exhibits distinct BOLD responses evoked by tasks, there have been no comprehensive investigations into the time courses of spontaneous signal fluctuations in WM. We measured the power spectra of the resting-state time courses in a set of regions within WM identified as showing synchronous signals using independent components analysis. In each component, a clear separation between voxels into two categories was evident, based on their power spectra: one group exhibited a single peak, and the other had an additional peak at a higher frequency. Their groupings are location specific, and their distributions reflect unique neurovascular and anatomical configurations. Importantly, the two categories of voxels differed in their engagement in functional integration, revealed by differences in the number of interregional connections based on the two categories separately. Taken together, these findings suggest WM signals are heterogeneous in nature and depend on local structural-vascular-functional associations.

Keywords: fMRI; power spectra; resting state; white matter.


Conflict of interest statement

The authors declare no competing interest.

Figures

Fig. 1.
Fig. 1.
Spatial distributions of selected WM ICs and their power spectra patterns. For each panel, I is a visualization of the WM IC in three orthogonal planes, and II is power spectra of the voxels within the IC. Each line represents the mean power spectra over 199 subjects at the same voxel. (III) Two clusters of voxels (SP voxels and DP voxels) that exhibit distinct patterns of power spectra within the IC. (IV) Spatial distributions of SP voxels and DP voxels in different colors.
Fig. 2.
Fig. 2.
The relationship between HRFs and power spectral in DP voxels across 80 WM ICs. (A) Estimated HRFs of 80 WM ICs. (B) Power spectra of 80 WM ICs. (C) Correlation between the dips of HRFs and the ratio the two peaks in power spectra across 80 WM ICs. (D) Correlation between the dips of HRFs and the magnitudes of first peaks in power spectra across 80 WM ICs. (E) Correlation between the dips of HRFs and the magnitudes of second peaks in power spectra across 80 WM ICs. (F) Correlation between the dips of HRFs and the coordinates of second peaks on frequency band across 80 WM ICs. The solid lines and shaded areas plot the linear fits of the data with associated CI (95%). The P values were corrected for multiple comparison using Bonferroni method.
Fig. 3.
Fig. 3.
Comparison of fiber complexity between SP and DP areas in 80 WM ICs. A total of 64 out of 80 ICs show significantly higher fiber complexity in DP area than in SP area. Black triangles indicate nonsignificant (paired-sample t test, P > 0.05, Bonferroni corrected) differences or higher complexity in the SP area. Each box plots the median (center line), the first quartile (lower boundary), and third quartile (upper boundary) of the data. The red and blue scatters indicate the outliers.
Fig. 4.
Fig. 4.
Comparison of FC matrix reconstructed by (A) entire areas of ICs, (B) SP portions of ICs, and (C) DP portions of ICs. (D) Number of connections when applying a different threshold to the FC matrix regarding 199 subjects. The solid lines and shaded areas plot the mean of the data with associated CI (95%).

References

    1. Ogawa S., et al. ., Intrinsic signal changes accompanying sensory stimulation: Functional brain mapping with magnetic resonance imaging. Proc. Natl. Acad. Sci. U.S.A. 89, 5951–5955 (1992). - PMC - PubMed
    1. Biswal B., Yetkin F. Z., Haughton V. M., Hyde J. S., Functional connectivity in the motor cortex of resting human brain using echo-planar MRI. Magn. Reson. Med. 34, 537–541 (1995). - PubMed
    1. Fox M. D., Raichle M. E., Spontaneous fluctuations in brain activity observed with functional magnetic resonance imaging. Nat. Rev. Neurosci. 8, 700–711 (2007). - PubMed
    1. Raichle M. E., et al. ., A default mode of brain function. Proc. Natl. Acad. Sci. U.S.A 98, 676–682 (2001). - PMC - PubMed
    1. Behzadi Y., Restom K., Liau J., Liu T. T., A component based noise correction method (CompCor) for BOLD and perfusion based fMRI. Neuroimage 37, 90–101 (2007). - PMC - PubMed

Publication types

LinkOut - more resources