. 2021 Oct 29;12(1):6260.
doi: 10.1038/s41467-021-26491-6.

3D printed biomimetic cochleae and machine learning co-modelling provides clinical informatics for cochlear implant patients

Affiliations

3D printed biomimetic cochleae and machine learning co-modelling provides clinical informatics for cochlear implant patients

Iek Man Lei et al. Nat Commun. .

Abstract

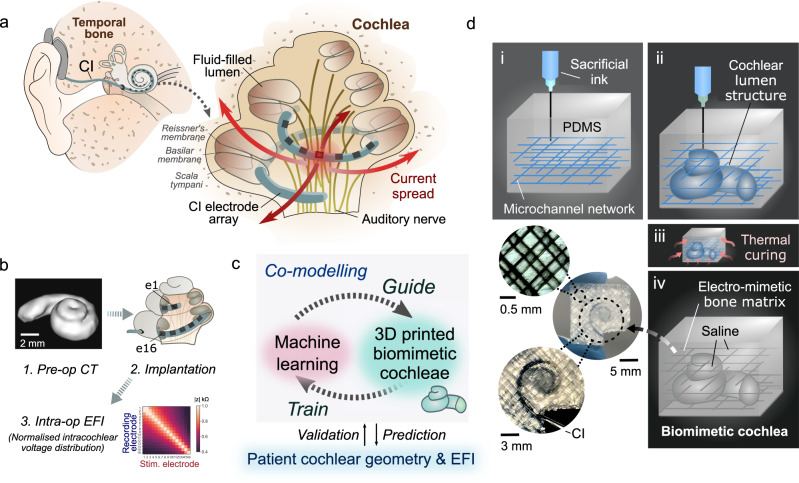
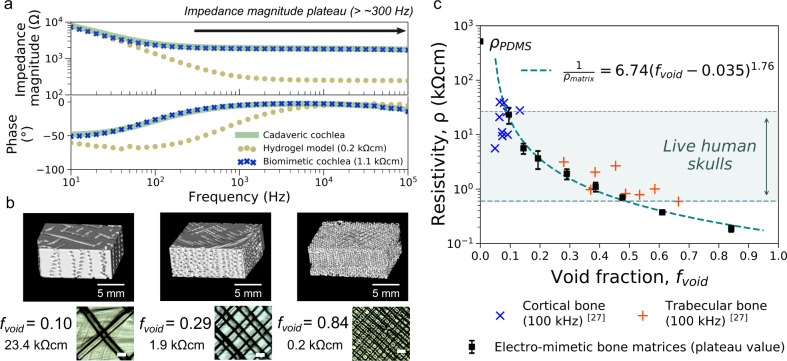
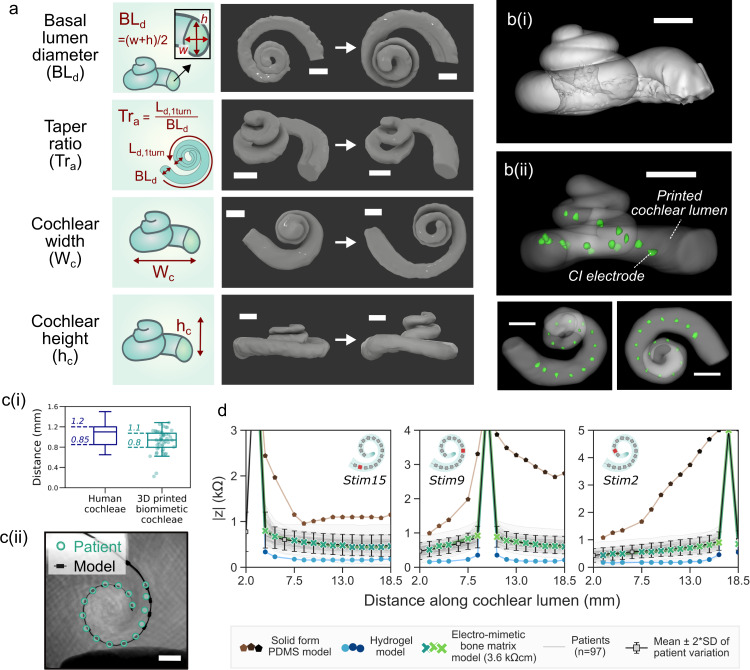
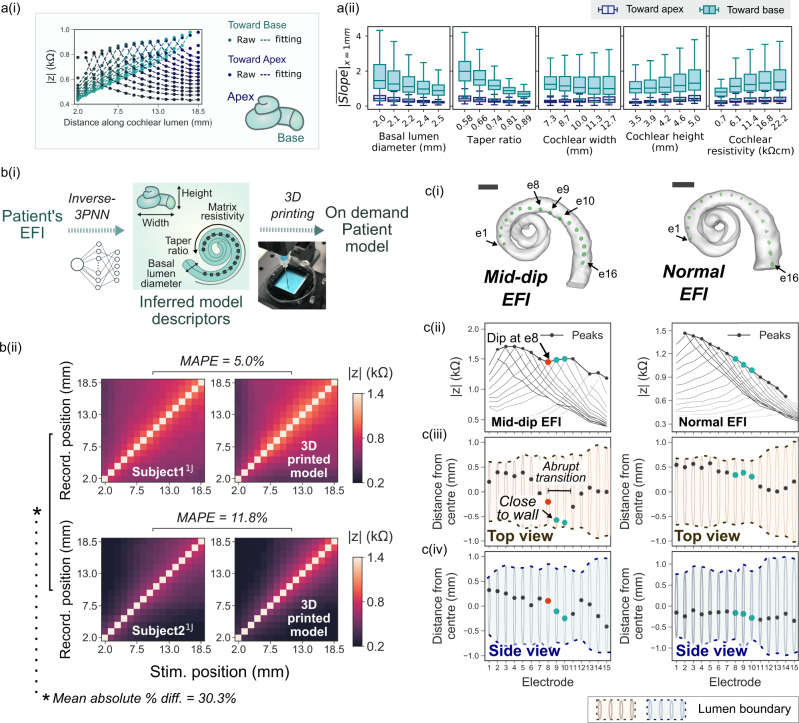
Cochlear implants restore hearing in patients with severe to profound deafness by delivering electrical stimuli inside the cochlea. Understanding stimulus current spread, and how it correlates to patient-dependent factors, is hampered by the poor accessibility of the inner ear and by the lack of clinically-relevant in vitro, in vivo or in silico models. Here, we present 3D printing-neural network co-modelling for interpreting electric field imaging profiles of cochlear implant patients. With tuneable electro-anatomy, the 3D printed cochleae can replicate clinical scenarios of electric field imaging profiles at the off-stimuli positions. The co-modelling framework demonstrated autonomous and robust predictions of patient profiles or cochlear geometry, unfolded the electro-anatomical factors causing current spread, assisted on-demand printing for implant testing, and inferred patients' in vivo cochlear tissue resistivity (estimated mean = 6.6 kΩcm). We anticipate our framework will facilitate physical modelling and digital twin innovations for neuromodulation implants.


Conflict of interest statement

M.B. received research funding from Advanced Bionics®, Cochlear Corporation® and in-kind contributions from MED-EL® on other research areas but not on the present study. The remaining authors declare no competing interests.

Figures

Fig. 1
Fig. 1. 3PNN co-modelling approach with embedded 3D printing of biomimetic cochleae for reproducing the CI stimulus spread characteristics.
a Schematic of the auditory system and the cochlea with a CI implanted. The ‘current spread’ problem induced by a stimulating electrode of the CI electrode array is indicated. b Schematic of the routine CI assessment process; 1. Preoperative CT scan of a patient’s cochlea, which typically only has sufficient resolution to reveal the ensemble spiral-shaped cavity of a cochlea; 2. Implantation of the electrode array of a CI in the scala tympani of the cochlea; 3. Acquisition of an intra-operative EFI (electric field imaging) profile from a patient, which is derived from recording the induced intracochlear voltage V measured at each electrode upon injecting consecutive current pulses at each electrode in the array. The voltage measurements are then converted to transimpedance magnitude |z| by normalising the voltage V with the stimulation current impulse Istim (|z| = V/Istim). The off-stimulation (off-diagonal) measurements in the EFI present information about the tissue impedance. c Overview of the 3PNN co-modelling framework for providing clinical informatics. d Schematic of the embedded 3D printing strategy to produce the electro-mimetic bone matrices and the biomimetic cochleae.
Fig. 2
Fig. 2. Electrical properties of electro-mimetic bone matrices.
a Bode plot showing the impedance properties of a cadaveric cochlea in a human head, and 3D printed cochlear models made of an electro-mimetic bone matrix and a hydrogel. The frequency range associated with the impedance magnitude plateau is indicated. b µ-CT reconstructed images (top) and optical microscopic images (bottom) of the electro-mimetic bone matrices at different volumetric void fractions (fvoid). Scale bar of the optical microscopic images = 500 µm. The resistivities of the matrices were determined from their plateau impedance magnitude and the size of the samples. n = 3 independent samples. c Resistivity of the electro-mimetic bone matrices (plateau value, n = 3 independent samples) as a function of fvoid, compared to the reported resistivities of bovine cortical and trabecular bones. The relationship between the resistivity of the electro-mimetic bone matrix and fvoid is well-described by a percolation equation of a conductor-insulator composite (Supplementary Fig. 3e). Data were presented as mean values ± SD.
Fig. 3
Fig. 3. Wide resistivity tuneability and adequate mechanical properties of electro-mimetic bone matrices.
A map of resistivity versus Young’s modulus of human tissues, thermoplastics, the hydrogel-fillers matrices and the electro-mimetic bone matrices (plateau values) was tested in this study (n = 3 independent samples). The compositions of the hydrogel and hydrogel-fillers matrices tested here are listed in Supplementary Fig. 5a. Young’s modulus of the electro-mimetic bone matrix was estimated by scaling Young’s modulus of pure PDMS (1.7 MPa at a curing temperature of 60 °C) linearly with the fvoid of the matrix. Tissues and thermoplastics data and Young’s modulus of hydrogels were compiled from literature–,–. Data of the electro-mimetic bone matrices are presented as mean values ± SD.
Fig. 4
Fig. 4. 3D printed biomimetic cochleae replicate the broad anatomical spectrum of human cochleae, enable geometrically-guided CI positioning and give patient-relevant EFI profiles.
a µ-CT reconstructed images of the spiral lumen of the biomimetic cochlea with different geometric features. Scale bar = 2 mm. Four geometric descriptors are used—basal lumen diameter, taper ratio, cochlear width and cochlear height. Detailed definitions and the range of the descriptors tested in this study can be found in Supplementary Table 1. b µ-CT reconstructed images of (i) a cadaveric cochlea and (ii) the lumen of an exemplar 3D printed biomimetic cochlea with CI electrode array (marked green) implanted. Scale bar = 2 mm. c(i) The electrode-to-spiral centre distance (n = 48) of the biomimetic cochleae, compared to the electrode-to-modiolus distance of human cochleae with the same CI electrode type implanted (HiFocusTM 1 J electrode array), replotted from literature. c(ii) Example showing overlapped CT and x-ray images of the CI electrode positions in a patient’s cochlea and in a biomimetic cochlea that has similar geometric descriptors to the patient (n = 3, Supplementary Fig. 7b). Scale bar = 2 mm. d Comparison of the mean patient EFI profile (n = 97), and the EFI profiles obtained from 3D printed models made of hydrogel, solid PDMS and electro-mimetic bone matrix (3.6 kΩcm). The mean patient EFI was derived from 97 clinical EFIs that are not paired with CT information (with 91 independently acquired by Advanced Bionics® and six acquired by CI1J from our own repository), on the assumption that the insertion depths follow the suggested insertion depth of CI1J. EFIs induced by the stimulations of the basal electrode (electrode 15), the medial electrode (electrode 9) and the apical electrode (electrode 2) were shown.
Fig. 5
Fig. 5. Clinical validation of 3PNN.
a Schematic of the workflow of 3PNN. 3PNN was developed by training a neural network machine learning algorithm with the EFI profiles acquired from the 3D printed biomimetic cochleae. 3PNN maps the correlation between the five model descriptors and the most probable EFI profile as a function of CI electrode position. The hyperparameters of 3PNN were tuned using tenfold cross-validation to achieve the best predictive performance (Supplementary Fig. 9). b Validation of forward-3PNN for predicting patient off-stimulation EFIs (matrix resistivity input = 9.3 kΩcm). (i) Representative off-stimulation EFI predictions for different CI electrode types, as compared to the corresponding clinical patient data; and (ii) boxplots summarising the overall performance of forward-3PNN, with the median MAPE of each CI electrode type indicated on the figure. Full validation results can be found in Supplementary Fig. 11. c Overall performance of inverse-3PNN for inferring the patients’ cochlear geometric descriptors for different CI electrode types, with the median MAPE stated for each descriptor. Full validation results of inverse-3PNN can be found in Supplementary Fig. 13. In b(ii) and c the line in each box represents the median, with the box denoting the interquartile range and the whiskers denoting the ±1.5 of the interquartile range.
Fig. 6
Fig. 6. Broad applicability of 3PNN for clinical informatics.
a (i) Schematic showing the stimuli spreads towards the apex and the base of the cochleae in an EFI. (ii) The trend of Slope¯x=1mm of the stimulus spreads toward the cochlear apex and the cochlear base across each model descriptor. The line in the box represents the median of the Slope¯x=1mm of 625 (5 × 5 × 5 × 5) predicted samples, with the box denoting the interquartile range and the whiskers denoting the ±1.5 of the interquartile range. n = 625 inferred using the model descriptors sampled uniformly in the modelling space. b (i) Schematic showing the process to generate the patient-specific biomimetic cochlear model, where inverse-3PNN was used to deduce the distribution of the model descriptors best-fitting the patient off-stimulation EFI, and the patient cochlear model was then fabricated by 3D printing with a predicted set of the model descriptors (Supplementary Fig. 18). (ii) Comparison of the off-stimulation EFIs of two patients and the off-stimulation EFIs acquired in their corresponding biomimetic cochleae. c The electrode positions in a model showing an atypical ‘mid-dip’ EFI profile (left) and a model with a typical EFI profile (right). (i) Reconstructed 3D µ-CT volumes of the cochlear lumens of the biomimetic cochleae with a CI electrode array inserted (marked green). Scale bar = 2 mm; (ii) Off-stimulation EFI profiles of the models with the peaks indicating the maximum |z| of the spread distributions at off-stimulation positions; (iii) Top view and (iv) side view of the cochlear lumens of the models, showing the positions of the electrodes in the lumens of the models relative to the lumen wall. Distance in the negative direction refers to the distance towards the cochlear centre, vice versa. Electrode 8 (red) and electrodes 9–10 (blue) are highlighted to contrast the electrode contour which generates the mid-dip EFI.

References

    1. Schiavone, G. & Lacour, S. P. Conformable bioelectronic interfaces: mapping the road ahead. Sci. Transl. Med. 11, eaaw5858 (2019). - PubMed
    1. Birmingham K, et al. Bioelectronic medicines: a research roadmap. Nat. Rev. Drug Discov. 2014;13:399–400. doi: 10.1038/nrd4351. - DOI - PubMed
    1. Famm, K., Litt, B., Tracey, K. J., Boyden, E. S. & Slaoui, M. A jump-start for electroceuticals. Nature496, 159–161 (2013). - PMC - PubMed
    1. McRackan, T. R. et al. Meta-analysis of quality-of-life improvement after cochlear implantation and associations with speech recognition abilities. Laryngoscope128, 982–990 (2018). - PMC - PubMed
    1. Macherey, O. & Carlyon, R. P. Cochlear implants. Curr. Biol.24, R878–R884 (2014). - PubMed

Publication types