. 2021 Oct 29;12(1):6250.
doi: 10.1038/s41467-021-26479-2.

Anti-spike antibody response to natural SARS-CoV-2 infection in the general population

Collaborators, Affiliations

Anti-spike antibody response to natural SARS-CoV-2 infection in the general population

Jia Wei et al. Nat Commun. .

Abstract

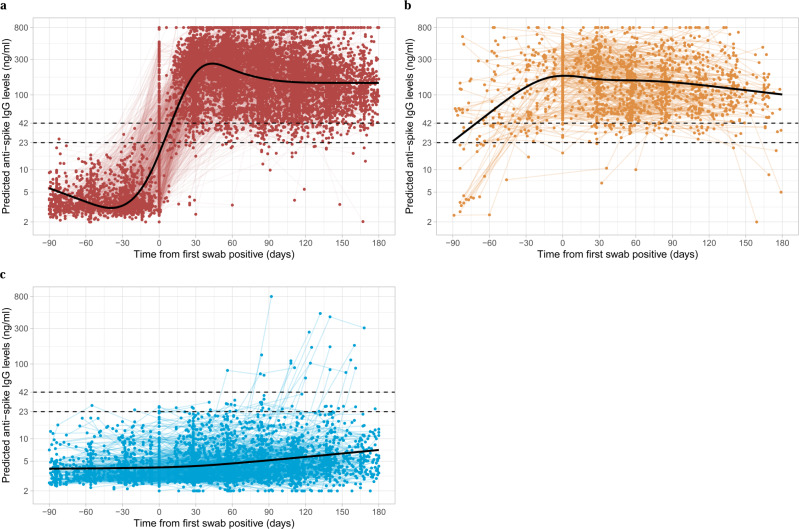
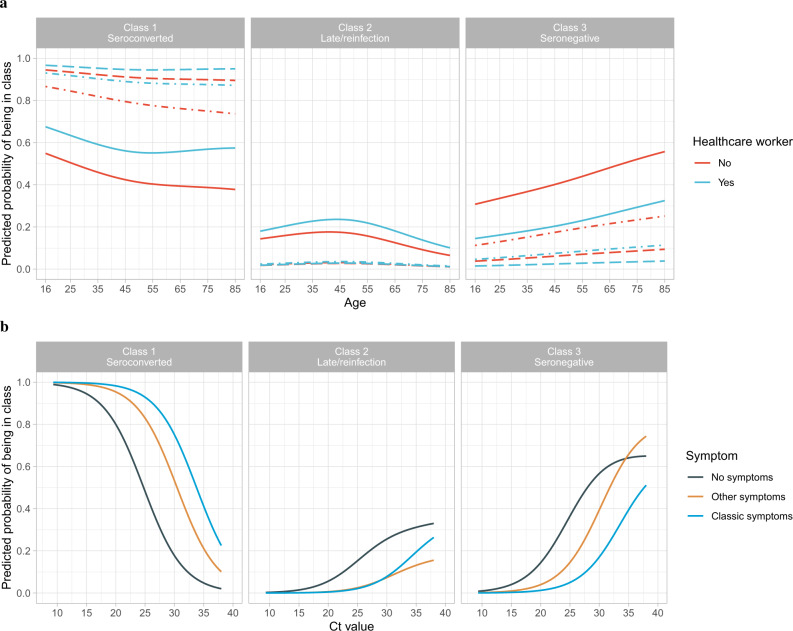
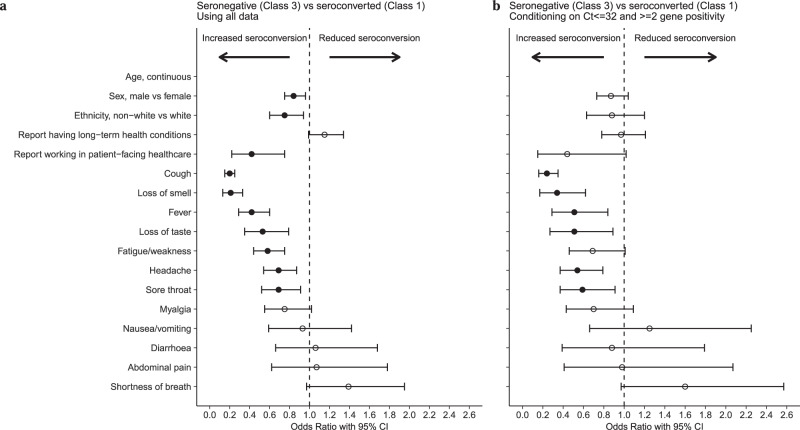
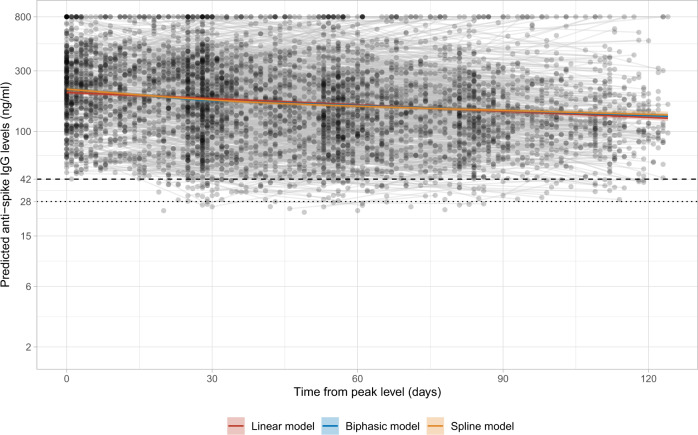
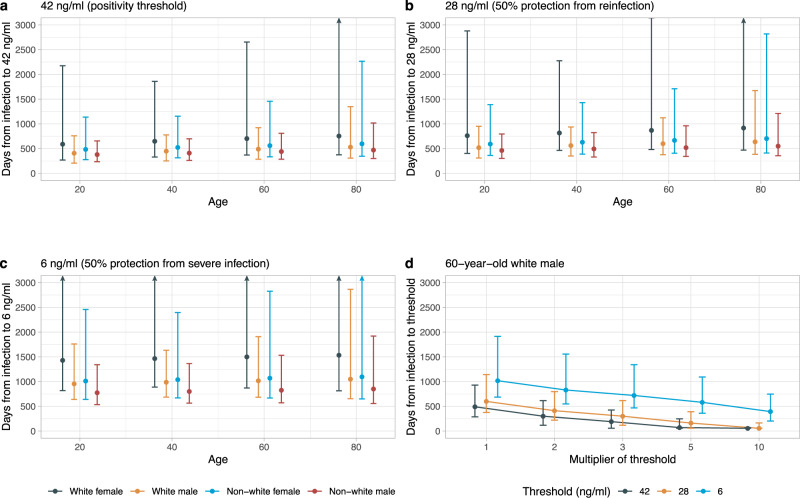
Understanding the trajectory, duration, and determinants of antibody responses after SARS-CoV-2 infection can inform subsequent protection and risk of reinfection, however large-scale representative studies are limited. Here we estimated antibody response after SARS-CoV-2 infection in the general population using representative data from 7,256 United Kingdom COVID-19 infection survey participants who had positive swab SARS-CoV-2 PCR tests from 26-April-2020 to 14-June-2021. A latent class model classified 24% of participants as 'non-responders' not developing anti-spike antibodies, who were older, had higher SARS-CoV-2 cycle threshold values during infection (i.e. lower viral burden), and less frequently reported any symptoms. Among those who seroconverted, using Bayesian linear mixed models, the estimated anti-spike IgG peak level was 7.3-fold higher than the level previously associated with 50% protection against reinfection, with higher peak levels in older participants and those of non-white ethnicity. The estimated anti-spike IgG half-life was 184 days, being longer in females and those of white ethnicity. We estimated antibody levels associated with protection against reinfection likely last 1.5-2 years on average, with levels associated with protection from severe infection present for several years. These estimates could inform planning for vaccination booster strategies.


Conflict of interest statement

D.W.E. declares lecture fees from Gilead, outside the submitted work. No other author has a conflict of interest to declare. For the purpose of Open Access, the author has applied a CC BY public copyright licence to any Author Accepted Manuscript version arising from this submission.

Figures

Fig. 1
Fig. 1. Individual trajectories for 7256 participants infected with SARS-CoV-2 by class identified from latent class mixed models.
a Class 1, ‘seroconverted in response to infection’ (N = 4683, 64.5%). b Class 2, ‘possibly late/re-infection’ (N = 831, 11.5%). c Class 3, ‘seronegative non-responders’ (N = 1742, 24.0%). Black dashed line indicates the assay threshold for IgG positivity (42 ng ml−1) and the dotted line at 28 ng ml−1 (indicates level associated with 50% protection against re-infection). Restricted natural cubic splines (internal knots at −10, 30, 60 days and boundary knots at −60 and 140 days) were used to model time (see ‘Methods’). Distribution of the factors by class membership is shown in Table 1.
Fig. 2
Fig. 2. Predicted probability of being in Class 1 (seroconverted in response to infection), 2 (possible late/re-infection) and 3 (seronegative non-responders).
a By age and working in patient-facing healthcare, plotted at the reference category for other variables (female, White ethnicity, no long-term health condition, Ct = 26, have only one positive swab test during the infection episode) and no symptoms (solid line), other symptoms (dash-dotted line), classic symptoms (dashed line). b By Ct value and self-reported symptoms, plotted at the reference category for other variables (47-year-old, female, White ethnicity, no long-term health condition, not working in patient-facing healthcare, have only one positive swab test during the episode). Age was fitted using natural cubic spline with one internal knot placed at 50 years and two boundary knots at 20 and 80 years. Full model results are shown in Supplementary Table 2.
Fig. 3
Fig. 3. Odds ratio with 95% confidence intervals from logistic regression comparing seronegative vs. seroconverting (Class 3 vs. Class 1) using demographic factors and individual symptoms that would be available without a positive test result.
a Using all data from Class 3 (N = 1742) vs. Class 1 (N = 4683). b Restricting Class 3 to those with Ct value ≤ 32 and ≥2 genes detected (N = 595) to decrease the impact of potential false-positive swab tests. Age was fitted using natural cubic spline with one internal knot placed at 50 years and two boundary knots at 20 and 80 years. Effect of age is presented in Supplementary Fig. 4. The 95% confidence intervals are calculated by prediction ± 1.96 × SE of the prediction; solid dots indicate estimates with p-values < 0.05, whereas hollow dots indicate those with p-values ≥ 0.05. Numbers of odds ratio, 95% CI and p-values are presented in Supplementary Table 3.
Fig. 4
Fig. 4. Estimated mean trajectory of anti-spike IgG antibody levels and individual trajectories in 3271 participants in Class 1.
The timing of the peak level 56 days after the first positive swab is determined from the latent class mixed model. Estimated trajectories from three models are presented: the model assuming a linear decline in log2 scale (red line), the biphasic exponential model (blue line), and the model using splines (orange line). For the biphasic model, knot is placed at 28 days. For the spline model, time is fitted using natural cubic splines with internal knots at 30, 70 and boundary knots at 5, 110. The posterior mean and 95% credibility interval are shown. Black dashed line indicates the assay threshold for IgG positivity (42 ng ml−1) and the dotted line indicates level associated with 50% protection against re-infection (28 ng ml−1).
Fig. 5
Fig. 5. Posterior predicted time (95% credibility interval) of the start of infection to three anti-spike IgG thresholds (42, 28 and 6 ng ml−1) by age (20, 40, 60 and 80 years), sex, and ethnicity from the multivariable biphasic exponential model in 3271 participants.
a Time from the start of infection to the positivity threshold of 42 ng ml−1. b Time from the start of infection to the equivocal threshold of 28 ng ml−1, which corresponds to 50% protection against PCR-confirmed re-infection. c Time from the start of infection to 6 ng ml−1, which corresponds to 50% protection against severe infection. d Time from the start of infection to the above three thresholds multiplied by 2, 3, 5 and 10, in a 60-year-old White male as an example, to estimate the duration given the higher antibody level required for protection against variants of concern. Estimations are shown in Supplementary Table 8. Estimates using the linear exponential model are shown in Supplementary Fig. 11 and Supplementary Table 8.

References

    1. WHO Coronavirus (COVID-19) Dashboard | WHO Coronavirus (COVID-19) Dashboard With Vaccination Data. https://covid19.who.int/.
    1. Overbaugh J. Understanding protection from SARS-CoV-2 by studying reinfection. Nat. Med. 2020;26:1680–1681. doi: 10.1038/s41591-020-1121-z. - DOI - PubMed
    1. Hall VJ, et al. SARS-CoV-2 infection rates of antibody-positive compared with antibody-negative health-care workers in England: a large, multicentre, prospective cohort study (SIREN) Lancet. 2021;397:1459–1469. doi: 10.1016/S0140-6736(21)00675-9. - DOI - PMC - PubMed
    1. Lumley SF, et al. Antibody status and incidence of SARS-CoV-2 infection in health care workers. N. Engl. J. Med. 2021;384:533–540. doi: 10.1056/NEJMoa2034545. - DOI - PMC - PubMed
    1. Bubar KM, et al. Model-informed COVID-19 vaccine prioritization strategies by age and serostatus. Science. 2021;371:916–921. doi: 10.1126/science.abe6959. - DOI - PMC - PubMed

Publication types