Review
. 2021 Dec;16(12):5398-5425.
doi: 10.1038/s41596-021-00616-z. Epub 2021 Oct 29.

Multiplexed single-cell proteomics using SCoPE2

Affiliations
Review

Multiplexed single-cell proteomics using SCoPE2

Aleksandra A Petelski et al. Nat Protoc. 2021 Dec.

Abstract

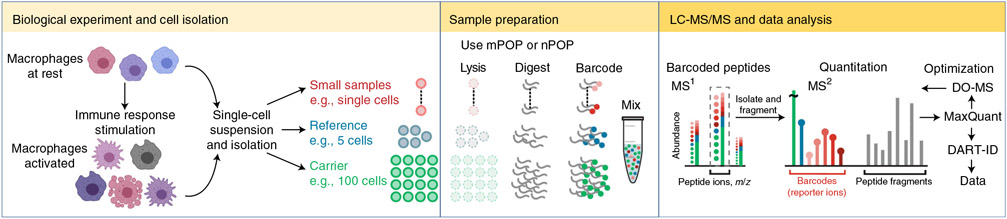
Many biological systems are composed of diverse single cells. This diversity necessitates functional and molecular single-cell analysis. Single-cell protein analysis has long relied on affinity reagents, but emerging mass-spectrometry methods (either label-free or multiplexed) have enabled quantifying >1,000 proteins per cell while simultaneously increasing the specificity of protein quantification. Here we describe the Single Cell ProtEomics (SCoPE2) protocol, which uses an isobaric carrier to enhance peptide sequence identification. Single cells are isolated by FACS or CellenONE into multiwell plates and lysed by Minimal ProteOmic sample Preparation (mPOP), and their peptides labeled by isobaric mass tags (TMT or TMTpro) for multiplexed analysis. SCoPE2 affords a cost-effective single-cell protein quantification that can be fully automated using widely available equipment and scaled to thousands of single cells. SCoPE2 uses inexpensive reagents and is applicable to any sample that can be processed to a single-cell suspension. The SCoPE2 workflow allows analyzing ~200 single cells per 24 h using only standard commercial equipment. We emphasize experimental steps and benchmarks required for achieving quantitative protein analysis.


Figures

Extended Data Fig. 1 ∣
Extended Data Fig. 1 ∣. The ABIRD may suppress contaminant ions and enhance peptide identification.
ABIRD may suppress contaminant ions and enhance peptide identification. Replicate injections of a 1× standard were analyzed with the ABIRD on or off. a, The replicates with ABIRD on had a reduced number of +1 ions (likely corresponding to contaminants) and an increased number of higher-charge-state ions, which are likely to correspond to peptides. b, With the ABIRD on, the number of identified peptides is increased across all confidence levels (PEP).
Fig. 1 ∣
Fig. 1 ∣. Single-cell proteomics with SCoPE2.
Single cells differ in biologiucal functions and in molecular composition, as illustrated here with macrophages. The cells from such heterogeneous populations can be converted into single-cell suspensions, individual cells isolated by FACS sorting, CellenONE or another method. The isolated single cells are lysed, the proteins digested and the resulting peptides labeled with TMTs. All of these stages can be automated and performed in parallel by either mPOP and nPOP. The labeled peptides are mixed and analyzed by LC-MS/MS with parameters optimized by DO-MS. The confidence in correct pepide identification can be further increased by tools, such as DART-ID.
Fig. 2 ∣
Fig. 2 ∣. LC-MS/MS setup for SCoPE2 experiments.
The left panels show the typical gradient parameters used for SCoPE2 runs. Nonstandard portions of the gradient include turning the voltage off during the initial phase to the gradient to reduce the contamination of the heated capillary. Material collected on the emitter tip is then removed with sheath gas briefly directed at the tip through a blower elbow. After this point, the voltage is applied and scan data collected. The right panels show the attachment of the blower elbow to a Q-Exactive classic instrument.
Fig. 3 ∣
Fig. 3 ∣. Evaluating data acquisition and interpretation using diagnostic plot generated by DO-MS.
a, Distributions of intensities for precursors quantified in all displayed experiments. The similar medians and shapes indicate successful and uniform delivery of the SCoPE2 samples to the MS instrument. This distribution and many additional distributions are generated by DO-MS, for example, the distribution of all detected precursors, which contains many less abundant precursor ions. The corresponding dataset can be found at https://doi.org/10.6084/m9.figshare.15060774.v1. b, The distributions of times for accumulating ions for MS2 scans indicate that most ions were accumulated for maximum time allowed (300 ms) and thus the size of the isobaric carrier and the choice of AGC max did not limit the sampling of peptides from the single cells. c, Distributions of times between the apexes of elution peaks and the time when they were sampled for MS2 scans. The small deviations from the apex indicate good apex sampling, and larger devisions would require further optimization as described previously. d, Number of MS2 scans and PSMs at different levels of confidence. The PSM confidence is quantified by the PEP computed by MaxQuant as well as by the PEP updated by DART-ID. These and many other plots are automatically generated by DO-MS.
Fig. 4 ∣
Fig. 4 ∣. Evaluating protein quantification results from SCoPE2 analysis.
a, Distributions of relative reporter ion intensities for all samples from a single SCoPE2 set. The samples include an isobaric carrier, a reference single HeLa cells, five single U937 cells, a negative control well (Ctr−) and a positive control well (Ctr+) from diluted U937 cell lysate. Two of the TMT labels (between the reference and the single cells) are not used because they are affected by isotopic impurities of the TMT labels used for the carrier and the reference. The bin marked by >−3.5 corresponds mostly to RI intensities below the detection limit (missing values). The spread of the single-cell RI distributions corresponds to differences in the relative protein levels among the single cells and the isobaric carrier/reference. b, Distributions of CVs quantify the consistency of protein quantification based on different peptides originating from the same protein. Lower CVs for the single cells correspond to higher consistency of quantification compared with the CVs of the negative control wells, which correspond to noise. c, PCA of 126 single cells and bulk samples. The PCA is based on 1,756 proteins with ~1,000 proteins quantified per single cell. b and c are generated by the SCoPE2 pipeline.

Similar articles

Cited by

References

    1. Symmons O & Raj A What’s luck got to do with it: single cells, multiple fates, and biological non-determinism. Mol. Cell 62, 788–802 (2016). - PMC - PubMed
    1. Paul I, White C, Turcinovic I & Emili A Imaging the future: the emerging era of single-cell spatial proteomics. FEBS J. 2020). - PubMed
    1. Levy E & Slavov N Single cell protein analysis for systems biology. Essays Biochem. 10.1042/EBC20180014 (2018). - DOI - PMC - PubMed
    1. Regev A et al. Science forum: the human cell atlas. eLife 6, e27041 (2017). - PMC - PubMed
    1. Ziegenhain C et al. Comparative analysis of single-cell RNA sequencing methods. Mol. Cell 65, 631–643 (2017). - PubMed

Related links

    1. Specht H et al. Genome Biol. 22, 50 (2021): 10.1186/s13059-021-02267-5 - DOI - PMC - PubMed
    1. Budnik B et al. Genome Biol. 19, 161 (2018): https://genomebiology.biomedcentral.com/articles/10.1186/s13059-018-1547-5 - DOI - PMC - PubMed
    1. Specht H & Slavov NJ Proteome Res. 20, 880887 (2021): https://pubs.acs.org/doi/10.1021/acs.jproteome.0c00675 - DOI - PMC - PubMed

Publication types

MeSH terms