

Associations between environmental covariates and temporal changes in malaria incidence in high transmission settings of Uganda: a distributed lag nonlinear analysis
- PMID: 34717583
- PMCID: PMC8557030
- DOI: 10.1186/s12889-021-11949-5
Associations between environmental covariates and temporal changes in malaria incidence in high transmission settings of Uganda: a distributed lag nonlinear analysis
Abstract
Background: Environmental factors such as temperature, rainfall, and vegetation cover play a critical role in malaria transmission. However, quantifying the relationships between environmental factors and measures of disease burden relevant for public health can be complex as effects are often non-linear and subject to temporal lags between when changes in environmental factors lead to changes in malaria incidence. The study investigated the effect of environmental covariates on malaria incidence in high transmission settings of Uganda.
Methods: This study leveraged data from seven malaria reference centres (MRCs) located in high transmission settings of Uganda over a 24-month period. Estimates of monthly malaria incidence (MI) were derived from MRCs' catchment areas. Environmental data including monthly temperature, rainfall, and normalized difference vegetation index (NDVI) were obtained from remote sensing sources. A distributed lag nonlinear model was used to investigate the effect of environmental covariates on malaria incidence.
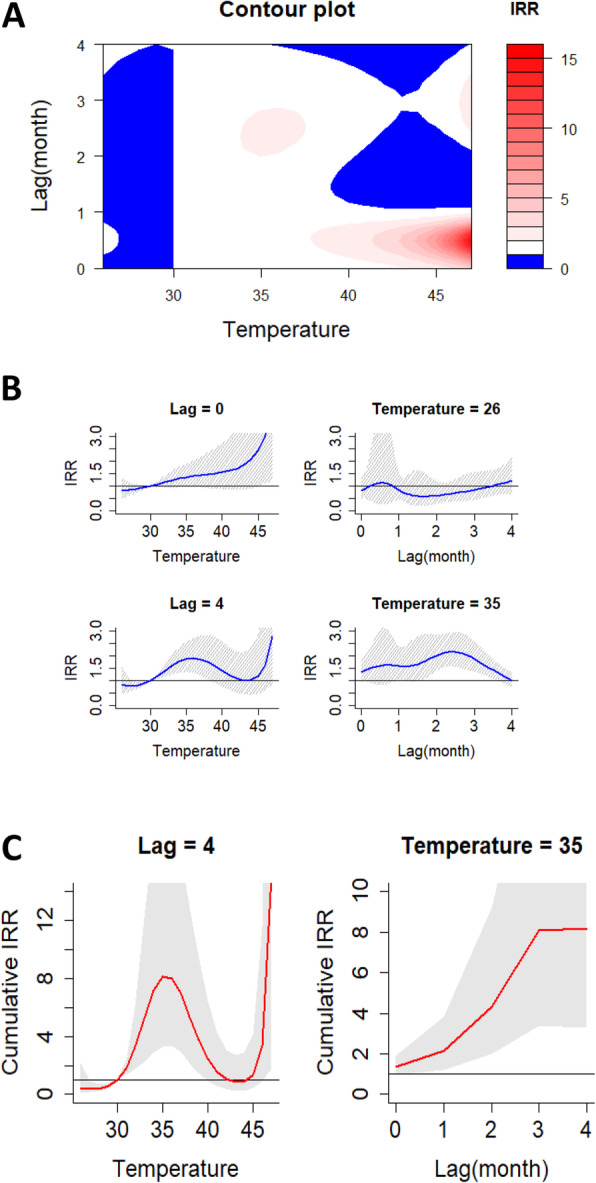
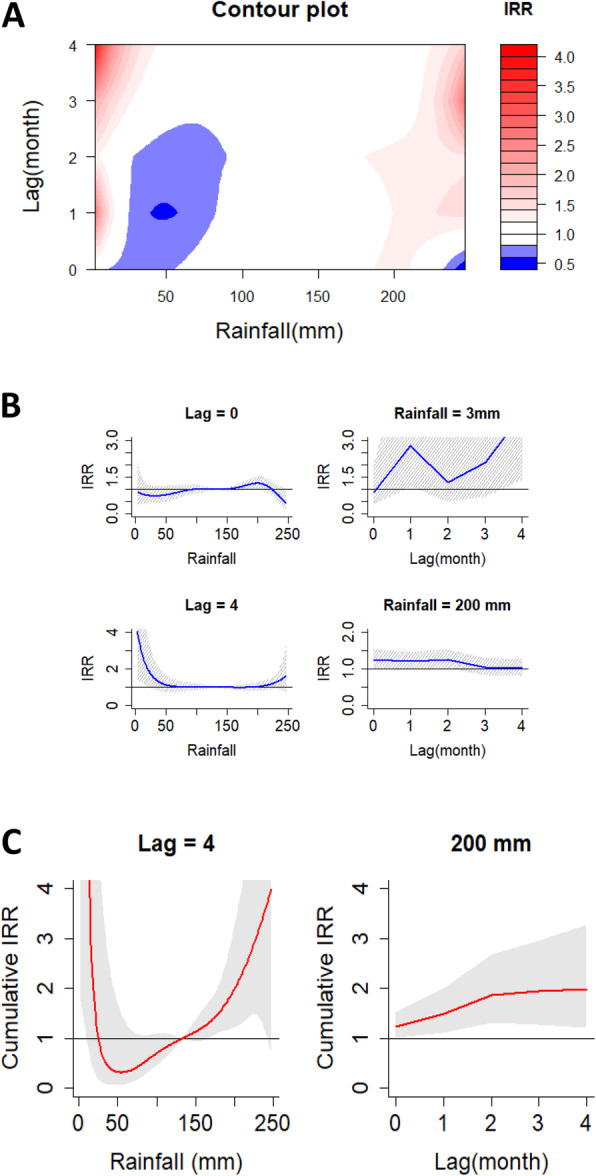
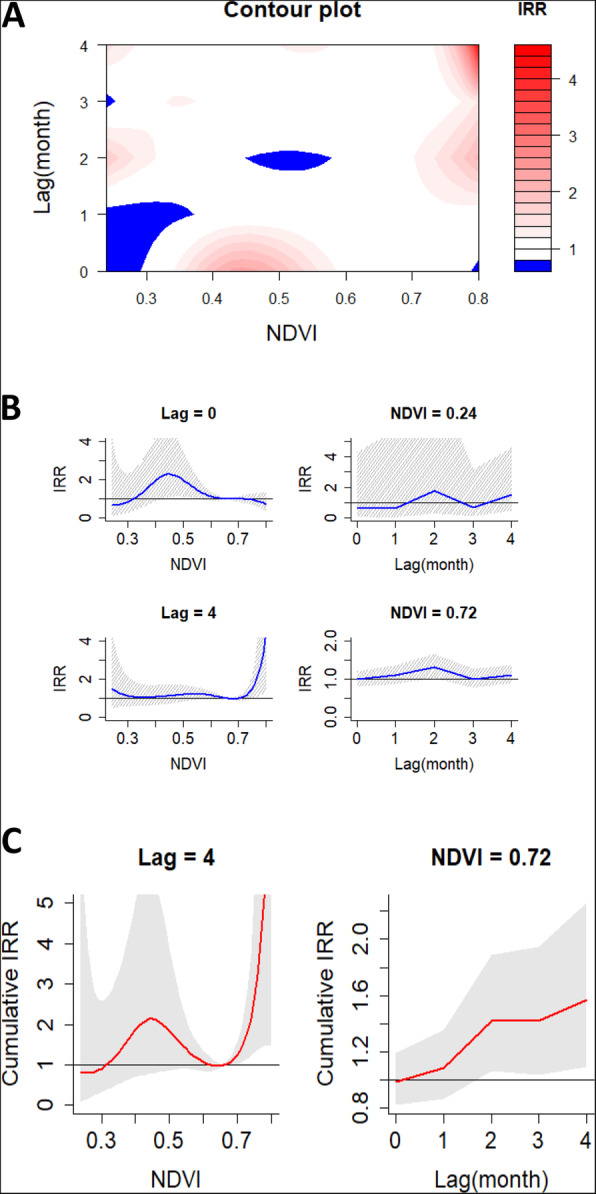
Results: Overall, the median (range) monthly temperature was 30 °C (26-47), rainfall 133.0 mm (3.0-247), NDVI 0.66 (0.24-0.80) and MI was 790 per 1000 person-years (73-3973). Temperature of 35 °C was significantly associated with malaria incidence compared to the median observed temperature (30 °C) at month lag 2 (IRR: 2.00, 95% CI: 1.42-2.83) and the increased cumulative IRR of malaria at month lags 1-4, with the highest cumulative IRR of 8.16 (95% CI: 3.41-20.26) at lag-month 4. Rainfall of 200 mm significantly increased IRR of malaria compared to the median observed rainfall (133 mm) at lag-month 0 (IRR: 1.24, 95% CI: 1.01-1.52) and the increased cumulative IRR of malaria at month lags 1-4, with the highest cumulative IRR of 1.99(95% CI: 1.22-2.27) at lag-month 4. Average NVDI of 0.72 significantly increased the cumulative IRR of malaria compared to the median observed NDVI (0.66) at month lags 2-4, with the highest cumulative IRR of 1.57(95% CI: 1.09-2.25) at lag-month 4.
Conclusions: In high-malaria transmission settings, high values of environmental covariates were associated with increased cumulative IRR of malaria, with IRR peaks at variable lag times. The complex associations identified are valuable for designing strategies for early warning, prevention, and control of seasonal malaria surges and epidemics.
Keywords: Covariates; DLNM; Effect; Environmental; Incidence; Malaria; Temporal.
© 2021. The Author(s).
Conflict of interest statement
The authors declare that they have no competing interests.
Figures
References
-
- CDC: Where malaria occurs [Internet]. Available from: https://www.cdc.gov/malaria/about/distribution.html
Publication types
MeSH terms
Grants and funding
LinkOut - more resources
Full Text Sources
Medical
