

Non-pharmaceutical interventions, vaccination, and the SARS-CoV-2 delta variant in England: a mathematical modelling study
- PMID: 34717829
- PMCID: PMC8550916
- DOI: 10.1016/S0140-6736(21)02276-5
Non-pharmaceutical interventions, vaccination, and the SARS-CoV-2 delta variant in England: a mathematical modelling study
Abstract
Background: England's COVID-19 roadmap out of lockdown policy set out the timeline and conditions for the stepwise lifting of non-pharmaceutical interventions (NPIs) as vaccination roll-out continued, with step one starting on March 8, 2021. In this study, we assess the roadmap, the impact of the delta (B.1.617.2) variant of SARS-CoV-2, and potential future epidemic trajectories.
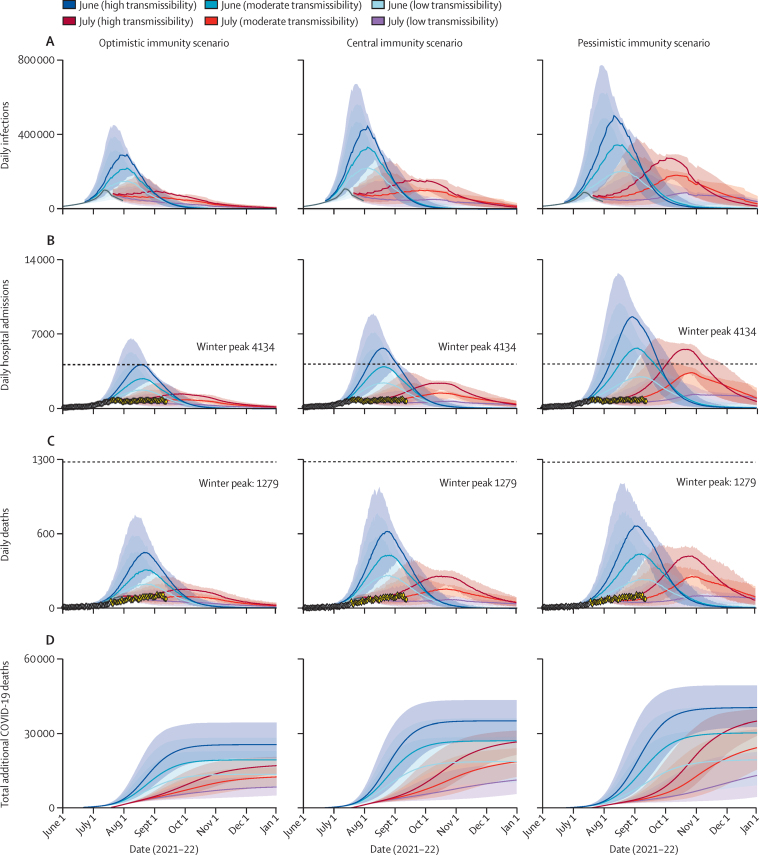
Methods: This mathematical modelling study was done to assess the UK Government's four-step process to easing lockdown restrictions in England, UK. We extended a previously described model of SARS-CoV-2 transmission to incorporate vaccination and multi-strain dynamics to explicitly capture the emergence of the delta variant. We calibrated the model to English surveillance data, including hospital admissions, hospital occupancy, seroprevalence data, and population-level PCR testing data using a Bayesian evidence synthesis framework, then modelled the potential trajectory of the epidemic for a range of different schedules for relaxing NPIs. We estimated the resulting number of daily infections and hospital admissions, and daily and cumulative deaths. Three scenarios spanning a range of optimistic to pessimistic vaccine effectiveness, waning natural immunity, and cross-protection from previous infections were investigated. We also considered three levels of mixing after the lifting of restrictions.
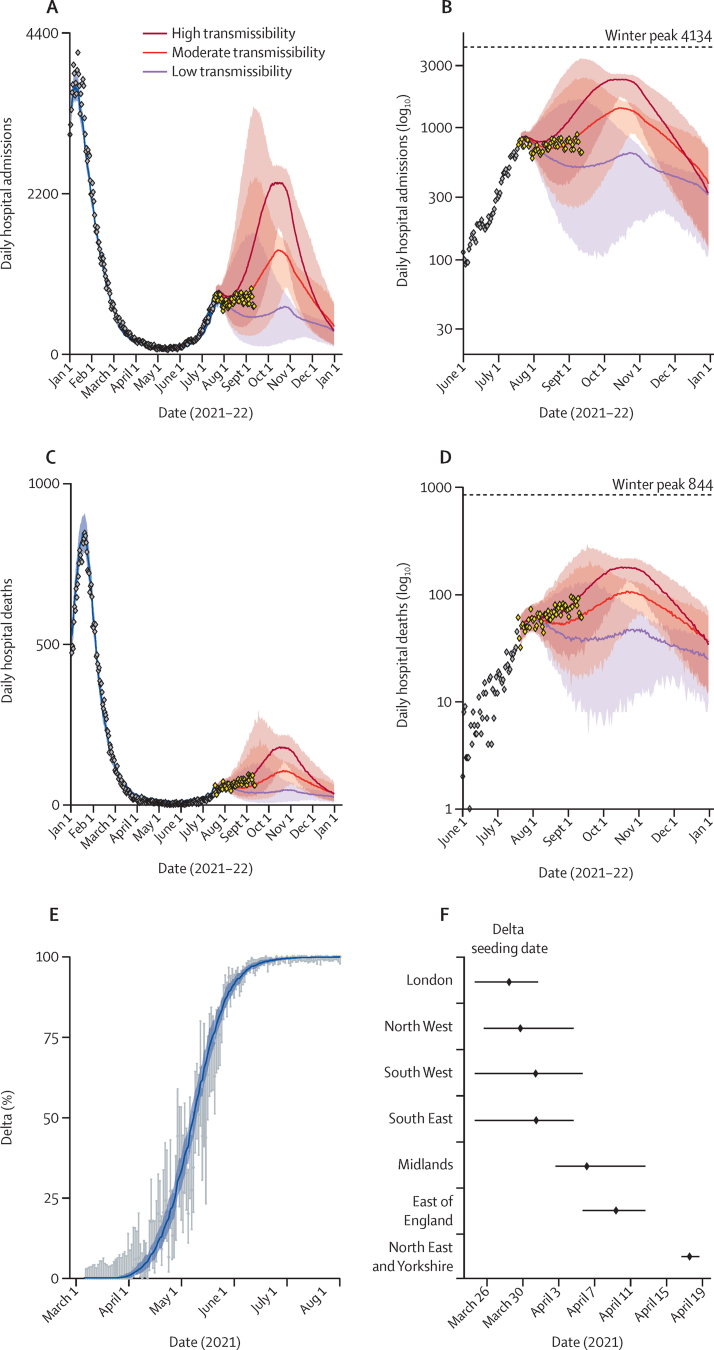
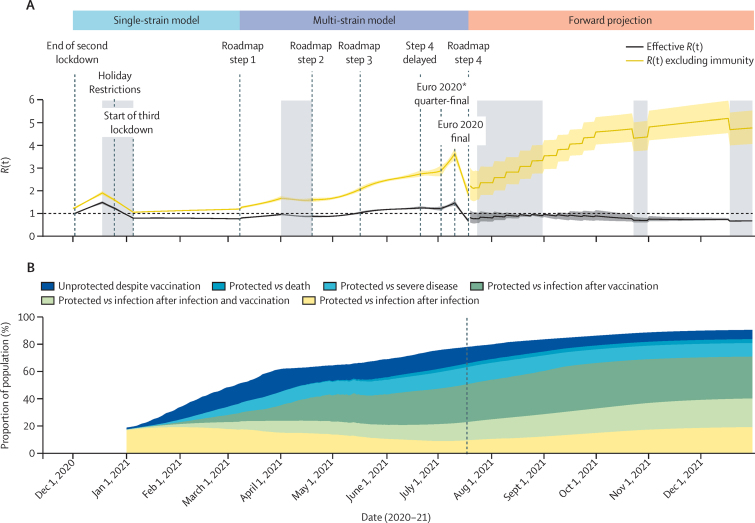
Findings: The roadmap policy was successful in offsetting the increased transmission resulting from lifting NPIs starting on March 8, 2021, with increasing population immunity through vaccination. However, because of the emergence of the delta variant, with an estimated transmission advantage of 76% (95% credible interval [95% CrI] 69-83) over alpha, fully lifting NPIs on June 21, 2021, as originally planned might have led to 3900 (95% CrI 1500-5700) peak daily hospital admissions under our central parameter scenario. Delaying until July 19, 2021, reduced peak hospital admissions by three fold to 1400 (95% CrI 700-1700) per day. There was substantial uncertainty in the epidemic trajectory, with particular sensitivity to the transmissibility of delta, level of mixing, and estimates of vaccine effectiveness.
Interpretation: Our findings show that the risk of a large wave of COVID-19 hospital admissions resulting from lifting NPIs can be substantially mitigated if the timing of NPI relaxation is carefully balanced against vaccination coverage. However, with the delta variant, it might not be possible to fully lift NPIs without a third wave of hospital admissions and deaths, even if vaccination coverage is high. Variants of concern, their transmissibility, vaccine uptake, and vaccine effectiveness must be carefully monitored as countries relax pandemic control measures.
Funding: National Institute for Health Research, UK Medical Research Council, Wellcome Trust, and UK Foreign, Commonwealth and Development Office.
Copyright © 2021 The Author(s). Published by Elsevier Ltd. This is an Open Access article under the CC BY 4.0 license. Published by Elsevier Ltd.. All rights reserved.
Conflict of interest statement
Declaration of interests AC has received payment from Pfizer for teaching of mathematical modelling of infectious diseases. KAMG has received honoraria from Wellcome Genome Campus for lectures and salary support from the Bill & Melinda Gates Foundation and Gavi, the Vaccine Alliance, through Imperial College London for work outside this study. All other authors declare no competing interests.
Figures
Comment in
-
Nowcasting towards sustainable SARS-CoV-2 endemicity.Lancet. 2021 Nov 13;398(10313):1781-1783. doi: 10.1016/S0140-6736(21)02386-2. Epub 2021 Oct 28. Lancet. 2021. PMID: 34717830 Free PMC article. No abstract available.
References
-
- GOV.UK
- Vaccinations in United Kingdom. https://coronavirus.data.gov.uk/details/vaccinations
-
- Prime Minister's Office Prime Minister announces national lockdown. Jan 4, 2021. https://www.gov.uk/government/news/prime-minister-announces-national-loc...
-
- Cabinet Office UK Government COVID-19 response—spring 2021. Feb 22, 2021. https://www.gov.uk/government/publications/covid-19-response-spring-2021...
-
- Volz E, Mishra S, Chand M, et al. Transmission of SARS-CoV-2 lineage B.1·1·7 in England: insights from linking epidemiological and genetic data. medRxiv. 2021 doi: 10.1101/2020.12.30.20249034. published online Jan 4. (preprint). - DOI
-
- Tegally H, Wilkinson E, Giovanetti M, et al. Emergence and rapid spread of a new severe acute respiratory syndrome-related coronavirus 2 (SARS-CoV-2) lineage with multiple spike mutations in South Africa. medRxiv. 2020 doi: 10.1101/2020.12.21.20248640. published online Dec 22. (preprint). - DOI
MeSH terms
Substances
Grants and funding
LinkOut - more resources
Full Text Sources
Medical
Miscellaneous
