Review
. 2021 Nov;29(4):557-581.
doi: 10.1016/j.mric.2021.06.007.

Fetal Neuroimaging Updates

Affiliations
Review

Fetal Neuroimaging Updates

Jeffrey N Stout et al. Magn Reson Imaging Clin N Am. 2021 Nov.

Abstract

MR imaging is used in conjunction with ultrasound screening for fetal brain abnormalities because it offers better contrast, higher resolution, and has multiplanar capabilities that increase the accuracy and confidence of diagnosis. Fetal motion still severely limits the MR imaging sequences that can be acquired. We outline the current acquisition strategies for fetal brain MR imaging and discuss the near term advances that will improve its reliability. Prospective and retrospective motion correction aim to make the complement of MR neuroimaging modalities available for fetal diagnosis, improve the performance of existing modalities, and open new horizons to understanding in utero brain development.

Keywords: Fetus; Magnetic resonance imaging; Neuroimaging.


Conflict of interest statement

Disclosure The authors have no commercial or financial conflicts of interest to declare.

Figures

Figure 1.
Figure 1.
Common artifacts of fetal MRI. (A) The dielectric artifact (low signal intensity in the central part of the image, circle) is caused by the size of the abdomen in comparison to the frequency of the RF pulses used in imaging. (B) SS-FSE slice corruption (low signal intensity in the anterior and inferior areas of the head, arrows) due to fetal motion, and volume incoherence also causes information loss. (C) bSSFP banding (one dark band crosses the brain, arrow) is caused by magnetic field inhomogeneities. EPI artefacts include (D) ghosting (image copies, arrows), (E) geometric distortion (anterior aspect of brain is distorted, arrow) likely caused by proximity to the maternal bowel, and susceptibility artefact as shown in Figure 9.
Figure 2.
Figure 2.
Normal progresive development of cerebral sulcation in the fetal brain at different gestational ages. Axial and coronal SS-FSE images in 4 different fetuses. (A,B) 15 weeks, 6 days of gestational age; (C,D) 22 weeks, 2 days of gestational age; (E,F) 28 weeks, 3 days of gestational age and (G,H) 34 weeks, 0 days gestational age. Interhemispheric fissure (arrow) sylvian fissures (dashed arrows), superior frontal sulcus (white arrowhead), inferior frontal sulcus (black arrowhead), inferior temporal sulcus (curved arrow) and superior temporal sulcus (open arrow).
Figure 3.
Figure 3.
Normal multilaminar appearance of the brain parenchyma in a fetus with 22 weeks of gestation. Coronal SS-FSE image. VZ= ventricular zone, PV= periventricular fiber-rich zone, IZ= intermediate zone, SP= subplate, CP= cortical plate and GE= ganglionic eminences.
Figure 4.
Figure 4.
Coherent fetal volumes improve identification of subependymal gray matter heterotopia in a fetus with 22 weeks of gestation. (A, B, C) Coronal images from 3 different SS-FSE stacks. No heterotopias were prospectively identified by two experienced fetal neuroradiologists. (D, E) SVR reconstruction enables the detection of a focus of subependymal heterotopia (red arrows) due to the ability to cross-reference it in a coherent volume. (F) Postnatal T2-weighted image confirmed the focus of heterotopia (red arrow). Coherent fetal volumes have the potential to improve diagnostic accuracy.
Figure 5.
Figure 5.
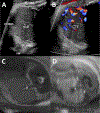
Scalp congenital hemangioma in a fetus at 32 weeks of gestation. (A) Transverse color doppler image of the right scalp demonstrates a well circumscribed hypoechoic subcutaneous mass with increased vascularity of color doppler interrogation (arrows). The mass demonstrated venous and arterial waveforms (not shown). (B) Axial and (C) coronal SS-FSE images show diffuse right-sided scalp swelling surrounding the soft tissue mass. There are multiple foci of linear low signal around and within the mass (dashed arrows) consistent with flow voids. There is remodeling of the skull without intracranial extension.
Figure 6.
Figure 6.
Examples of 3D volume reconstructions. (A) A recently proposed 3D reconstruction algorithm relaxes the rigid body constraints of prior slice-to-volume registration (SVR) techniques. Here a deformable slice to volume registration, super resolution reconstruction with integrated outlier removal (DSVR+S) recovers a high quality isotropic volume from the heavily motion corrupted acquisition on the left. (Adapted from Uus A, et al. Deformable Slice-to-Volume Registration for Motion Correction of Fetal Body and Placenta MRI. IEEE Trans Med Imaging. Published online February 18, 2020; with permission) (B) DSVR can be combined with novel acquisition strategies, here an excitation scheme that produces an imaging volume by continuously moving an excitation band across the volume of interest (SWEEP), to produce high quality structural (left) and angiographic (right) volumes. (From Jackson LH, et al. Motion corrected reconstruction of abdominal SWEEP data using local similarity graphs and deformable slice to volume registration. In: Proc Intl Soc Mag Reson Med.; 2020:453.; with permission)
Figure 7.
Figure 7.
Airway narrowing and swallowing impairment in a fetus with 34 weeks of gestation due to mass effect from cervical teratoma. (A-C) Sagittal bSSFP cine clips show a predominantly solid mass in the anterior cervical region with macrocystic changes consistent with postnatally confirmed cervical teratoma (arrows). Dynamic assessment of the airways and esophagus demonstrate dilation of the hypopharynx (dashed arrows) and no clear visualization of the upper esophageal distention consistent with mass effect in the airway. This fetus also presented with polyhydramnios (not shown). Note the banding artifact (arrowhead) related to this sequence.
Figure 8.
Figure 8.
Complex open neural defect in a fetus with 35 weeks of gestation. (A, B) Sagittal ultrasound images of the lumbosacral region shows a complex bilobed myelomeningocele (arrows). The exact level of spinal defect is difficult to identify on ultrasound due to kyphosis centered at L3. (C) Sagittal bSSFP demonstrates spinal defect extending from about L1 (dashed arrow) through the sacrum (arrows). There is a lumbosacral kyphotic curve centered at L3 (arrow head). In addition, MRI showed moderate ventriculomegaly and mild inferior displacement of the cerebellar tonsils (Not shown) consistent with Chiari II malformation.
Figure 9.
Figure 9.
Intraventricular bleeding as cause of ventriculomegaly in a fetus with 20 weeks of gestation (A) Axial SS-FSE image demonstrates severe lateral ventriculomegaly and moderate dilation of the third ventricle (*). The fourth ventricle was normal in size (not shown). (B) EPI T2* image with high TE (80ms) demonstrate fluid-fluid level in the lateral ventricles (arrowheads) and foci of susceptibility artifacts in the bilateral frontal periventricular white matter (arrows) and the bilateral caudothalamic grooves (dashed-arrows) consistent with germinal matrix hemorrhage with parenchymal and intraventricular extension, and the likely cause of the ventriculomegaly. Note geometric distortion artifact of in the anterior cranium and frontal lobes. (C) EPI T2* image with low TE (30ms) confirmed presence of susceptibility artifacts seen on the high TE sequence.
Figure 10.
Figure 10.
Normal subjective fetal motion of the right lower extremity in a fetus with 19 weeks of gestation. (A, B) Sagittal GRE-EPI sequence acquired as a cine clip demonstrates flexion and extension of the left knee and ankle. Note that the cartilaginous epiphyses appear as high signal and the cortical bone of the diaphyses are low signal.
Figure 11.
Figure 11.
Normal T1-weighted images in a fetus of 34 week of gestation (A) Sagittal T1-weighted image shows the normal T1 hyperintense thyroid pituitary gland (dashed arrow) and thyroid gland (arrow). (B) Axial T1-weighted images in the same fetus show normal myelination with T1 shortening in the tegmentum of the pons (dashed arrow). Note the T1-contrast and lower SNR compared to SS-FSE sequence in fetus Figure 2 (G, H).
Figure 12.
Figure 12.
Fetal Goiter in a fetus with 33 weeks of gestational age. (A)Transverse grayscale and (B) color doppler sonographic image of the neck demonstrates a solid, bilobed homogeneous midline mass around the traquea (T) with increased vascularity in color doppler interrogation. (C) Axial balanced SSFP and (D) axial T1-weighted images of the neck show that this bilobed mass demostraste high signal of T1-weighted images consistent with thyroid tissue.
Figure 13.
Figure 13.
Partially thrombosed dural sinus malformation in a fetus with 21 weeks of gestation. (A) Doppler ultrasound image in the sagittal plane shows a large midline predominantly anechoic structure at the torcula level with prominent flow in the anterior aspect, consistent with a large dural sinus malformation. There is an isoechoic round focus in the posterior margin without vascular flow (arrow). (B) Spectral doppler image in the sagittal plane demonstrates arterial flow along the anterior margin of the malformation, suggesting presence of arteriovenous communication. (C) Axial and (D) sagittal SS-FSE images demonstrate a large dural sinus malformation with predominant T2 hypointense signal. (E) T1-weighted sagittal image at the same level as (D) demonstrates a round high signal focus (arrow) consistent with an intralesional thrombus.
Figure 14.
Figure 14.
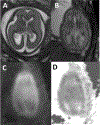
Fetal demise of fetus B, status post 8 days of laser ablation therapy for twin-twin transfusion syndrome in a 22 weeks gestation. (A) Axial bSSFP images of fetus A shows mild right ventriculomegaly with normal appearance of the extra-axial fluid spaces for gestational age. (B) Axial bSSFP images of fetus B shows nonspecific diffuse decrease in extra-axial fluid spaces with normal ventricular size. The calvarium of fetus B is smaller compared to fetus A. (C) Axial B-500 image and (D) ADC maps demonstrate global brain parenchymal diffusion restriction consistent with fetal demise.
Figure 15.
Figure 15.
Reconstructed diffusion tensor images (DTI) in a fetus with 36 weeks of gestation shows white matter fiber bundles of the brain (images courtesy of Camilo Jaimes Cobos, MD, and Fedel Machado, MD).

References

    1. Coblentz AC, Teixeira SR, Mirsky DM, Johnson AM, Feygin T, Victoria T. How to read a fetal magnetic resonance image 101. Pediatr Radiol. 2020;50(13):1810–1829. - PubMed
    1. AIUM-ACR-ACOG-SMFM-SRU Practice Parameter for the Performance of Standard Diagnostic Obstetric Ultrasound Examinations. J Ultrasound Med. 2018;37(11):E13–E24. - PubMed
    1. Choi JJ, Yang E, Soul JS, Jaimes C. Fetal magnetic resonance imaging: supratentorial brain malformations. Pediatr Radiol. 2020;50(13):1934–1947. - PubMed
    1. Committee on Practice Parameters – Pediatric Radiology of the ACR Commission on Pediatric Radiology in collaboration with the SPR. ACR–SPR Practice Parameter For The Safe And Optimal Performance Of Fetal Magnetic Resonance Imaging (MRI). The American College of Radiology. Published 2020. Accessed April 6, 2021. https://www.acr.org/-/media/ACR/Files/Practice-Parameters/mr-fetal.pdf
    1. Griffiths PD, Bradburn M, Campbell MJ, et al. Use of MRI in the diagnosis of fetal brain abnormalities in utero (MERIDIAN): a multicentre, prospective cohort study. Lancet. 2017;389(10068):538–546. - PubMed