. 2021 Oct 29;13(20):23471-23516.
doi: 10.18632/aging.203660. Epub 2021 Oct 29.

Predicting physiological aging rates from a range of quantitative traits using machine learning

Affiliations

Predicting physiological aging rates from a range of quantitative traits using machine learning

Eric D Sun et al. Aging (Albany NY). .

Abstract

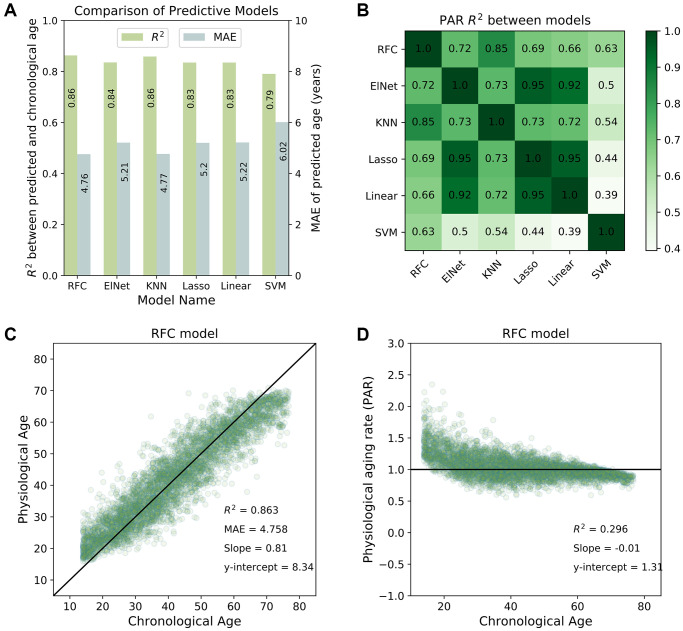
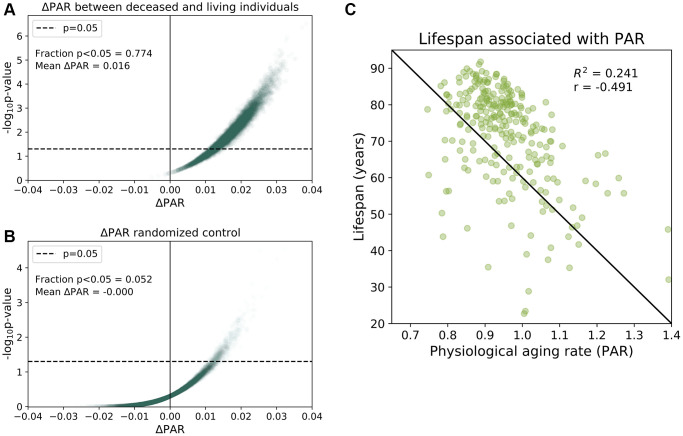
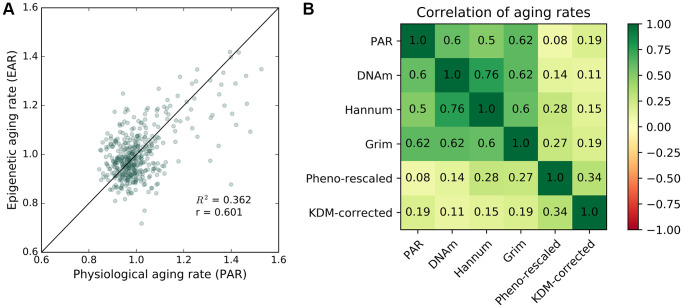
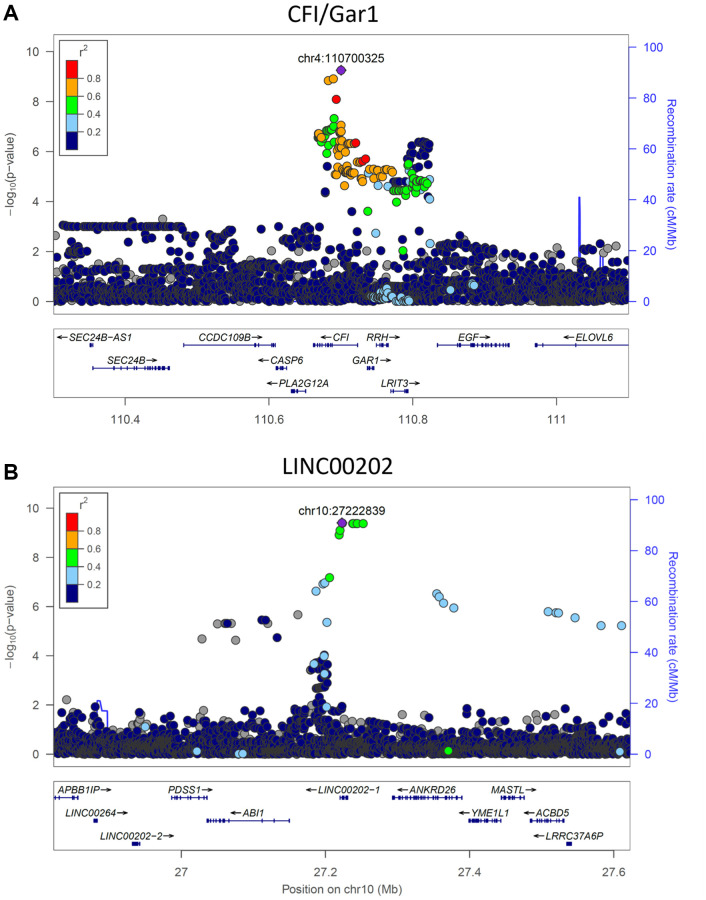
It is widely thought that individuals age at different rates. A method that measures "physiological age" or physiological aging rate independent of chronological age could therefore help elucidate mechanisms of aging and inform an individual's risk of morbidity and mortality. Here we present machine learning frameworks for inferring individual physiological age from a broad range of biochemical and physiological traits including blood phenotypes (e.g., high-density lipoprotein), cardiovascular functions (e.g., pulse wave velocity) and psychological traits (e.g., neuroticism) as main groups in two population cohorts SardiNIA (~6,100 participants) and InCHIANTI (~1,400 participants). The inferred physiological age was highly correlated with chronological age (R2 > 0.8). We further defined an individual's physiological aging rate (PAR) as the ratio of the predicted physiological age to the chronological age. Notably, PAR was a significant predictor of survival, indicating an effect of aging rate on mortality. Our trait-based PAR was correlated with DNA methylation-based epigenetic aging score (r = 0.6), suggesting that both scores capture a common aging process. PAR was also substantially heritable (h2~0.3), and a subsequent genome-wide association study of PAR identified significant associations with two genetic loci, one of which is implicated in telomerase activity. Our findings support PAR as a proxy for an underlying whole-body aging mechanism. PAR may thus be useful to evaluate the efficacy of treatments that target aging-related deficits and controllable epidemiological factors.

Keywords: aging clock; machine learning; mortality; personalized medicine; physiological aging rate; quantitative trait.


Conflict of interest statement

CONFLICTS OF INTEREST: The authors have declared that no conflicts of interest exist that are related to the subject matter of the manuscript.

Figures

Figure 1
Figure 1
Predictive performance of machine learning models. (A) Comparison of the predictive performance measured by the coefficient of determination (R2) and mean absolute error (MAE) for all machine learning models investigated in the study. The random forest classifier (RFC) model was among the top-performing models. (B) Physiological aging rates were highly correlated between different models. Shown is a tileplot of R2 between PARs obtained from different models where darker green corresponds to higher values. (C) Physiological ages predicted by the RFC model were well-correlated with chronological ages of individuals in the SardiNIA study. (D) Physiological aging rate (PAR) of individuals obtained from the RFC model was weakly correlated with chronological age. All figures shown are for the baseline (W1) SardiNIA study. Similar results as in (C) and (D) were observed in follow-up waves of the SardiNIA study, for the elastic net regression model, and in the InCHIANTI study (see Supplementary Materials).
Figure 2
Figure 2
Physiological aging rates are associated with mortality. (A) Age-matched mortality analysis: 265 deceased participants were randomly paired with age- Matched ± 0.5 years) living participants in the baseline SardiNIA study. We calculated the difference in the mean PAR measurements of the two groups, ΔPAR = PARdeceased – PARliving and the corresponding p-value from a one-sided, one-sample t-test for ΔPAR > 0.The age-matched grouping was performed 10000 times and ΔPAR and p-values were calculated for each of the 10000 comparisons. 77.4% of the age-matched comparisons produced significantly greater than zero ΔPAR values (p < 0.05) and the mean ΔPAR across all comparisons was 0.016. Nearly all comparisons (>99%) had ΔPAR > 0, which indicated that PARdeceased > PARliving on average. (B) Randomized, age-matched control comparisons produced a 5.2% frequency of significantly greater than zero (p < 0.05) ΔPAR values and the mean ΔPAR was 0.00. Consistent with random assignment, 50.8% of the ΔPAR values were greater than zero. (C) Lifespans for individuals were negatively correlated with PARs (r = −0.491).
Figure 3
Figure 3
Correlation between epigenetic aging rate and physiological aging rate. Correlation between PAR and other aging rate measures. (A) Mean physiological aging rates (PARs) obtained from physiological age measurements were correlated (R2 = 0.362, r = 0.601) with the mean epigenetic aging rates (EARs) calculated for the same individuals across the baseline and latest follow-up InCHIANTI studies using the Horvath DNAm age. (B) Pearson correlation values between different pairings of aging rate measures including PAR, Horvath DNAm age, the Hannum DNAm age, GrimAge, rescaled PhenoAge, and the corrected KDM biological age with eight covariates.
Figure 4
Figure 4
Significant genetic loci obtained from genome-wide association study. (A) CFI/GAR1 was significantly associated with the physiological aging rate (PAR). CFI is a complement factor and has been linked to age-related macular degeneration and other age-related disorders. GAR1 is an accessory protein for the active telomerase complex and is an eQTL target of the top CFI/GAR1 SNPs. (B) LINC00202 was significantly associated with the PAR and corresponded to a long non-coding RNA that has been indirectly linked to age-related disease. Plots were made using LocusZoom (Pruim et al., 2010).
Figure 5
Figure 5
Top traits determined by three independent methods. (A) Volcano plot of the top traits in the full-trait model, which included pulse wave velocity (pwv), CCA intima media thickness (vasIMT), peak systolic velocity (vasPSV), diastolic CCA diameter (vasDiaDiam), waist circumference (exmWaist), and body mass index (exmBMI). Significant differences between the mean trait values of subjects in the top and bottom PAR quartiles were determined using a two-tailed students t-test on each trait. The dotted line corresponds to a Bonferroni-corrected threshold of p = 3.33 × 10⁻⁴ calculated from single-test threshold of p = 5.00 × 10⁻². Many top traits were also highly ranked in the common-trait model. (B) Traits rank-ordered by Pearson correlation (r) with physiological age measured using the full-trait RFC model. (C) Traits rank-ordered by approximate added value (R2) for the full-trait RFC model in SardiNIA (R2 = 0.858 with all traits used in model). Added value (R2) was averaged over 500 training-testing iterates for each trait. There was significant overlap in the highest ranked traits across all three scoring methods and between the common-trait and full-trait models (see Supplementary Materials). Trait names are as they appear in the SardiNIA study; descriptions of all traits are available in the Supplementary Materials.

References

    1. Medawar PB. An Unsolved Problem in Biology. HK Lewis Co. 1952.
    1. Baker GT 3rd, Sprott RL. Biomarkers of aging. Exp Gerontol. 1988; 23:223–39. 10.1016/0531-5565(88)90025-3 - DOI - PubMed
    1. Ferrucci L, Gonzalez-Freire M, Fabbri E, Simonsick E, Tanaka T, Moore Z, Salimi S, Sierra F, de Cabo R. Measuring biological aging in humans: A quest. Aging Cell. 2020; 19:e13080. 10.1111/acel.13080 - DOI - PMC - PubMed
    1. Sprott RL. Biomarkers of aging and disease: introduction and definitions. Exp Gerontol. 2010; 45:2–4. 10.1016/j.exger.2009.07.008 - DOI - PubMed
    1. Khan SS, Singer BD, Vaughan DE. Molecular and physiological manifestations and measurement of aging in humans. Aging Cell. 2017; 16:624–33. 10.1111/acel.12601 - DOI - PMC - PubMed

Publication types