. 2021 Oct 30;11(1):555.
doi: 10.1038/s41398-021-01695-y.

Lithium treatment and human hippocampal neurogenesis

Affiliations

Lithium treatment and human hippocampal neurogenesis

Alish B Palmos et al. Transl Psychiatry. .

Abstract

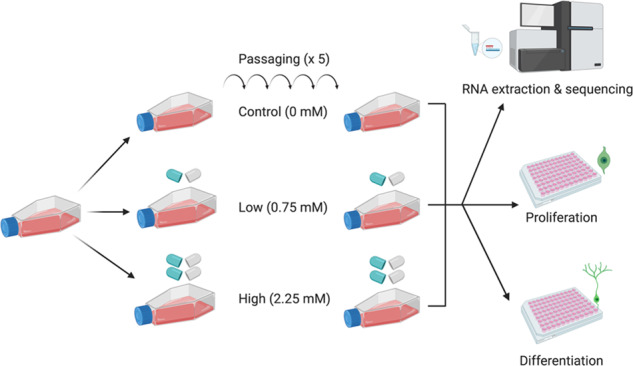
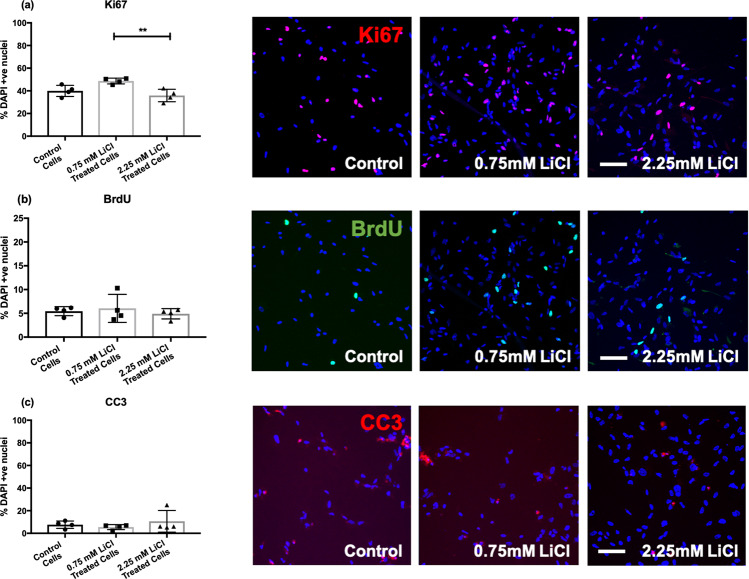
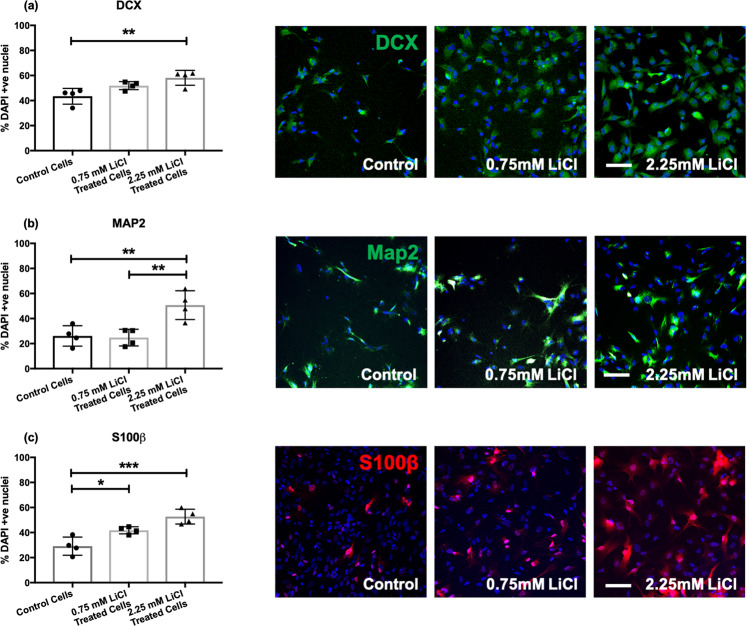
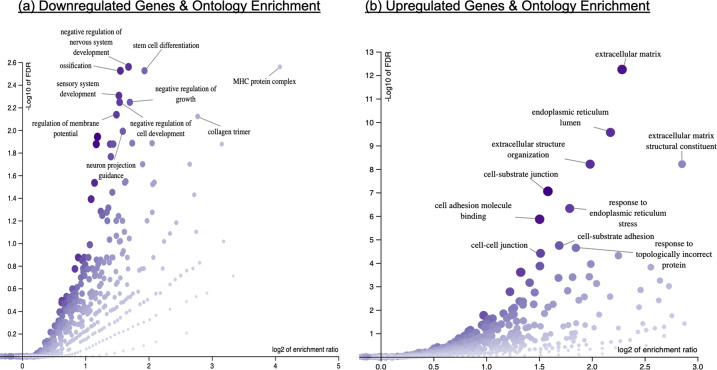
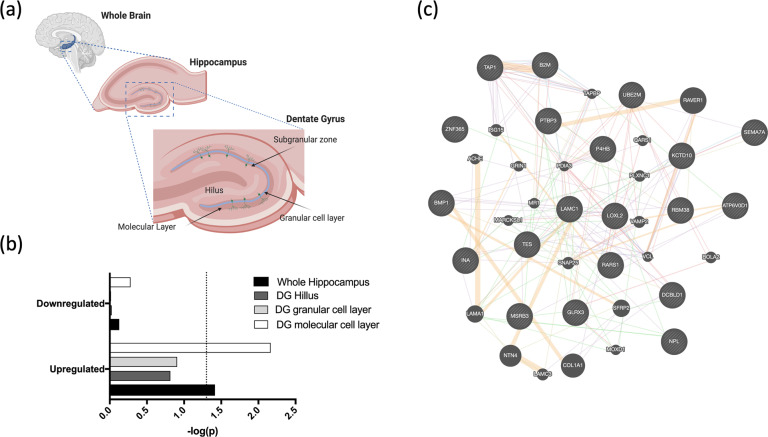
Lithium is a first-line treatment for bipolar disorder, where it acts as a mood-stabilizing agent. Although its precise mechanism remains unclear, neuroimaging studies have shown that lithium accumulates in the hippocampus and that chronic use amongst bipolar disorder patients is associated with larger hippocampal volumes. Here, we tested the chronic effects of low (0.75 mM) and high (2.25 mM) doses of lithium on human hippocampal progenitor cells and used immunocytochemistry to investigate the effects of lithium on cell parameters implicated in neurogenesis. Corresponding RNA-sequencing and gene-set enrichment analyses were used to evaluate whether genes affected by lithium in our model overlap with those regulating the volume of specific layers of the dentate gyrus. We observed that high-dose lithium treatment in human hippocampal progenitors increased the generation of neuroblasts (P ≤ 0.01), neurons (P ≤ 0.01), and glia (P ≤ 0.001), alongside the expression of genes, which regulate the volume of the molecular layer of the dentate gyrus. This study provides empirical support that adult hippocampal neurogenesis and gliogenesis are mechanisms that could contribute to the effects of lithium on human hippocampal volume.


Conflict of interest statement

The authors declare no competing interests.

Figures

Fig. 1
Fig. 1. A summary of our experimental protocol.
Cells were treated with control (0 mM), low (0.75 mM) or high (2.25 mM) doses of lithium across five passages (~15 days) and submitted to nucleic acid extraction and RNA-sequencing, a proliferation protocol, and adifferentiation protocol.
Fig. 2
Fig. 2. Bar charts showing the percentage of Ki67, BrdU, and CC3 positive cells in those treated chronically with a vehicle control (0 mM), low (0.75 mM), or high (2.25 mM) dose of lithium chloride.
The bar charts (left) show the percentage of Ki67 (a), BrdU (b), and CC3 (c) positive cells relative to the percentage of DAPI stained nuclei in control and lithium-treated cells. Bar heights correspond to means, and the standard errors of the mean (S.E.M.) are indicated. Each data point represents one biological replicate (N = 4). * represents an uncorrected P ≤ 0.05. ** represents an uncorrected P ≤ 0.01. *** represents an uncorrected P ≤ 0.001. Each of the images (right) are representative of a field of immuno-stained cells, taken using a 10X objective with the CellInsight High Content Screening Platform. Each image includes the nuclear marker DAPI in blue. Scale bar = 100 μm.
Fig. 3
Fig. 3. Bar charts showing the percentage of DCX, MAP2, and S100β positive cells in those treated chronically with a vehicle control (0 mM), low (0.75 mM), or high (2.25 mM) dose of lithium chloride.
The bar charts (left) show the percentage of DCX (a), MAP2 (b), and S100β (c) positive cells relative to the percentage of DAPI stained nuclei in control and lithium-treated cells. Each data point represents one biological replicate (N = 4). * represents P ≤ 0.05, ** represents P ≤ 0.01, and *** represents P ≤ 0.001, based on the result of Tukey’s post hoc tests. Each of the images (right) are representative of a field of immuno-stained cells, taken using a 10X objective with the CellInsight High Content Screening Platform. Each image includes the nuclear marker DAPI in blue. Scale bar = 100 μm.
Fig. 4
Fig. 4. Volcano plots illustrating significantly enriched gene ontology terms in response to high-dose lithium.
a GO terms significantly downregulated in response to high-dose lithium, (b) GO terms significantly upregulated in response to high-dose lithium.
Fig. 5
Fig. 5. Lithium’s effect on the expression of genes in hippocampal progenitors and its overlap with genes regulating the volume of the dentate gyrus.
a The anatomy of the hippocampus, including the dentate gyrus where adult neurogenesis occurs. b A bar chart illustrating the results from our gene-set enrichment analyses. Gene sets comprise of upregulated and downregulated genes (PFDR < 0.05) in response to the high lithium dose. These sets of genes were tested for overlap with those implicated in the regulation of whole hippocampal volume and the volume of dentate gyrus (DG) subfields where neurogenesis takes place. Stronger significance is indicated by a larger bar, and -log(p) value. The dashed line represents the nominal significance threshold (p = 0.05). The overlap between genes upregulated in response to lithium and those regulating the size of the molecular cell layer of the dentate gyrus was the only test that remained significant after multiple testing correction (PFDR < 0.1). c A gene network image generated using GeneMANIA. This describes genes significantly affected by lithium in our hippocampal progenitor cell model (PFDR < 0.05), which were also associated with volume in the molecular layer based on gene-level enrichment analyses (P < 0.05). Lines represent expected interactions between genes (orange = predicted interactions, purple = interactions based on co-expression, pink = physical interactions, blue = interactions based on colocalization, green = genetic interactions, yellow = shared protein domains). Genes input into GeneMANIA are represented by circles with diagonal lines, genes hypothetically interacting within this network are represented by solid circles. LAMC1 interacted with the most genes relative to other genes input into GeneMANIA, suggesting it might represent an important hub gene.

References

    1. Shorter E. The history of lithium therapy. Bipolar Disord. 2009;11(Suppl 2):4–9. doi: 10.1111/j.1399-5618.2009.00706.x. - DOI - PMC - PubMed
    1. Zanni G, Michno W, Di Martino E, Tjärnlund-Wolf A, Pettersson J, Mason CE, et al. Lithium accumulates in neurogenic brain regions as revealed by high resolution ion imaging. Sci Rep. 2017;7:40726. doi: 10.1038/srep40726. - DOI - PMC - PubMed
    1. Stout J, Hozer F, Coste A, Mauconduit F, Djebrani-Oussedik N, Sarrazin S, et al. Accumulation of lithium in the hippocampus of patients with bipolar disorder: a lithium-7 magnetic resonance imaging study at 7 tesla. Biol Psychiatry. 2020;88:426–33. - PubMed
    1. Leuner B, Gould E. Structural plasticity and hippocampal function. Annu Rev Psychol. 2010;61:111–40. doi: 10.1146/annurev.psych.093008.100359. - DOI - PMC - PubMed
    1. van Erp TG, Hibar DP, Rasmussen JM, Glahn DC, Pearlson GD, Andreassen OA, et al. Subcortical brain volume abnormalities in 2028 individuals with schizophrenia and 2540 healthy controls via the ENIGMA consortium. Mol Psychiatry. 2016;21:585. doi: 10.1038/mp.2015.118. - DOI - PMC - PubMed

Publication types

LinkOut - more resources