

Lipophagy deficiency exacerbates ectopic lipid accumulation and tubular cells injury in diabetic nephropathy
- PMID: 34718329
- PMCID: PMC8557213
- DOI: 10.1038/s41419-021-04326-y
Lipophagy deficiency exacerbates ectopic lipid accumulation and tubular cells injury in diabetic nephropathy
Abstract
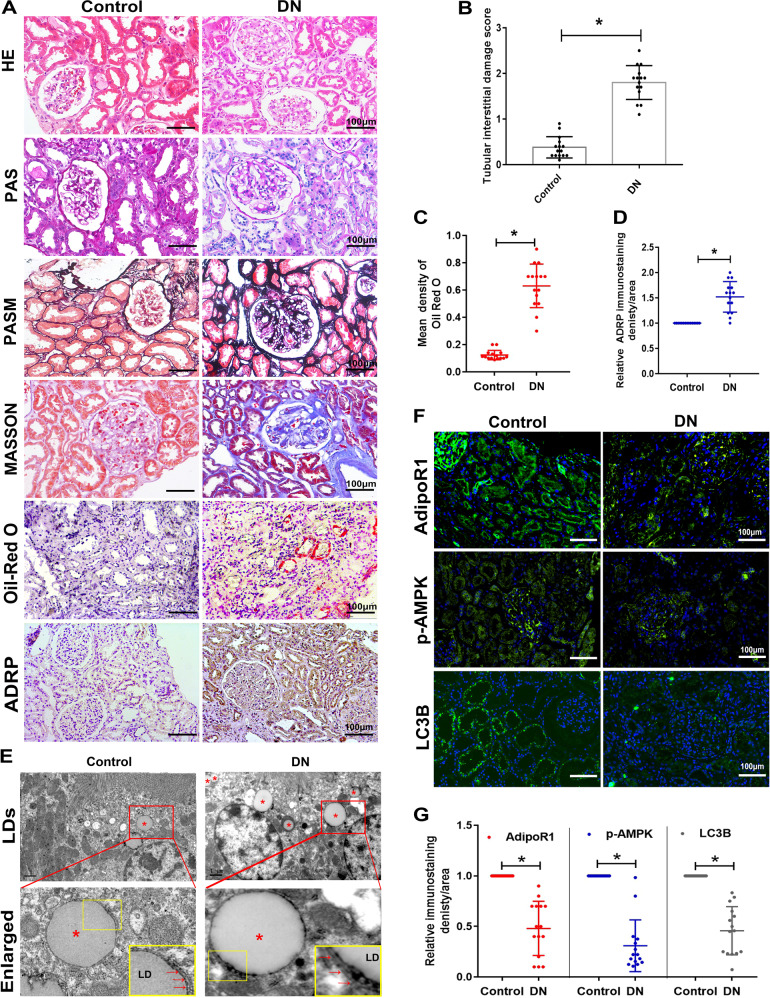
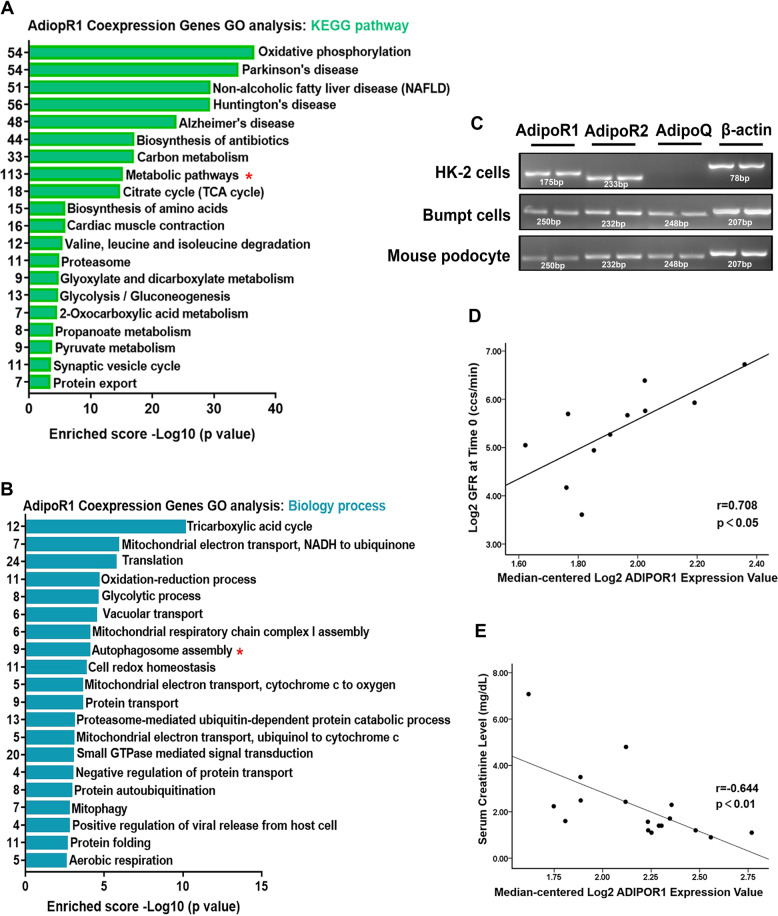
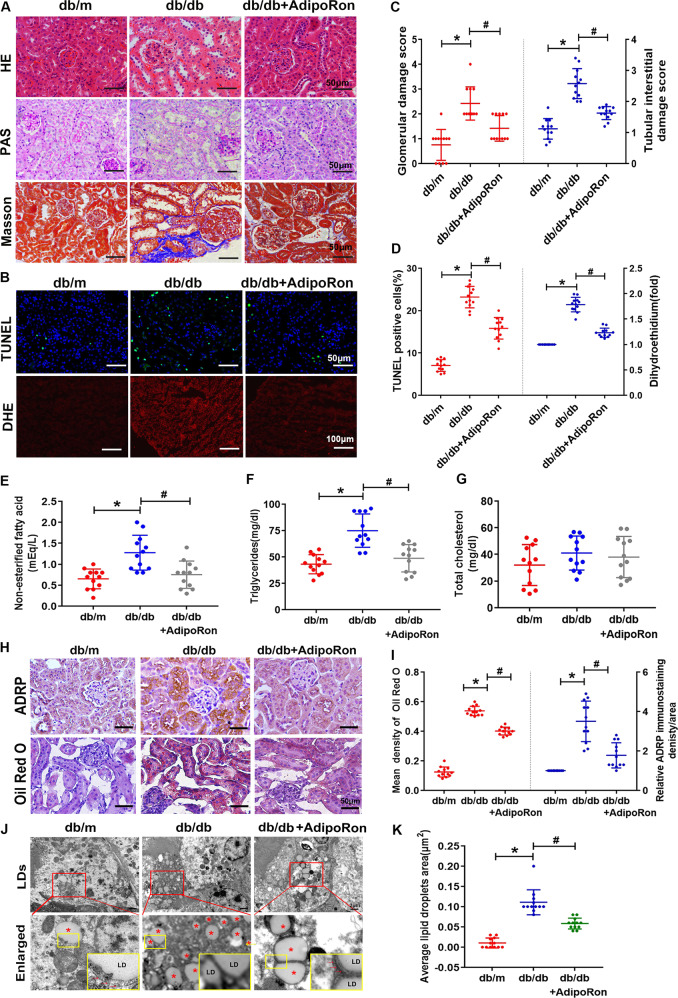
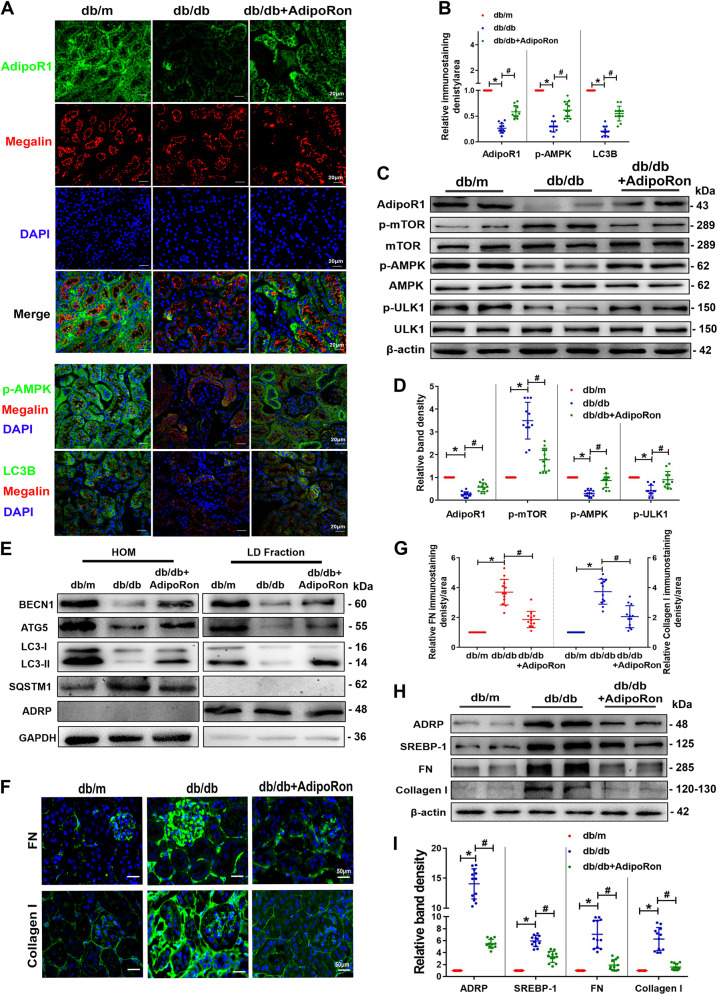
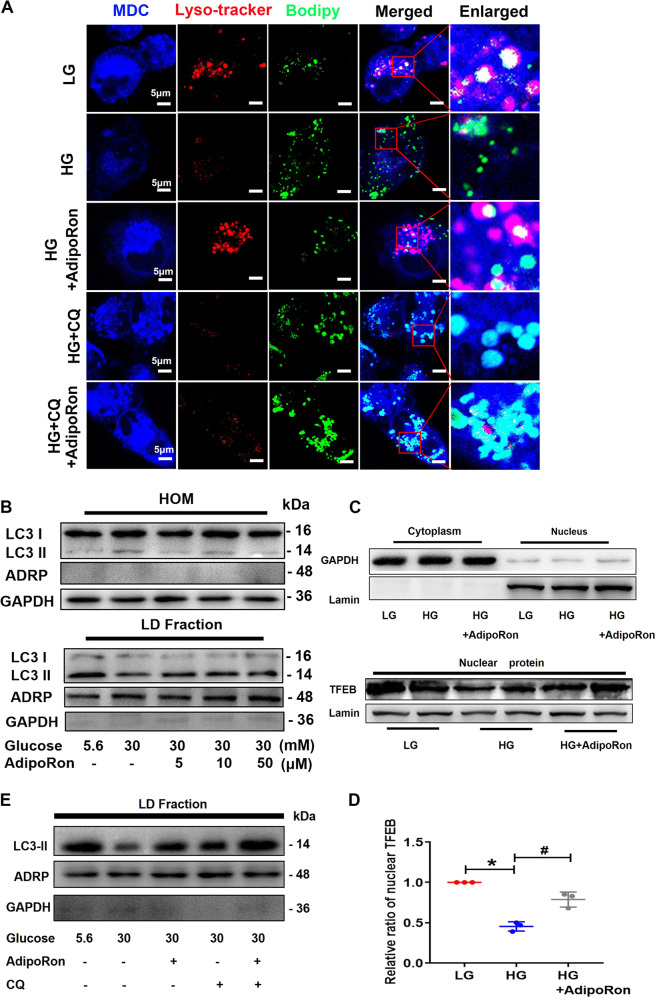
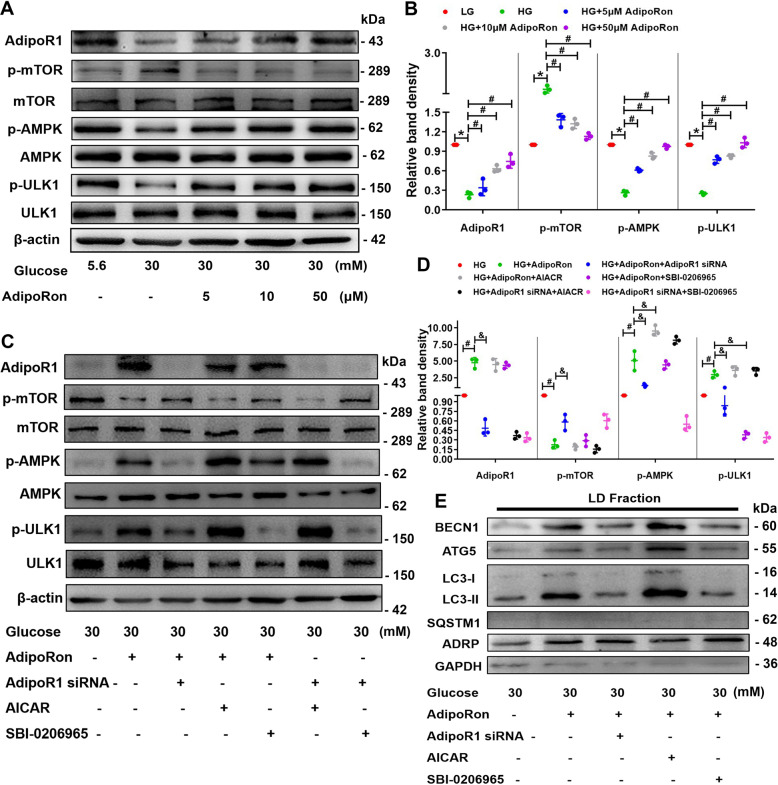
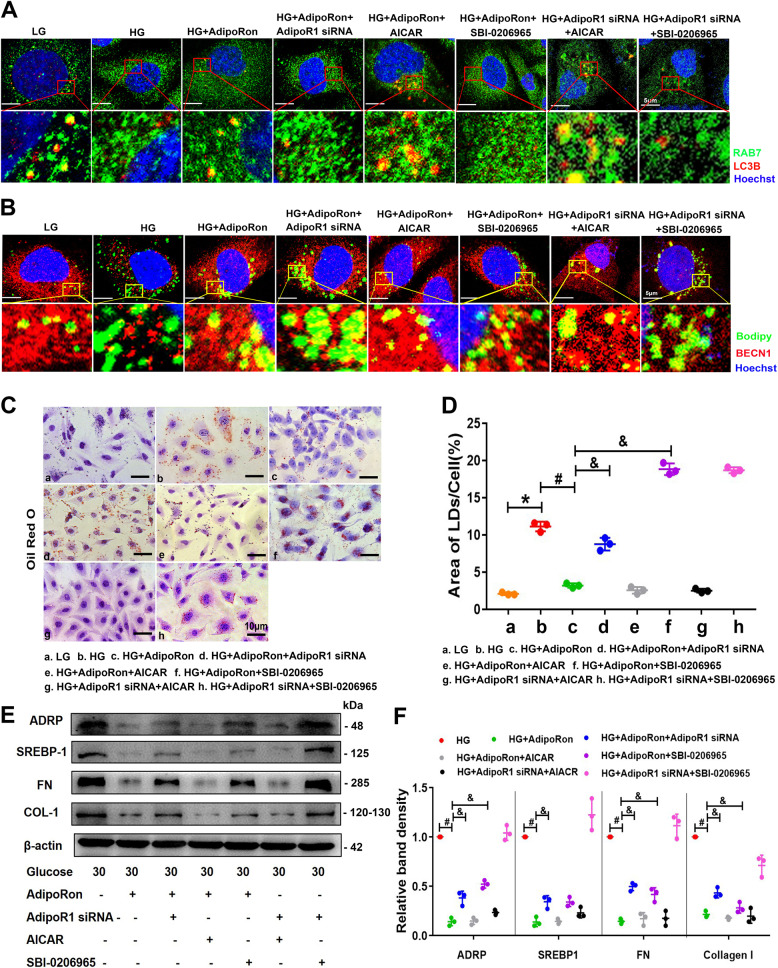
Autophagy-mediated lipotoxicity plays a critical role in the progression of diabetic nephropathy (DN), but the precise mechanism is not fully understood. Whether lipophagy, a selective type of autophagy participates in renal ectopic lipid deposition (ELD) and lipotoxicity in the kidney of DN is unknown. Here, decreased lipophagy, increased ELD and lipotoxcity were observed in tubular cells of patients with DN, which were accompanied with reduced expression of AdipoR1 and p-AMPK. Similar results were found in db/db mice, these changes were reversed by AdipoRon, an adiponectin receptor activator that promotes autophagy. Additionally, a significantly decreased level of lipophagy was observed in HK-2 cells, a human proximal tubular cell line treated with high glucose, which was consistent with increased lipid deposition, apoptosis and fibrosis, while were partially alleviated by AdipoRon. However, these effects were abolished by pretreatment with ULK1 inhibitor SBI-0206965, autophagy inhibitor chloroquine and enhanced by AMPK activator AICAR. These data suggested by the first time that autophagy-mediated lipophagy deficiency plays a critical role in the ELD and lipid-related renal injury of DN.
© 2021. The Author(s).
Conflict of interest statement
The authors declare no competing interests.
Figures
Similar articles
-
The Adiponectin Receptor Agonist AdipoRon Ameliorates Diabetic Nephropathy in a Model of Type 2 Diabetes.J Am Soc Nephrol. 2018 Apr;29(4):1108-1127. doi: 10.1681/ASN.2017060627. Epub 2018 Jan 12. J Am Soc Nephrol. 2018. PMID: 29330340 Free PMC article.
-
Liraglutide attenuates renal tubular ectopic lipid deposition in rats with diabetic nephropathy by inhibiting lipid synthesis and promoting lipolysis.Pharmacol Res. 2020 Jun;156:104778. doi: 10.1016/j.phrs.2020.104778. Epub 2020 Apr 2. Pharmacol Res. 2020. PMID: 32247822
-
Adiponectin receptor agonist AdipoRon decreased ceramide, and lipotoxicity, and ameliorated diabetic nephropathy.Metabolism. 2018 Aug;85:348-360. doi: 10.1016/j.metabol.2018.02.004. Epub 2018 Feb 17. Metabolism. 2018. PMID: 29462574
-
Paeonol ameliorates diabetic nephropathy by promoting TFEB-mediated lysosome biogenesis and lipophagy.Phytomedicine. 2025 Jul 25;143:156901. doi: 10.1016/j.phymed.2025.156901. Epub 2025 May 24. Phytomedicine. 2025. PMID: 40466504
-
[Role of lipophagy in the regulation of lipid metabolism and the molecular mechanism].Nan Fang Yi Ke Da Xue Xue Bao. 2019 Jul 30;39(7):867-874. doi: 10.12122/j.issn.1673-4254.2019.07.19. Nan Fang Yi Ke Da Xue Xue Bao. 2019. PMID: 31340923 Free PMC article. Review. Chinese.
Cited by
-
Molecular Modulators and Receptors of Selective Autophagy: Disease Implication and Identification Strategies.Int J Biol Sci. 2024 Jan 1;20(2):751-764. doi: 10.7150/ijbs.83205. eCollection 2024. Int J Biol Sci. 2024. PMID: 38169614 Free PMC article. Review.
-
Autophagy and its therapeutic potential in diabetic nephropathy.Front Endocrinol (Lausanne). 2023 Mar 20;14:1139444. doi: 10.3389/fendo.2023.1139444. eCollection 2023. Front Endocrinol (Lausanne). 2023. PMID: 37020591 Free PMC article. Review.
-
Targeting programmed cell death in diabetic kidney disease: from molecular mechanisms to pharmacotherapy.Mol Med. 2024 Dec 20;30(1):265. doi: 10.1186/s10020-024-01020-5. Mol Med. 2024. PMID: 39707216 Free PMC article. Review.
-
SIRT6's function in controlling the metabolism of lipids and glucose in diabetic nephropathy.Front Endocrinol (Lausanne). 2023 Oct 9;14:1244705. doi: 10.3389/fendo.2023.1244705. eCollection 2023. Front Endocrinol (Lausanne). 2023. PMID: 37876546 Free PMC article. Review.
-
Unraveling the rationale and conducting a comprehensive assessment of AdipoRon (adiponectin receptor agonist) as a candidate drug for diabetic nephropathy and cardiomyopathy prevention and intervention-a systematic review.Naunyn Schmiedebergs Arch Pharmacol. 2025 Jan;398(1):165-177. doi: 10.1007/s00210-024-03362-7. Epub 2024 Aug 13. Naunyn Schmiedebergs Arch Pharmacol. 2025. PMID: 39136737
References
Publication types
MeSH terms
Substances
Grants and funding
LinkOut - more resources
Full Text Sources
Medical
Miscellaneous
