. 2022 Jan 1;163(1):bqab225.
doi: 10.1210/endocr/bqab225.

Developmental Programming: Prenatal Testosterone Excess on Liver and Muscle Coding and Noncoding RNA in Female Sheep

Affiliations

Developmental Programming: Prenatal Testosterone Excess on Liver and Muscle Coding and Noncoding RNA in Female Sheep

Nadia Saadat et al. Endocrinology. .

Abstract

Prenatal testosterone (T)-treated female sheep manifest peripheral insulin resistance, ectopic lipid accumulation, and insulin signaling disruption in liver and muscle. This study investigated transcriptional changes and transcriptome signature of prenatal T excess-induced hepatic and muscle-specific metabolic disruptions. Genome-wide coding and noncoding (nc) RNA expression in liver and muscle from 21-month-old prenatal T-treated (T propionate 100 mg intramuscular twice weekly from days 30-90 of gestation; term: 147 days) and control females were compared. Prenatal T (1) induced differential expression of messenger RNAs (mRNAs) in liver (15 down, 17 up) and muscle (66 down, 176 up) (false discovery rate < 0.05, absolute log2 fold change > 0.5); (2) downregulated mitochondrial pathway genes in liver and muscle; (3) downregulated hepatic lipid catabolism and peroxisome proliferator-activated receptor (PPAR) signaling gene pathways; (4) modulated noncoding RNA (ncRNA) metabolic processes gene pathway in muscle; and (5) downregulated 5 uncharacterized long noncoding RNA (lncRNA) in the muscle but no ncRNA changes in the liver. Correlation analysis showed downregulation of lncRNAs LOC114112974 and LOC105607806 was associated with decreased TPK1, and LOC114113790 with increased ZNF470 expression. Orthogonal projections to latent structures discriminant analysis identified mRNAs HADHA and SLC25A45, and microRNAs MIR154A, MIR25, and MIR487B in the liver and ARIH1 and ITCH and miRNAs MIR369, MIR10A, and MIR10B in muscle as potential biomarkers of prenatal T excess. These findings suggest downregulation of mitochondria, lipid catabolism, and PPAR signaling genes in the liver and dysregulation of mitochondrial and ncRNA gene pathways in muscle are contributors of lipotoxic and insulin-resistant hepatic and muscle phenotype. Gestational T excess programming of metabolic dysfunctions involve tissue-specific ncRNA-modulated transcriptional changes.

Keywords: DOHAD; RNA sequencing; metabolic tissues; ovine.


Figures

Figure 1.
Figure 1.
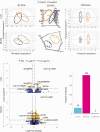
Coding RNA sample clustering and tissue-specific enrichment in control animals. Principal component analysis (PCA) 2-dimensional (2D) and 3-dimensional (3D) score plots and orthogonal partial least square discriminant analysis (OPLS-DA) score plots for the liver and muscle from control animals are shown at the top. For the PCA the 2D and 3D plots are plotted with principal component 1 on the x axis and principal component 2 on the y axis, and for the OPLS-DA score plot with predictive component on the x axis and first orthogonal component on the y axis, showing separation between the liver (brown) and muscle (pink) from control animals. Each point represents one animal. The volcano plot showing differential gene expression comparing liver and muscle in control animals are shown at the bottom left. Genes are plotted by log2 fold change and –log10 adjusted P values. The orange points represent genes that have an absolute log2 fold change greater than 0.5 and false discovery rate (FDR) less than 0.05. Heat map of differentially regulated gene pathways across both liver and muscle at FDR less than 0.01 are shown at the bottom right.
Figure 2.
Figure 2.
Coding RNA sample clustering and differential expression in liver and muscle from prenatal testosterone (T)-treated animals. The 2-dimensional (2D) and 3-dimensional (3D) principal component analysis (PCA) and orthogonal partial least square discriminant analysis (OPLS-DA) score plots showing groupings and separation between control (blue) and prenatal T-treated (orange) groups in the coding RNA from liver and muscle tissue are shown at the top. For the PCA the 2D and 3D plots are plotted with principal component 1 on the x axis and principal component 2 on the y axis, and for the OPLS-DA score plot with predictive component on the x axis and first orthogonal component on the y axis with each point representing one animal. The volcano plot showing differential gene expression in the liver or muscle comparing prenatal T-treated animals against control animals are shown at the bottom left. Genes are plotted by log2 fold change on the x axis and –log10 P adjusted values on the y axis. Orange points denote the genes that have an absolute log2 fold change greater than 0.5 and P adjusted values less than .05. Black dots represent genes that did not meet P-adjusted cutoff of less than .05 and absolute log2 fold change greater than .5, and blue dots represent genes that met the absolute log2 fold change greater than 0.5 but did not meet the P-adjusted cutoff of less than .05. The bar plots at the bottom right represent the number of genes differentially modulated that are unique to either liver and muscle or common to both tissues.
Figure 3.
Figure 3.
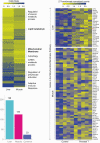
Functional enrichment of pathways enriched in liver and muscle and expression levels of genes in commonly dysregulated pathways. Heat map (top left) representing the differentially regulated gene pathways in liver and muscle from prenatal testosterone (T)-treated animals compared against control animals and enriched at a false discovery rate (FDR) of less than 0.01. The bar plots (bottom left) represent the number of gene pathways differentially modulated that are unique to either liver and muscle or commonly dysregulated in both tissues. Heat map (right) showing genes involved in the mitochondrial membrane pathway that is dysregulated both in liver (C = 4, T = 5) and muscle (C = 5, T = 5). The genes associated with the gene pathway in controls animals and prenatal T–treated animals are plotted along a gradient of colors, with blue representing the highest and yellow the lowest normalized counts.
Figure 4.
Figure 4.
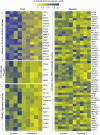
Expression levels of genes in dysregulated pathways enriched in either liver or muscle. Heat map showing genes involved in the lipid and triglyceride catabolism and peroxisome proliferator-activated receptor γ (PPARG) signaling in the liver (left; C = 4, T = 5) and noncoding RNA (ncRNA) metabolic process in the muscle (right; C = 5, T = 5) that are dysregulated in a tissue-specific manner by prenatal testosterone (T) treatment at a false discovery rate of less than 0.01. The genes associated with pathways in each tissue from control and prenatal T-treated animals are represented as a gradient of colors with blue representing the highest and yellow representing the lowest normalized counts.
Figure 5.
Figure 5.
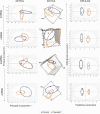
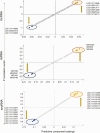
Liver or muscle specific prenatal testosterone (T)-induced transcriptional signatures. The orthogonal partial least square discriminant analysis (OPLS-DA) plots for coding RNA from liver (top) and muscle (bottom) showing potential biomarkers of prenatal T-treatment. The up and down arrow represents the upregulated and downregulated genes with prenatal T-treatment, respectively. Each point represents one RNA with orange and blue points representing the potential biomarkers of prenatal T-treatment that are upregulated and downregulated, respectively.
Figure 6.
Figure 6.
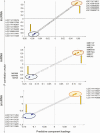
Variable importance in the projection (VIP) for predictive component plots. Plots showing the VIP for total RNA in liver (top) and muscle (bottom). The plots are plotted with chromosome identification on the x axis (each color representing a chromosome) and VIP values on the y axis. The higher VIP value indicates high importance to the model and is responsible for the separation of prenatal T and control animals on the orthogonal partial least square discriminant analysis (OPLS-DA) score plot. The top 30 genes-based VIP values are listed on the right side of the plots.
Figure 7.
Figure 7.
Clustering and orthogonal partial least square discriminant analysis (OPLS-DA) plots for noncoding RNA in the liver. The 2-dimensional (2D) and 3-dimensional (3D) principal component analysis (PCA) and OPLS-DA score plots for long noncoding RNA (lncRNA), microRNA (miRNA), small nucleolar RNA (snoRNA), and small nuclear RNA (snRNA) in liver from control (blue) and prenatal testosterone (T)-treated (orange) animals. For the PCA the 2D and 3D plots are plotted with principal component 1 on the x axis and principal component 2 on the y axis, and for the OPLS-DA score plot with predictive component on the x axis and first orthogonal component on the y axis with each point representing one animal.
Figure 8.
Figure 8.
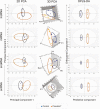
Prenatal testosterone (T) treatment–altered liver–specific noncoding RNA (ncRNA) potential biomarkers. The orthogonal partial least square discriminant analysis (OPLS-DA) plots for ncRNA (long noncoding RNA [lncRNA], microRNA [miRNA], and small nucleolar RNA [snoRNA]) from liver showing potential biomarkers of prenatal T-treatment. The up and down arrows represent the upregulated and downregulated genes with prenatal T treatment, respectively. Each point represents a noncoding RNA with orange and blue points representing the potential biomarkers of prenatal T treatment that are upregulated and downregulated, respectively.
Figure 9.
Figure 9.
Clustering and orthogonal partial least square discriminant analysis (OPLS-DA) plots for noncoding RNA (ncRNA) in muscle. The 2-dimensional (2D) and 3-dimensional (3D) principal component analysis (PCA) and OPLS-DA score plots for long noncoding RNA (lncRNA), microRNA (miRNA), small nucleolar RNA (snoRNA), and small nuclear RNA (snRNA) in muscle from control (blue) and prenatal testosterone (T)-treated (orange) animals. For the PCA the 2D and 3D plots are plotted with principal component 1 on the x axis and principal component 2 on the y axis, and for the OPLS-DA score plot with predictive component on the x axis and first orthogonal component on the y axis with each point representing one animal.
Figure 10.
Figure 10.
Prenatal testosterone (T) treatment–altered muscle-specific noncoding RNA (ncRNA) potential biomarkers. The orthogonal partial least square discriminant analysis (OPLS-DA) S plots for ncRNA (long noncoding RNA [lncRNA], microRNA [miRNA], and small nucleolar RNA [snoRNA]) from muscle showing potential biomarkers of prenatal T treatment. The up and down arrows represent the upregulated and downregulated genes with prenatal T treatment, respectively. Each point represents an ncRNA with orange and blue points representing the potential biomarkers of prenatal T treatment that are upregulated and downregulated, respectively.
Figure 11.
Figure 11.
Correlation of coding and noncoding RNA (ncRNA) expression in muscle from prenatal testosterone (T)-treated animals. Box plots representing the average normalized counts for long noncoding RNA (lncRNA) and messenger RNA (mRNA) pairs that showed significant correlation are shown on the left. The treatment groups—control (C) or prenatal T (T)—are denoted on the x axis and the average normalized counts and fold change vs C on the y axis are denoted by RNA sequencing (RNA-seq) and quantitative polymerase chain reaction (qPCR; gray-shaded box) analyses, respectively. The line plots representing the correlation of expression between the lncRNA-mRNA in treatment group are shown at right. Correlation between lncRNA-mRNA for each pair is represented in orange line for C animals and as a green line for prenatal T-treated animals.
Figure 12.
Figure 12.
Validation of RNA sequencing (RNA-seq)-determined differential gene expression in liver from prenatal testosterone (T)-treated sheep. Histograms representing the average fold change for messenger RNA (mRNA) from RNA-seq and quantitative polymerase chain reaction (qPCR) analysis. The treatment groups—control (C) or prenatal T (T)—are denoted on the x axis and the average normalized counts and fold change vs C on the y axis are denoted by RNA-seq and qPCR (gray-shaded box) analyses, respectively, at the top left. Lipid accumulation from oil red O staining and triglyceride assay and collagen deposition by collagen assay and picrosirius red staining from C and T animals are shown at the top right. The data from the larger cohort for some of these genes, lipid accumulation, and collagen deposition were previously published (13, 31, 32). The gene expression changes in prenatal T-treated animals from qPCR and RNA-seq analysis and its link with systemic and hepatic specific changes are summarized (bottom).

Similar articles

Cited by

References

    1. Barker DJ. Fetal origins of coronary heart disease. BMJ. 1995;311(6998):171-174. - PMC - PubMed
    1. Heindel JJ, Newbold R, Schug TT. Endocrine disruptors and obesity. Nat Rev Endocrinol. 2015;11(11):653-661. - PubMed
    1. Padmanabhan V, Cardoso RC, Puttabyatappa M. Developmental programming, a pathway to disease. Endocrinology. 2016;157(4):1328-1340. - PMC - PubMed
    1. Moisiadis VG, Matthews SG. Glucocorticoids and fetal programming part 1: outcomes. Nat Rev Endocrinol. 2014;10(7):391-402. - PubMed
    1. Stener-Victorin E, Padmanabhan V, Walters KA, et al. . Animal models to understand the etiology and pathophysiology of polycystic ovary syndrome. Endocr Rev. 2020;41(4):538-576. - PMC - PubMed

Publication types

MeSH terms