

Estimated SARS-CoV-2 infection rate and fatality risk in Gauteng Province, South Africa: a population-based seroepidemiological survey
- PMID: 34718591
- PMCID: PMC8689871
- DOI: 10.1093/ije/dyab217
Estimated SARS-CoV-2 infection rate and fatality risk in Gauteng Province, South Africa: a population-based seroepidemiological survey
Abstract
Background: Limitations in laboratory testing capacity undermine the ability to quantify the overall burden of severe acute respiratory syndrome coronavirus-2 (SARS-CoV-2) infection.
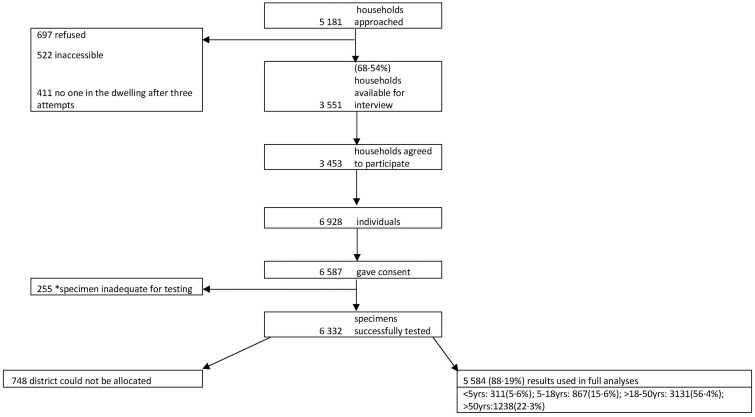
Methods: We undertook a population-based serosurvey for SARS-CoV-2 infection in 26 subdistricts, Gauteng Province (population 15.9 million), South Africa, to estimate SARS-CoV-2 infection, infection fatality rate (IFR) triangulating seroprevalence, recorded COVID-19 deaths and excess-mortality data. We employed three-stage random household sampling with a selection probability proportional to the subdistrict size, stratifying the subdistrict census-sampling frame by housing type and then selecting households from selected clusters. The survey started on 4 November 2020, 8 weeks after the end of the first wave (SARS-CoV-2 nucleic acid amplification test positivity had declined to <10% for the first wave) and coincided with the peak of the second wave. The last sampling was performed on 22 January 2021, which was 9 weeks after the SARS-CoV-2 resurgence. Serum SARS-CoV-2 receptor-binding domain (RBD) immunoglobulin-G (IgG) was measured using a quantitative assay on the Luminex platform.
Results: From 6332 individuals in 3453 households, the overall RBD IgG seroprevalence was 19.1% [95% confidence interval (CI): 18.1-20.1%] and similar in children and adults. The seroprevalence varied from 5.5% to 43.2% across subdistricts. Conservatively, there were 2 897 120 (95% CI: 2 743 907-3 056 866) SARS-CoV-2 infections, yielding an infection rate of 19 090 per 100 000 until 9 January 2021, when 330 336 COVID-19 cases were recorded. The estimated IFR using recorded COVID-19 deaths (n = 8198) was 0.28% (95% CI: 0.27-0.30) and 0.67% (95% CI: 0.64-0.71) assuming 90% of modelled natural excess deaths were due to COVID-19 (n = 21 582). Notably, 53.8% (65/122) of individuals with previous self-reported confirmed SARS-CoV-2 infection were RBD IgG seronegative.
Conclusions: The calculated number of SARS-CoV-2 infections was 7.8-fold greater than the recorded COVID-19 cases. The calculated SARS-CoV-2 IFR varied 2.39-fold when calculated using reported COVID-19 deaths (0.28%) compared with excess-mortality-derived COVID-19-attributable deaths (0.67%). Waning RBD IgG may have inadvertently underestimated the number of SARS-CoV-2 infections and conversely overestimated the mortality risk. Epidemic preparedness and response planning for future COVID-19 waves will need to consider the true magnitude of infections, paying close attention to excess-mortality trends rather than absolute reported COVID-19 deaths.
Keywords: COVID-19; SARS-CoV-2; coronavirus; infection-mortality risk; seroprevalence; serosurvey.
© The Author(s) 2021. Published by Oxford University Press on behalf of the International Epidemiological Association.
Figures


References
-
- United Nations Department of Economic and Social Affairs. World Population Prospects 2019, Volume I: Comprehensive Tables (ST/ESA/SER.A/426). 2019. https://population.un.org/wpp/Publications/Files/WPP2019_Volume-I_Compre... (30 April, 2021, date last accessed).
-
- World Health Organization. Coronavirus (COVID-19) Dashboard. 2021. https://covid19.who.int/ (30 April 2021, date last accessed).
-
- Our World in Data. Total COVID-19 Tests per 1,000 People. 2021. https://ourworldindata.org/coronavirus-testing#how-many-tests-are-perfor....
-
- World Health Organization. Population-based Age-stratified Seroepidemiological Investigation Protocol for COVID-19 Virus Infection. WHO, 2020. . https://apps.who.int/iris/handle/10665/331656 (30 April 2021, date last accessed).
Publication types
MeSH terms
Substances
LinkOut - more resources
Full Text Sources
Medical
Miscellaneous
