. 2022 Feb 17;107(3):e1009-e1019.
doi: 10.1210/clinem/dgab792.

No Evidence of Long-Term Disruption of Glycometabolic Control After SARS-CoV-2 Infection

Affiliations

No Evidence of Long-Term Disruption of Glycometabolic Control After SARS-CoV-2 Infection

Andrea Laurenzi et al. J Clin Endocrinol Metab. .

Abstract

Purpose: To assess whether dysglycemia diagnosed during severe acute respiratory syndrome coronavirus 2 pneumonia may become a potential public health problem after resolution of the infection. In an adult cohort with suspected coronavirus disease 2019 (COVID-19) pneumonia, we integrated glucose data upon hospital admission with fasting blood glucose (FBG) in the year prior to COVID-19 and during postdischarge follow-up.

Methods: From February 25 to May 15, 2020, 660 adults with suspected COVID-19 pneumonia were admitted to the San Raffaele Hospital (Milan, Italy). Through structured interviews/ medical record reviews, we collected demographics, clinical features, and laboratory tests upon admission and additional data during hospitalization or after discharge and in the previous year. Upon admission, we classified participants according to American Diabetes Association criteria as having (1) preexisting diabetes, (2) newly diagnosed diabetes, (3) hyperglycemia not in the diabetes range, or (4) normoglycemia. FBG prior to admission and during follow-up were classified as normal or impaired fasting glucose and fasting glucose in the diabetes range.

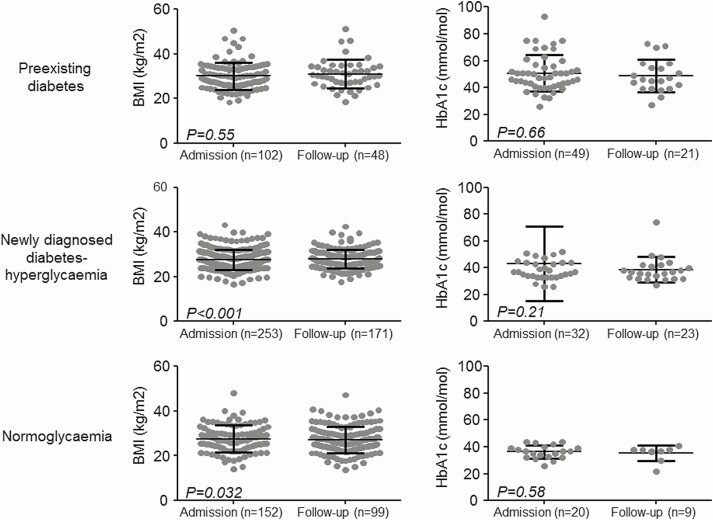
Results: In patients with confirmed COVID (n = 589), the proportion with preexisting or newly diagnosed diabetes, hyperglycemia not in the diabetes range and normoglycemia was 19.6%, 6.7%, 43.7%, and 30.0%, respectively. Patients with dysglycemia associated to COVID-19 had increased markers of inflammation and organs' injury and poorer clinical outcome compared to those with normoglycemia. After the infection resolved, the prevalence of dysglycemia reverted to preadmission frequency.

Conclusions: COVID-19-associated dysglycemia is unlikely to become a lasting public health problem. Alarmist claims on the diabetes risk after COVID-19 pneumonia should be interpreted with caution.

Keywords: COVID-19; diabetes; humans.


Figures

Figure 1.
Figure 1.
Dysglycemia associated with severe acute respiratory syndrome coronavirus 2 (SARS-CoV-2) infection. We analyzed a series of 586 cases with confirmed coronavirus disease 2019 (COVID-19; COVID cohort) and 74 cases in which SARS-CoV-2 infection was excluded (No-COVID cohort). (A) Glucose abnormalities at hospital admission. Bar plots represent the proportion of individuals with diabetes (either preexisting or newly diagnosed), hyperglycemia not in the diabetes range and normoglycemia in the COVID-19 cohort and No-COVID cohort. (B and C) Mean glycated hemoglobin levels and mean peak blood glucose levels were summarized for patients with diabetes (either preexisting or newly diagnosed), hyperglycemia not in the diabetes range, and normoglycemia. Scatterplots show the mean ± SD; the error bars represent the SD, and each dot represents an individual patient. (D) Kaplan-Meyer time-to-event analysis for survival without adverse clinical outcome in the three patient groups. Log-rank (Mantel-Cox) test. (E) Forest plot of the hazard ratio for diseases severity (composite endpoint of admission to the intensive care unit or death, whichever occurred first) in the 3 patient groups. Sex-and age-adjusted multivariate Cox proportional hazards model including body mass index, creatinine, hypertension, cardiovascular disease, lactate dehydrogenase, C-reactive protein, and white blood cells. (F) Time to hospital discharge in the 3 patient groups. Scatterplots show the mean ± SD; the error bars represent the SD, with each dot representing an individual patient. (B, C, and E) One-way analysis of variance with Bonferroni correction.
Figure 2.
Figure 2.
Biochemistry at admission according to glucose abnormalities. Routine blood tests encompassed serum biochemistry [including serum creatinine and lactate dehydrogenase (LDH)], complete blood count with differential, inflammation markers [C-reactive protein (CRP), ferritin, interleukin-6 (IL-6)], and D-dimer. Scatterplots show the median; the error bars represent the interquartile range, and each dot represents an individual patient. Kruskal-Wallis with Dunn’s correction was used for comparison between groups.
Figure 3.
Figure 3.
Glucose abnormalities and fasting blood glucose before admission and after discharge stratified by dysglycemia at the time of coronavirus disease 2019 (COVID-19) hospitalization in the COVID cohort. Left panels: For each glucose abnormality at the time of hospital admission for COVID-19 we show glucose abnormalities before admission and at last follow-up for the COVID cohort. Bar plots represents the proportion of individuals with normal fasting glucose (NFG), impaired fasting glucose (IFG) and fasting glucose in the diabetes range (DFG), defined according to American Diabetes Association criteria. Right panels: fasting blood glucose (FBG) before admission, during hospitalization (admission), and at last follow-up. In the scatterplots each dots represents an individual patient, the horizontal line is the mean, the error bars represent the SD. Paired t-test was used to compare time points.
Figure 4.
Figure 4.
Body mass index (BMI) and glycated hemoglobin at admission and after discharge stratified by dysglycemia at the time of coronavirus disease 2019 (COVID-19) hospitalization in the COVID cohort. BMI and glycated hemoglobin at hospital admission and at last follow-up. In the scatterplots each dots represents an individual patient, the horizontal line is the mean; the error bars represent the SD. Paired t-test was used to compare time points.

References

    1. Mantovani A, Byrne CD, Zheng MH, Targher G. Diabetes as a risk factor for greater COVID-19 severity and in-hospital death: a meta-analysis of observational studies. Nutr Metab Cardiovasc Dis. 2020;30(8):1236-1248. - PMC - PubMed
    1. Hussain S, Baxi H, Chand Jamali M, Nisar N, Hussain MS. Burden of diabetes mellitus and its impact on COVID-19 patients: a meta-analysis of real-world evidence. Diabetes Metab Syndr. 2020;14(6):1595-1602. - PMC - PubMed
    1. Figliozzi S, Masci PG, Ahmadi N, et al. . Predictors of adverse prognosis in COVID-19: a systematic review and meta-analysis. Eur J Clin Invest. 2020;50(10):e13362. - PubMed
    1. Aggarwal G, Lippi G, Lavie CJ, Henry BM, Sanchis-Gomar F. Diabetes mellitus association with coronavirus disease 2019 (COVID-19) severity and mortality: a pooled analysis. J Diabetes. 2020;12(11):851-855. - PMC - PubMed
    1. Lee MH, Wong C, Ng CH, Yuen DC, Lim AY, Khoo CM. Effects of hyperglycaemia on complications of COVID-19: a meta-analysis of observational studies. Diabetes Obes. Metab. 2021;23(1):287-289. - PubMed

Publication types