. 2022 Jan 20;34(1):455-476.
doi: 10.1093/plcell/koab260.

Misregulation of MYB16 expression causes stomatal cluster formation by disrupting polarity during asymmetric cell divisions

Affiliations

Misregulation of MYB16 expression causes stomatal cluster formation by disrupting polarity during asymmetric cell divisions

Shao-Li Yang et al. Plant Cell. .

Abstract

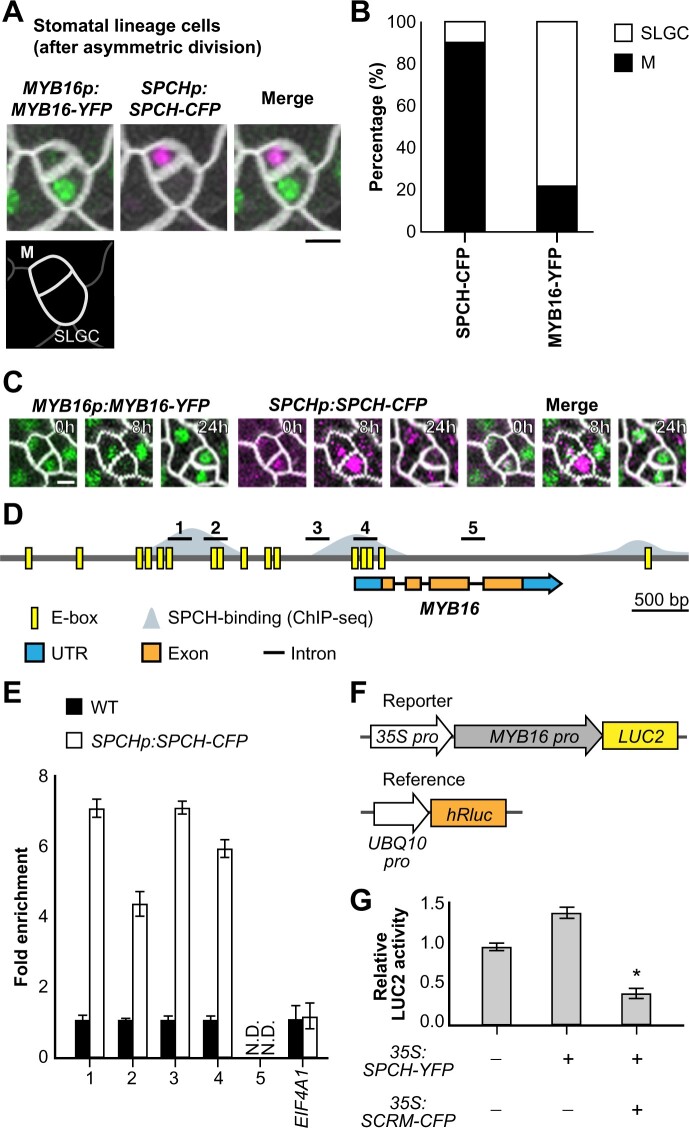
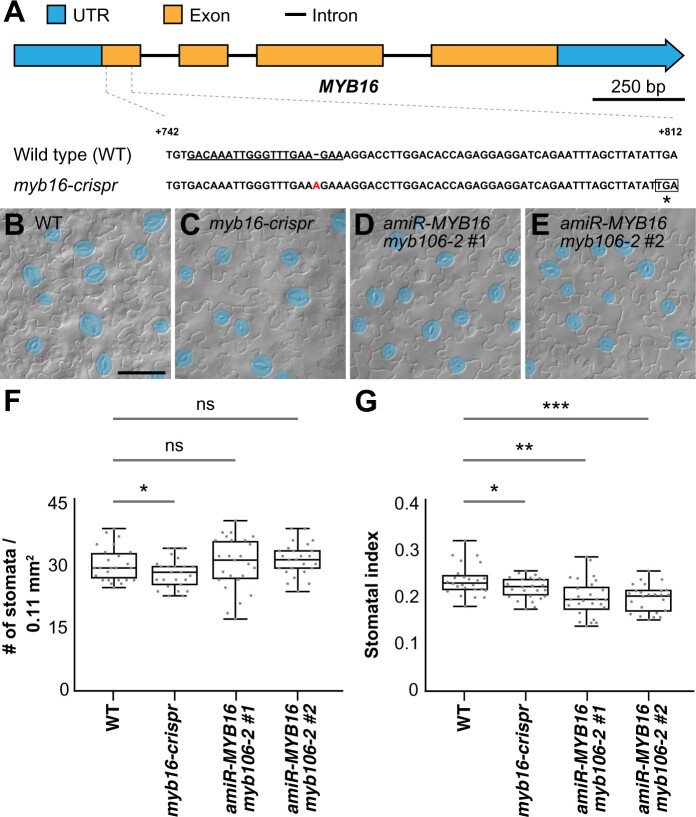
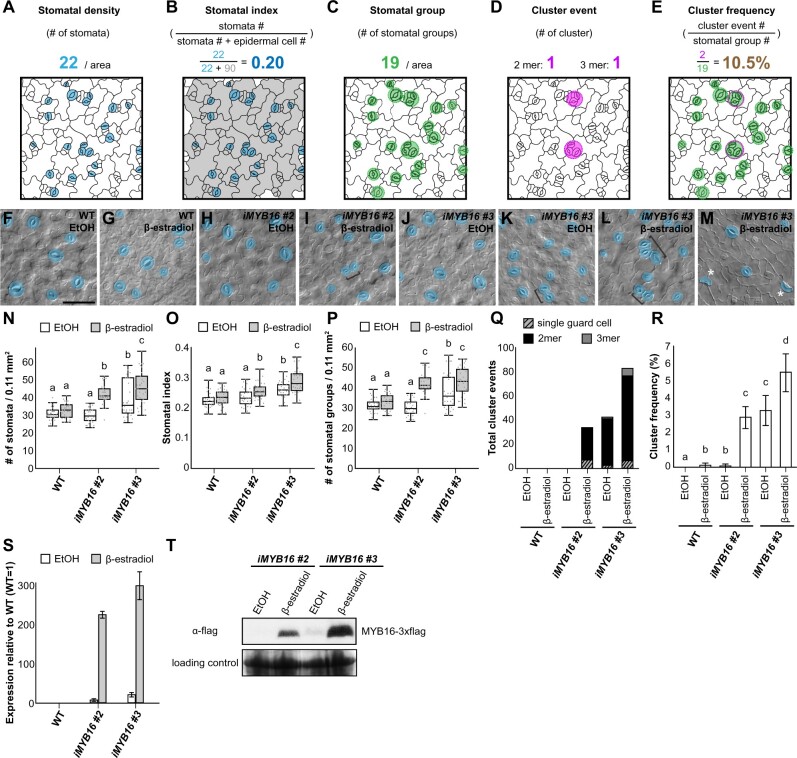
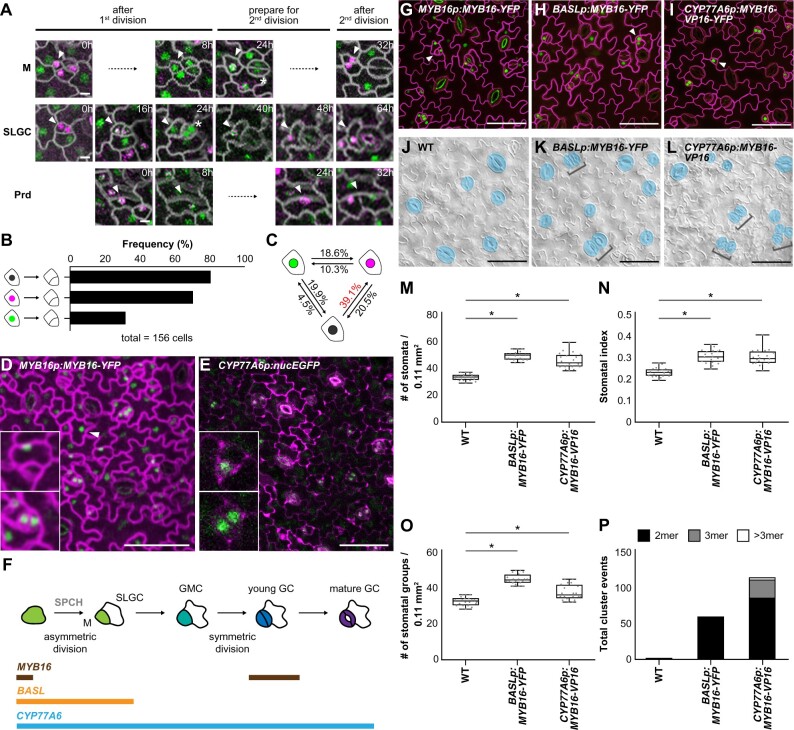
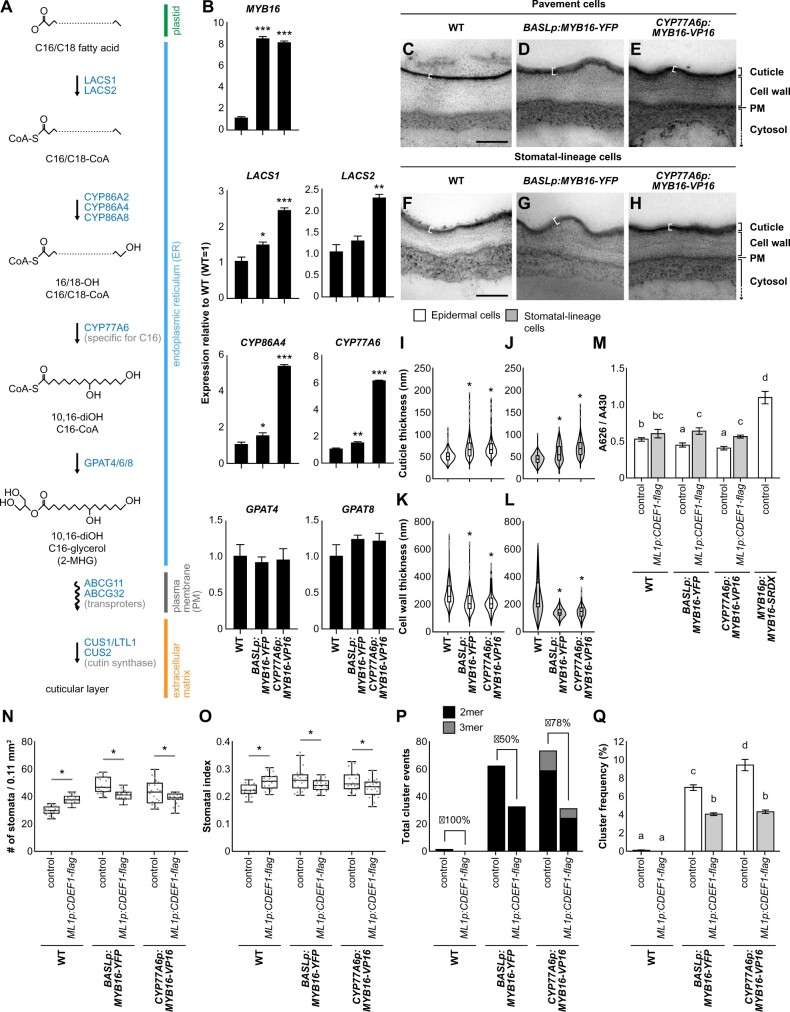
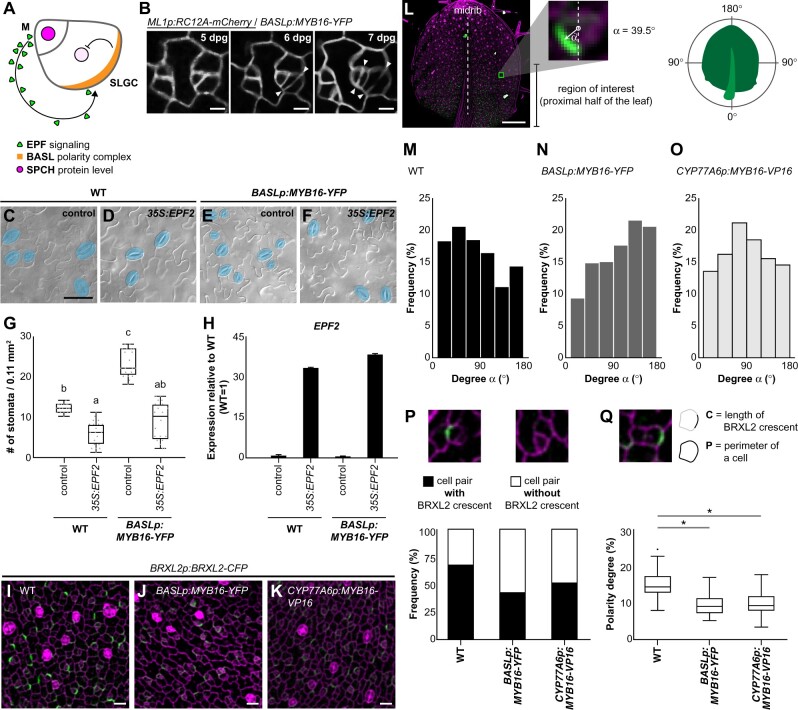
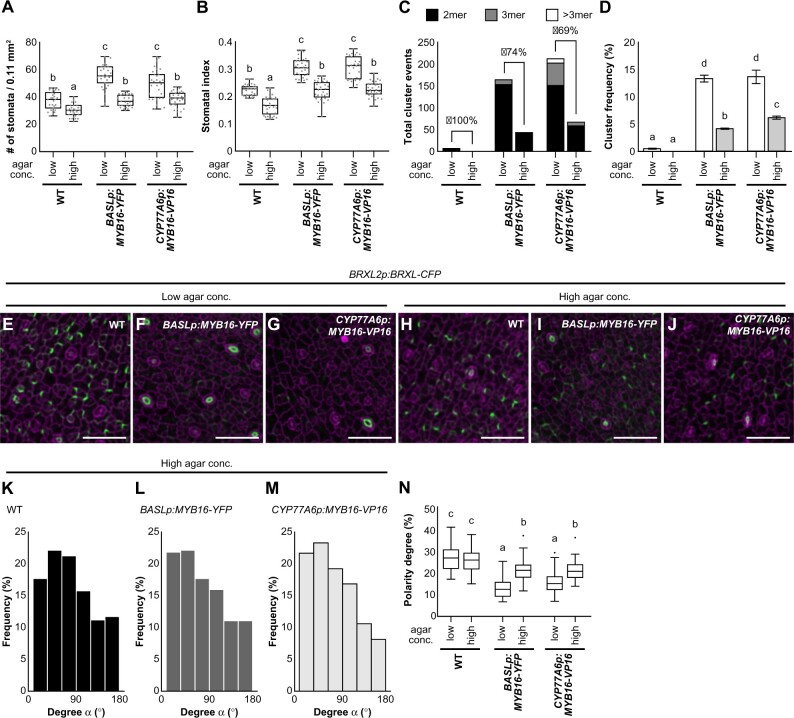
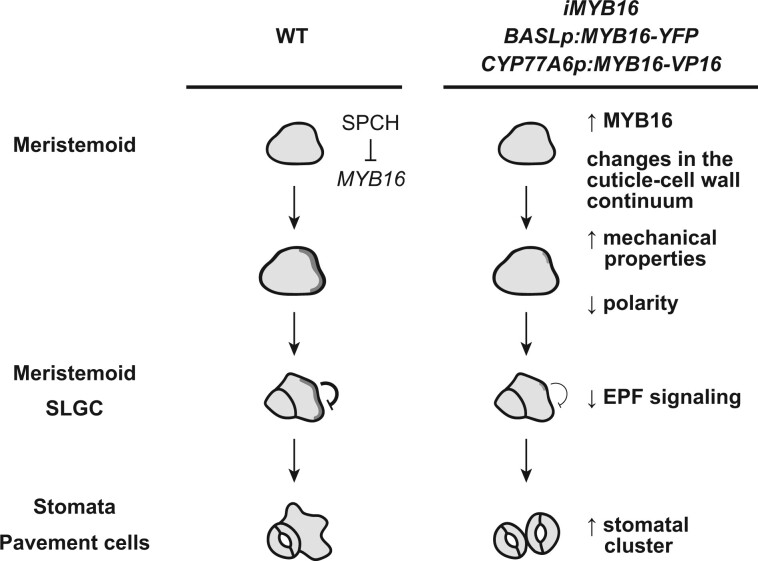
Stomatal pores and the leaf cuticle regulate evaporation from the plant body and balance the tradeoff between photosynthesis and water loss. MYB16, encoding a transcription factor involved in cutin biosynthesis, is expressed in stomatal lineage ground cells, suggesting a link between cutin biosynthesis and stomatal development. Here, we show that the downregulation of MYB16 in meristemoids is directly mediated by the stomatal master transcription factor SPEECHLESS (SPCH) in Arabidopsis thaliana. The suppression of MYB16 before an asymmetric division is crucial for stomatal patterning, as its overexpression or ectopic expression in meristemoids increased stomatal density and resulted in the formation of stomatal clusters, as well as affecting the outer cell wall structure. Expressing a cutinase gene in plants ectopically expressing MYB16 reduced stomatal clustering, suggesting that cutin affects stomatal signaling or the polarity setup in asymmetrically dividing cells. The clustered stomatal phenotype was rescued by overexpressing EPIDERMAL PATTERNING FACTOR2, suggesting that stomatal signaling was still functional in these plants. Growing seedlings ectopically expressing MYB16 on high-percentage agar plates to modulate tensile strength rescued the polarity and stomatal cluster defects of these seedlings. Therefore, the inhibition of MYB16 expression by SPCH in the early stomatal lineage is required to correctly place the polarity protein needed for stomatal patterning during leaf morphogenesis.


Figures

Figure 1
Figure 1
SPCH binds to the MYB16 promoter and downregulates its expression in meristemoids. A, Still images of MYB16-YFP (green) and SPCH-CFP (magenta) in a meristemoid (M)–SLGC pair in a true leaf from a WT plant at 7 dpg. B, Frequency of SPCH or MYB16 in either cell of meristemoid–SLGC pairs. SPCH was often found in meristemoids, as predicted (89.6%). In contrast, MYB16 preferentially localized to SLGCs (78.4%). A whole leaf image was used to obtain 583 pairs. M, meristemoid. C, Time-lapse imaging of SPCH and MYB16 in a meristemoid–SLGC pair. Both SPCH and MYB16 were found in the meristemoid at 0 h, but only the SPCH signal remained at 8 h before asymmetric cell division (24 h). D, Diagram of the MYB16 genome region: E-boxes (CANNTG) predicted by PlantPAN 3.0 are shown in yellow, SPCH-binding sites obtained from SPCH ChIP-seq data (Lau et al., 2014) are shown in gray. Five regions (black bars) designed for the ChIP-qPCR assay were used in (E). E, SPCH binds to the MYB16 promoter, as revealed by ChIP-qPCR of 4 dpg SPCHp:SPCH-CFP seedlings with GFP-trap beads. Three biological replicates (independent experiments with the same experimental procedure) showed similar results. EIF4A1 is a negative control. N.D., not detected. Data are means (sd). F, The experimental design for the MYB16 luciferase assay. The MYB16 promoter was fused with a mini-35S promoter to enhance gene expression. Ratiometric luminescent reporters were used to normalize the expression difference in a given construct. G, SPCH functions with SCRM/ICE1 to downregulate MYB16 expression. The luciferase assay was performed with protoplasts from 3-week-old WT plants. Four biological replicates showed similar results. *P < 0.001, by Student’s t test. Data are means (sd). For (A) and (C), cell outlines are marked by RC12A-mCherry (gray). Scale bars, 5 µm. See also Supplemental Figures S1 and S2.
Figure 2
Figure 2
The stomatal index is reduced in MIXTA-like loss-of-function mutants. A, Scheme of the MYB16 gene with the targeted sequence of CRISPR guide RNA (underlined). An adenine (A) insertion results in a premature stop codon (asterisk). B–E, DIC images of lower epidermis from 10-dpg WT true leaves (B), myb16-crispr (C) and two independent lines in which MYB16 artificial micro-RNA (amiR-MYB16) was introduced into the myb106-2 background (D) and (E). Mature GCs are pseudo-colored in blue. Scale bars, 50 µm. F, Quantification of stomatal density in (B) to (E). Stomatal density was reduced in the clustered regularly interspaced short palindromic repeats (CRISPR)-edited MYB16 line (myb16-crispr) but not in amiR-MYB16/myb106-2. n = 25 seedlings. *P < 0.05, by Wilcoxon signed-rank test. Data are medians (interquartile range); ns, not significant. G, Quantification of stomatal index in (B–E). Stomatal index was reduced in both myb16-crispr and amiR-MYB16/myb106-2. n = 25 seedlings. *P < 0.05; **P < 0.01; ***P < 0.001, by Wilcoxon signed-rank test. Data are medians (interquartile range).
Figure 3
Figure 3
Overexpression of MYB16 induces the formation of stomatal clusters. A, Stomatal density is defined by the total stomatal number in a given area. Mature stomata with pores are colored in blue. B, Stomatal index calculated by dividing the stomatal number by the total epidermal cell number (the sum of stomata, meristemoids, SLGCs, and pavement cells) in a given area, i.e. the number of blue cells divided by the number of blue and gray cells. C, Stomatal group is defined as a single stomatal island. Adjacent stomata are counted as one group. Groups are indicated by green circles. D, Cluster event represents the event number of stomatal pairs, triplets, or more than three adjacent stomata. Clusters are indicated by magenta circles. E, Cluster frequency calculated by dividing the number of cluster events by the number of stomatal groups, i.e. the number of magenta circles divided by the number of green circles. F–M, DIC images of the lower epidermis in 10-dpg WT true leaves and two MYB16 inducible lines (iMYB16#2 and #3) treated with EtOH (mock) or 50-µM β-estradiol. Stomatal pairs (brackets) were often found after β-estradiol treatment in the MYB16 induced lines. Occasionally, single GCs (asterisks) were found (M). Mature GCs are pseudo-colored in blue. Scale bar, 50 µm. N, Quantification of stomatal density (number of pores per 0.11 mm2) from (F) to (M). Stomatal density increased after β-estradiol treatment in the iMYB16 lines. Compared to iMYB16#2, iMYB16#3 had a higher stomatal number under mock treatment, which suggests leaky expression of MYB16. O, Quantification of stomatal index (the number of stomata divided by the total number of epidermal cells) from (F) to (M). Stomatal index increased after β-estradiol treatment in iMYB16 lines. P, Quantification of the number of stomatal groups (cluster as a single complex) per 0.11 mm2 from (F) to (M). The number of stomatal groups increased after β-estradiol treatment in iMYB16 lines. Q, Quantification of abnormal stomatal phenotypes shows that iMYB16 lines had more single GC and stomatal clusters (2–3 mer) than WT plants after β-estradiol treatment. Data are the sum of event numbers of 30 lower epidermis samples. R, Quantification of cluster frequency shows that stomatal clusters formed more frequently in iMYB16 than WT plants after β-estradiol treatment. Data are the means (se) of 30 lower epidermis samples. S, The expression of MYB16 was induced more than 200-fold after β-estradiol treatment, as revealed by qRT-PCR. iMYB16#3 (23.5×) was expressed at a higher level than iMYB16#2 (7.3×) under mock conditions. Data are means (sd). T, Immunoblot analysis indicating that MYB16 protein levels are tightly controlled in iMYB16#2. iMYB16#3 had leaky MYB16 expression under mock conditions, which could explain the phenotypes observed in (K). Coomassie blue staining of total protein represents a loading control. Thirty lower epidermis samples were used in (N)–(R). For (N)–(R), three biological replicates showed similar results. P < 0.05, Kruskal–Wallis test with Dunn’s test (N)–(P), P < 0.05. One-way ANOVA with Tukey post hoc test (R). Medians and interquartile ranges are shown in (N)–(P).
Figure 4
Figure 4
Ectopic expression of MYB16 in early stomatal lineage cells causes stomatal cluster formation. A, Time-lapse confocal images of MYB16-YFP (green) and SPCH-CFP (magenta) in 7-dpg true leaves show that SPCH and MYB16 were expressed individually or together, depending on the sequence of cell division. Arrowheads indicate cells of interest. An asterisk shows MYB16-YFP in the pair of GCs. Timestamps indicate the time since the start of the first cell division. M, meristemoid; Prd, protoderm. B, Results from sequential pattern analysis of protein expression using the PrefixSpan algorithm. The colocalization (black) and SPCH alone (magenta) were more frequently seen than MYB16 alone (green) before cell division. A total of 156 serial events were collected from time-lapse confocal images of 7-dpg true leaves for sequential pattern analysis. C, Frequency of the state transition between SPCH alone, MYB16 alone, and colocalization using the PrefixSpan algorithm. The state transition from colocalization (black) to SPCH alone (magenta) had the highest frequency (39.1%). D, MYB16-YFP driven by the MYB16 promoter in an 8-dpg true leaf. Confocal image shows that MYB16 expression is limited to SLGCs (upper inset), young GCs (lower inset), and pavement cells (arrowhead). E, Confocal image of the CYP77A6 transcriptional reporter in an 8-dpg true leaf shows that CYP77A6 expression is stomatal lineage-specific, as seen in meristemoid (upper inset) and pairs of GCs (lower inset). Seven individual T1 lines were characterized and showed similar results. F, Summarized expression window of the MYB16, BASL, and CYP77A6 promoters. M, meristemoid. G–I, Confocal images of 10-dpg true leaves. MYB16-YFP was driven by the MYB16 (G), BASL (H), or CYP77A6 (I) promoter. Rather than being preferentially localized to SLGCs in the MYB16 native promoter lines (G), BASL (H), and CYP77A6 (I) promoter-driven MYB16 signals were seen in meristemoid cells (arrowheads). J–L, DIC images of the lower epidermis from 10-dpg true leaves of the WT (J), BASLp:MYB16-YFP (K), and CYP77A6p:MYB16-VP16 (L) lines. Stomatal clusters (brackets) were found in BASLp and CYP77A6p lines. Mature GCs are pseudo-colored in blue. M–O, Quantification of stomatal density (M), stomatal index (N), and the number of stomatal groups (O). All parameters increased when MYB16 was ectopically expressed in early stomatal lineage cells. n = 20 seedlings. *P < 0.05, by Wilcoxon signed-rank test. Data are medians (interquartile range). P, Total cluster events show that ectopically expressing MYB16 in stomatal lineage causes stomatal cluster formation. The values were obtained from the sum of the events from 20 lower-epidermis samples. Cell outlines are marked either by ML1p:RC12A-mCherry in (A), (D), and (G) to (I) (gray in (A), magenta in (D) and (G)–(I)) or stained by PI in (E). Scale bars, 5 µm in (A) and 50 µm in (D), (E), and (G)–(L). For (M)–(P), three biological replicates showed similar results. See also Supplemental Figures S3–S7.
Figure 5
Figure 5
Expressing the cutinase gene CDEF1 decreases stomatal cluster formation in ectopic MYB16 lines. A, A diagram showing the biosynthesis of one type of cutin monomer. The C16/C18 fatty acid from plastids is transformed into the hydroxylated acyl-CoA intermediate and then becomes cutin monomers in the ER. The transport of the monomers supplies the material required for the polymerization of the cuticle layer outside the cell walls. The polymerization of the cuticle layer is mediated by cutin synthase. Genes involved in the reaction are labeled in blue. B, Relative mRNA expression of cuticle biosynthesis genes in ectopic MYB16 lines. A 7-dpg WT is used as a reference (equal to 1). *P < 0.05; **P < 0.01; ***P < 0.001, by Student’s t test. Data are mean (sd). Three biological replicates showed similar results. C–H, TEM images of the lower epidermis from 7-dpg true leaves of the WT (C) and (F), BASLp:MYB16-YFP (D) and (G), and CYP77A6p:MYB16-VP16 (E) and (H). Both pavement cells (C)–(E) and stomatal-lineage cells (F)–(H) showed thicker cuticle deposition (white brackets) on the cell surface in BASLp and CYP77A6p lines than the WT. I–L, Quantification of cuticle (I) and (J) and cell wall (K) and (L) thickness from (C) to (H). The cuticle thickness of epidermal (I) and (K) and stomatal lineage cells (J) and (L) increased in ectopic MYB16 lines compared to the WT, but cell wall thickness decreased. Data were obtained from 200 to 300 regions of lower epidermal cells. *P < 0.05, by Student’s t test. Data are medians (interquartile range). Gray dots represent Tukey outliers. M, Quantification of penetrated TB showing that MYB16-SRDX plants are more permeable than BASLp or CYP77A6p plants. After ectopically introducing the cutinase gene CDEF1 into BASLp or CYP77A6p lines, seedlings showed more penetrated TB compared with the control in each background. The TB absorbance (A626) is normalized by chlorophyll absorbance (A430). P < 0.05. Kruskal–Wallis with Dunn’s test. Data are means (se). N, O, Quantification of stomatal density (N) and stomatal index (O) shows the partial rescue of MYB16 ectopic expression plants by ectopically expressing the cutinase gene CDEF1. n = 20 10-dpg seedlings. *P < 0.05, by Wilcoxon signed-rank test. Data are medians (interquartile range). P, Q, The number of stomatal clusters (P) and cluster frequency (Q) decreased after ectopically expressing the cutinase gene CDEF1. For (P), the values were obtained from the sum of the events in a total of 20 lower-epidermis samples. Rescue percentage is the difference in the number of cluster events between the control and ML1p:CDEF1-flag divided by the event number in the control. For (Q), cluster frequency is the cluster event number divided by the number of stomatal groups. P < 0.05. One-way ANOVA with Tukey post hoc test. Data are means (se). For (C)–(H), shared scale bars, 200 nm, in (C) and (F). For (M)–(Q), two biological replicates and two individual lines in each background showed similar results. See also Supplemental Figures S8–S10.
Figure 6
Figure 6
Stomatal cluster formation is caused by the mis-localization and reduced amounts of polarity protein in the stomatal lineage. A, Diagram shows the EPF-mediated inhibitory pathway incorporating the spatially labeled polarity complex to prevent stomatal cluster formation in Arabidopsis. EPFs are secreted from meristemoid (M) cells and activate inhibitory signaling in SLGCs, where the polarity complex recruits inhibitory components, leading to decreased SPCH levels. B, Time-lapse confocal images show stomatal cluster formation in the BASL promoter-driven ectopic MYB16 line. Left parts of the images show normal stomatal formation. Right parts show that the adjacent stomate is derived from an SLGC, resulting in stomatal clustering. Arrowheads indicate divisions. C–F, DIC images of the lower epidermis from 14-dpg cotyledons of the WT or BASLp-driven MYB16 lines with or without the overexpression of EPF2. Mature stomata are pseudo-colored in blue. Scale bar, 50 µm. G, Quantification of stomatal density showing that the overexpression of EPF2 reduces the number of stomata in both WT and BASLp:MYB16-YFP. n = 20 14-dpg plants. P < 0.001, by Kruskal–Wallis test with Dunn’s method. Data are medians (interquartile range). H, qRT-PCR analysis of relative mRNA level of EPF2 in 14-dpg cotyledons. EPF2 was highly expressed in plants with the 35S:EPF2 construct. Data are means (sd). I–K, Confocal images of the polarity marker BRXL2 in 7-dpg true leaves. Compared to the WT (I), BRXL2-CFP signal (green) is dimmer in BASLp:MYB16-YFP (J) and CYP77A6p:MYB16-VP16 (K). Four individual lines of each background showed similar results. L, Angle α indicating the angle between the vectors of the midrib and BRXL2. The vector toward the proximal part of a 7-dpg true leaves is set to 0°. α angles were measured in the bases of leaves. M–O, The orientation of polarity in the WT (M), BASLp:MYB16-YFP (N), and CYP77A6p:MYB16-VP16 (O). To avoid the PI effect, α angles were quantified from confocal images of 7-dpg true leaves expressing BRXL2 in the indicated lines without PI staining. n = 769, 324, and 615 cells in (M–O), respectively. P, The proportion of cells with BRXL2 crescents is reduced in ectopic MYB16 lines compared to the WT. n = 227, 150, and 217 cell pairs in the WT, BASLp:MYB16-YFP, and CYP77A6p:MYB16-VP16, respectively. Q, Analysis of the polarity degree of BRXL2 crescents shows that ectopic MYB16 lines have a lower polarity degree compared to the WT. Polarity degree is calculated from crescent length divided by cell perimeter. The dataset is derived from 67 cells with peripheral BRXL2 for each line. The dot shows the Tukey outlier. *P < 0.001, by Student’s t test. Data are medians (interquartile range). Cell outline marked by ML1p:RC12A-mCherry in (B, gray) and labeled by PI in (I)–(K), (P), and (Q) (magenta). Scale bars, 5 µm in (B), 20 µm in (I)–(K), and 200 µm in (L). For (M)–(Q), data combined from four individual lines of each background. See also Supplemental Figures S11 and S12.
Figure 7
Figure 7
The stomatal phenotype in ectopic MYB16 lines is rescued by high-percentage agar treatment. A, B, Quantification of stomatal density (A) and stomatal index (B) show the rescue of the stomatal phenotype in ectopic MYB16 lines under high-percentage agar treatment. Low, 0.8% agar (normal conditions), and high, 2.4% agar. n = 30 10-dpg seedlings. P < 0.01, Kruskal–Wallis test with Dunn’s test. Data are medians (interquartile range). Three biological replicates showed similar results. C, D, Stomatal cluster number (C) and cluster frequency (D) decrease after high-percentage agar treatment. For (C), the rescue percentage was calculated using the difference in cluster events between two types of agar treatments divided by the number of cluster events in low-percentage agar treatment. For (D), cluster frequency is the cluster event number divided by the number of stomatal groups; P < 0.05. One-way ANOVA with Tukey post hoc test. Data are means (se). Three biological replicates showed similar results. E–J, Confocal images of the polarity marker BRXL2 in 7-dpg true leaves from plants grown in two different concentrations of agar. BRXL2-CFP signal (green) is similar in the WT (E) and (H) but stronger in BASLp:MYB16-YFP (F) and (I) and CYP77A6p:MYB16-VP16 (G) and (J) after high-percentage agar treatment. K–M, The orientation of polarity is rescued in BASLp:MYB16-YFP and CYP77A6p:MYB16-VP16 after high-percentage agar treatment. The data were quantified from confocal images of 7-dpg true leaves expressing BRXL2 without PI staining. n = 587, 369, 321 cell pairs in (K)–(M), respectively. N, The rescue of the BRXL2 crescent size in ectopic MYB16 lines by high-percentage agar treatment. The calculation method is the same as in Figure  6Q. Sixty cells with peripheral BRXL2 were collected from each line under each treatment. The dot shows the Tukey outlier. P < 0.001, by one-way ANOVA with Tukey post hoc test. Data are medians (interquartile range). For (E)–(J), cell outline is labeled by PI (magenta). Scale bars, 50 µm in (E)–(J). For (K)–(N), data are combined from four individual lines of each background. See also Supplemental Figure S12.
Figure 8
Figure 8
Ectopic MYB16 expression in meristemoids leads to stomatal cluster formation by modulating polarity protein behavior during asymmetric cell division. In WT epidermis, SPCH represses MYB16 expression in meristemoids to ensure polarity establishment for proper stomatal patterning. However, in the MYB16 overexpression and ectopic expression lines, high MYB16 expression in meristemoids enhances the thickness in the cuticle. The change in the cuticlecell wall continuum leads to the reduction and mis-polarization of polarity protein during asymmetric cell division, which further impairs the EPF-mediated inhibitory signaling and results in the formation of stomatal clusters. The dark gray shading represents the polarity complex.
None

Comment in

References

    1. Adrian J, Chang J, Ballenger CE, Bargmann BO, Alassimone J, Davies KA, Lau OS, Matos JL, Hachez C, Lanctot A, et al. (2015) Transcriptome dynamics of the stomatal lineage: Birth, amplification, and termination of a self-renewing population. Dev Cell 33: 107–118 - PMC - PubMed
    1. Aharoni A, Dixit S, Jetter R, Thoenes E, Van Arkel G, Pereira A (2004) The SHINE clade of AP2 domain transcription factors activates wax biosynthesis, alters cuticle properties, and confers drought tolerance when overexpressed in Arabidopsis. Plant Cell 16: 2463–2480 - PMC - PubMed
    1. Baumann K, Perez-Rodriguez M, Bradley D, Venail J, Bailey P, Jin H, Koes R, Roberts K, Martin C (2007) Control of cell and petal morphogenesis by R2R3 MYB transcription factors. Development 134: 1691–1701 - PubMed
    1. Bessire M, Borel S, Fabre G, Carrac L, Efremova N, Yephremov A, Cao Y, Jetter R, Jacquat AC, Métraux JP, et al. (2011). A member of the PLEIOTROPIC DRUG RESISTANCE family of ATP binding cassette transporters is required for the formation of a functional cuticle in Arabidopsis. Plant Cell 23: 1958–1970 - PMC - PubMed
    1. Bhanot V, Fadanavis SV, Panwar J (2021) Revisiting the architecture, biosynthesis and functional aspects of the plant cuticle: there is more scope. Environ Exp Bot 183: 104364

Publication types

MeSH terms

LinkOut - more resources