. 2022 Jan 20;34(1):351-373.
doi: 10.1093/plcell/koab263.

FYVE2, a phosphatidylinositol 3-phosphate effector, interacts with the COPII machinery to control autophagosome formation in Arabidopsis

Affiliations

FYVE2, a phosphatidylinositol 3-phosphate effector, interacts with the COPII machinery to control autophagosome formation in Arabidopsis

Jeong Hun Kim et al. Plant Cell. .

Abstract

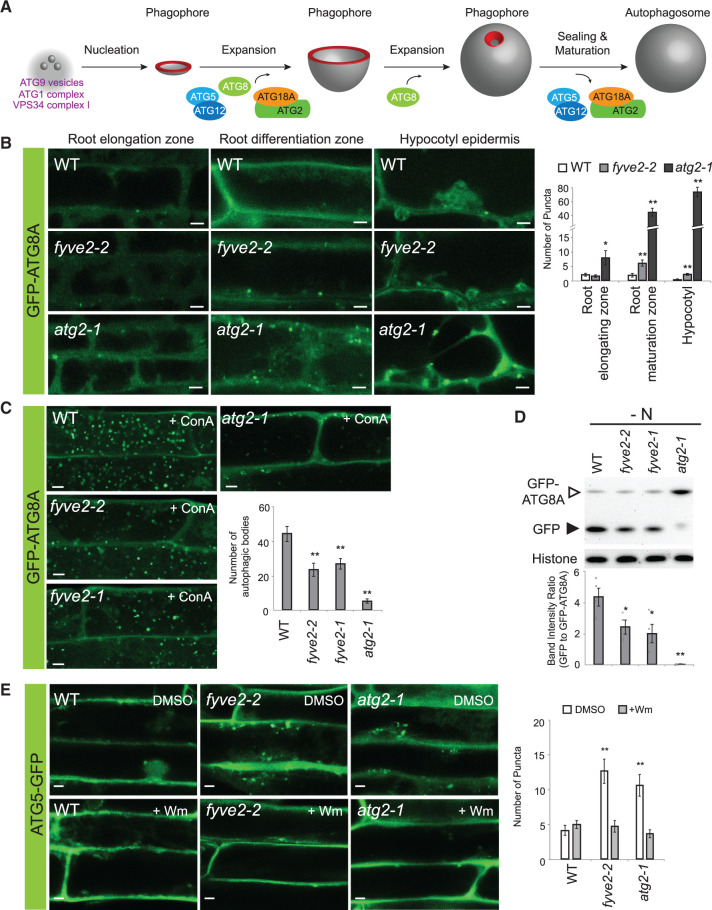
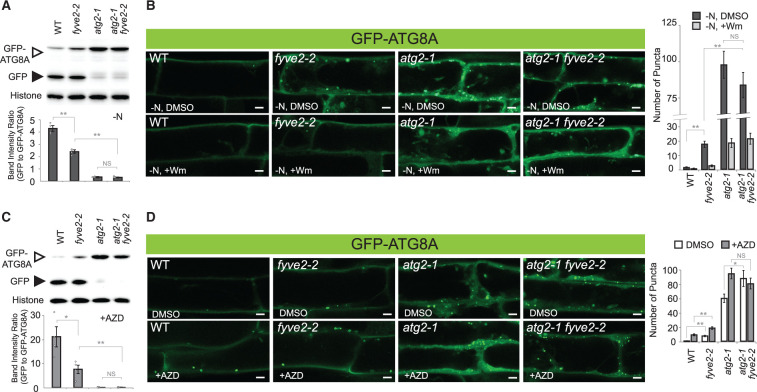
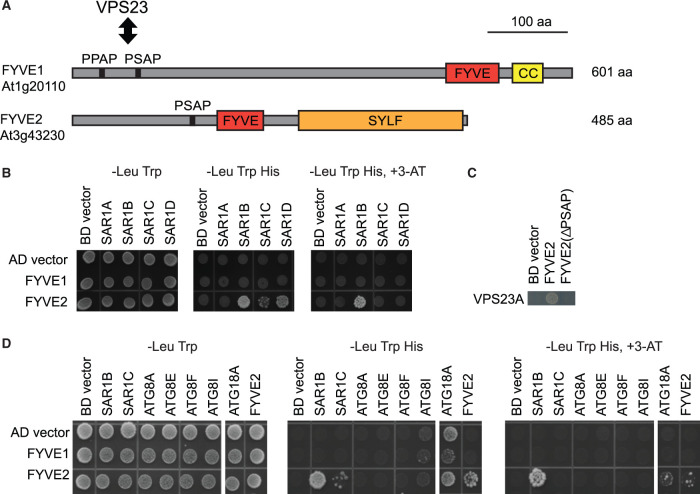
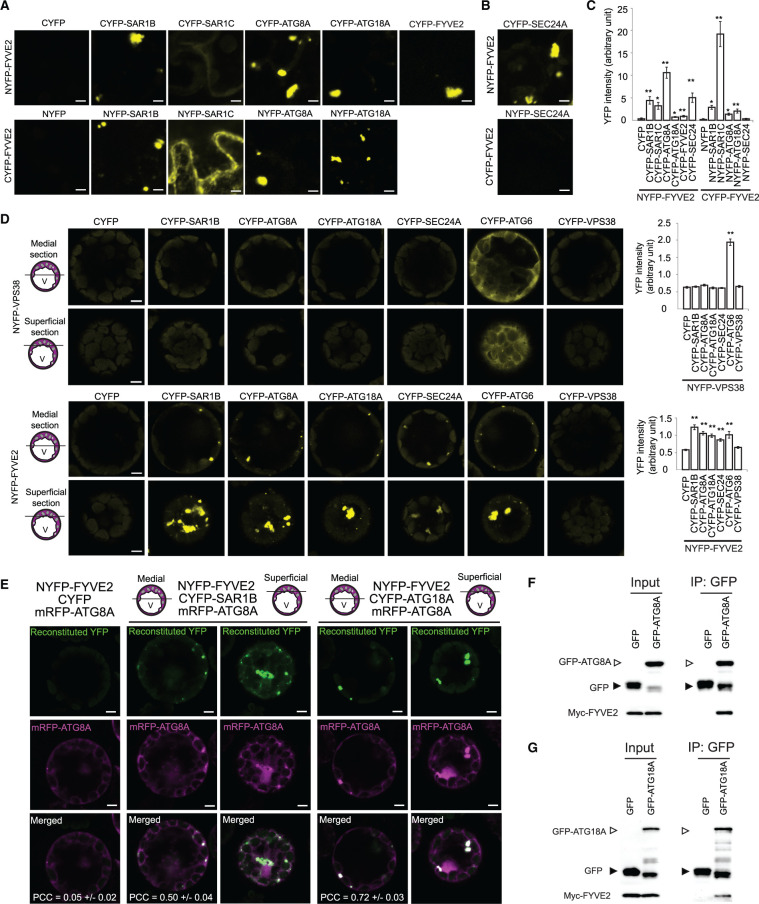
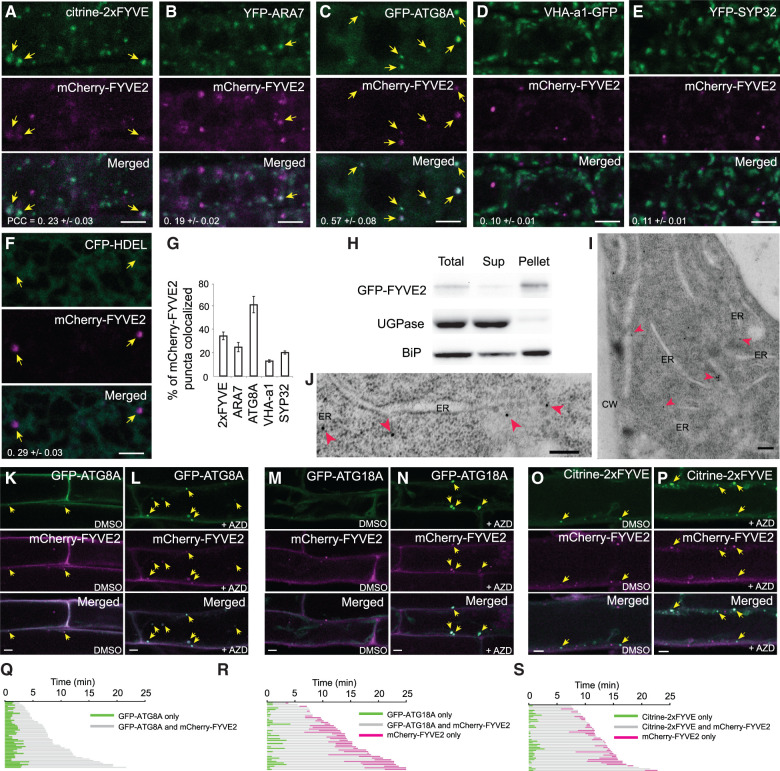
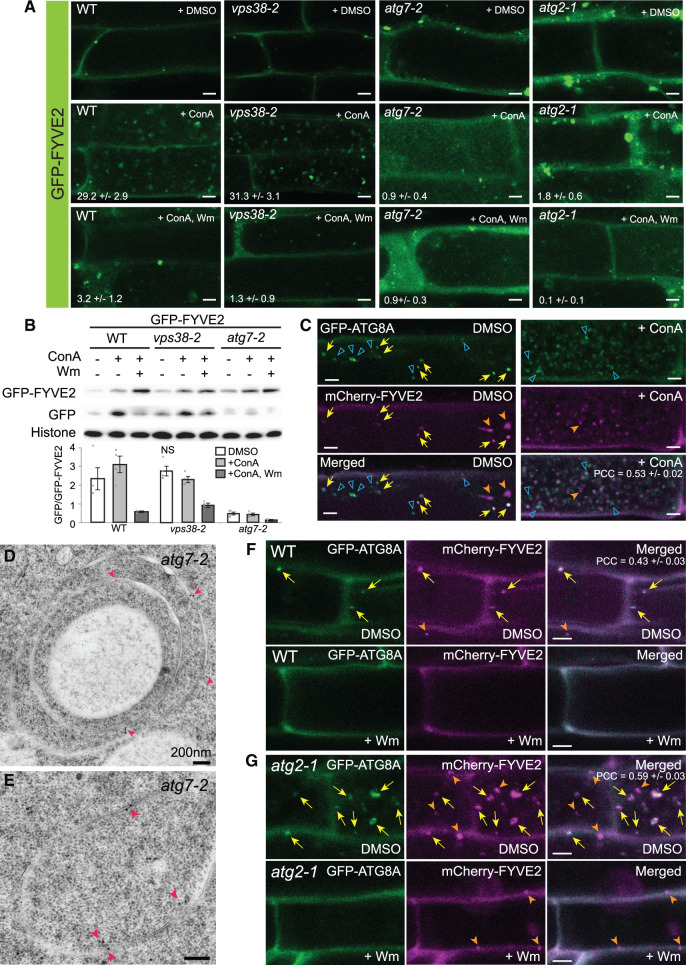
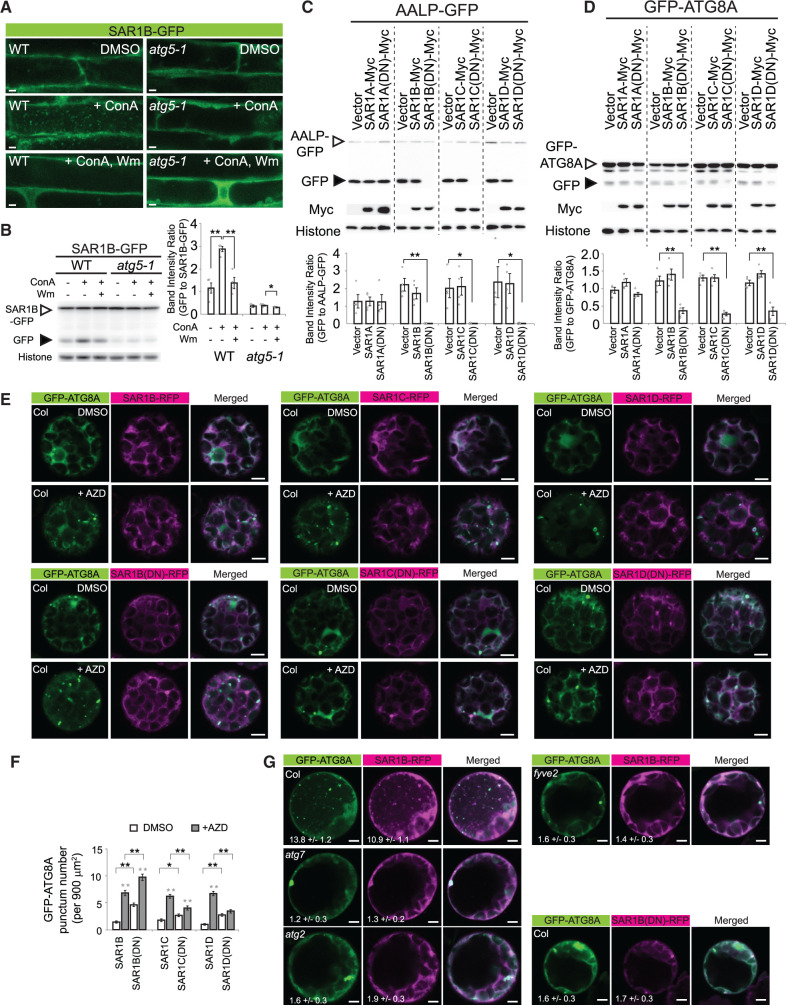
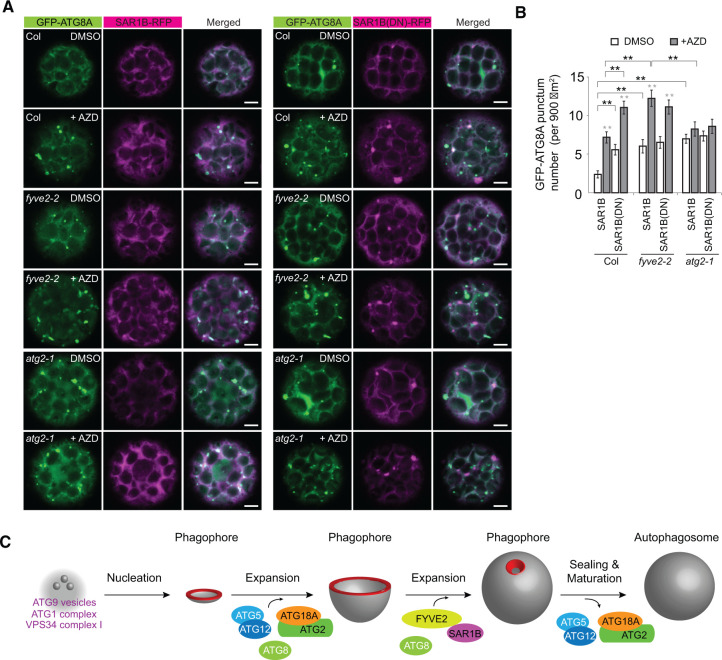
Autophagy is an intracellular trafficking mechanism by which cytosolic macromolecules and organelles are sequestered into autophagosomes for degradation inside the vacuole. In various eukaryotes including yeast, metazoans, and plants, the precursor of the autophagosome, termed the phagophore, nucleates in the vicinity of the endoplasmic reticulum (ER) with the participation of phosphatidylinositol 3-phosphate (PI3P) and the coat protein complex II (COPII). Here we show that Arabidopsis thaliana FYVE2, a plant-specific PI3P-binding protein, provides a functional link between the COPII machinery and autophagy. FYVE2 interacts with the small GTPase Secretion-associated Ras-related GTPase 1 (SAR1), which is essential for the budding of COPII vesicles. FYVE2 also interacts with ATG18A, another PI3P effector on the phagophore membrane. Fluorescently tagged FYVE2 localized to autophagic membranes near the ER and was delivered to vacuoles. SAR1 fusion proteins were also targeted to the vacuole via FYVE2-dependent autophagy. Either mutations in FYVE2 or the expression of dominant-negative mutant SAR1B proteins resulted in reduced autophagic flux and the accumulation of autophagic organelles. We propose that FYVE2 regulates autophagosome biogenesis through its interaction with ATG18A and the COPII machinery, acting downstream of ATG2.


Figures

Figure 1
Figure 1
fyve2 mutants over-accumulate autophagic vesicles and show a reduction in autophagic flux. A, A plant model depicting distinct steps during autophagosome biogenesis. The highly curved rim and neck of the phagophore are highlighted in red. B, Confocal fluorescence images showing the different types of cells in WT (top row), fyve2-2 (middle), and atg2-1 (bottom) seedlings expressing GFP-ATG8A. Seedlings were incubated in N-deficient (−N) liquid medium for 48 h prior to microscopic observation of young cells at the root elongation zone (left column), mature cells at the root differentiation zone (middle), and mature hypocotyl epidermal cells (right). The graph on the right shows the density of GFP-ATG8A puncta per 25,514 µm2. C, Observation of autophagic bodies from WT, fyve2-2, fyve2-1, and atg2-1 root cells expressing the autophagic marker GFP-ATG8A. Seedlings were incubated in −N liquid medium for 48 h and 0.5-µM ConA was added to the liquid medium 16 h prior to confocal microscopy. The graph shows quantification of autophagic bodies per 1,000 µm2 area of the central vacuole. D, Determination of autophagic flux in WT, fyve2-2, fyve2-1, and atg2-1 seedlings by GFP-ATG8A cleavage assay. Seedlings were grown in −N liquid medium for 48 h prior to protein extraction for immunoblot analysis with anti-GFP (upper image) or anti-histone H3 antibodies (lower image for the loading control). The graph shows the quantification of relative band intensities. E, Confocal fluorescence images showing the mature root cells of 9-day-old WT, fyve2-2, and atg2-1 seedlings expressing the phagophore marker ATG5-GFP. Seedlings were incubated in −N liquid medium for 48 h prior to microscopic observation. The graph shows the density of ATG5-GFP puncta per 25,514 µm2. Columns marked with asterisks represent mutants that are significantly different from WT, according to t test. Mean ± se; n = 10–13 images (B), 16–18 images (C), 4 seedling populations (D), 13–15 images (E). *0.01 < P < 0.05; **P < 0.01. Scale bars = 5 µm.
Figure 2
Figure 2
atg2 is epistatic to fyve2. A and C, GFP-ATG8A cleavage assay to determine the autophagic flux in WT, fyve2, atg2, and fyve2 atg2 seedlings. Immunoblot analysis was performed using anti-GFP (upper image) or anti-histone H3 antibody (lower image for the loading control). Graphs below show the quantification of band intensity ratios (mean ± se; n = 4). B and D, Confocal fluorescence images of mature root cells expressing GFP-ATG8A. Autophagy was induced by exposing 9-day-old seedlings to N starvation for 48 h (A) or 12 h (B) and to 0.5 µM AZD treatment for 12 h (C) or 1 h (D). Prior to microscopic observation in (B), WT, fyve2, atg2, and fyve2 atg2 seedlings were either treated with DMSO or 30 µM Wm for 1 h. The graphs on the right show quantification of GFP-ATG8A puncta. Images (n = 16–18 in (B), 14–16 in (D)) were collected to calculate the density of GFP-ATG8A puncta per 25,514 µm2 (mean ± SE). Columns marked with asterisks represent mutants that are significantly different from WT, according to t test. *0.01 < P < 0.05; **P < 0.01. NS, not significant. Scale bars = 5 µm.
Figure 3
Figure 3
FYVE2 physically interacts with proteins involved in the formation of autophagosomes and COPII vesicles. A, Diagram of the Arabidopsis FYVE1 and FYVE2 proteins. FYVE and SYLF domains are shown in red and orange boxes, respectively. CC, coiled-coil region. The VPS23A/ELC-interacting PSAP/PPAP motifs in FYVE1 and FYVE2 are indicated by vertical lines. B and D, Y2H interactions of FYVE1 and FYVE2. Mating-based Y2H was used. Gal4BD, Gal4-DNA-binding domain. Gal4AD, Gal4-activation domain. C, Y2H interaction of VPS23A with either WT or ΔPSAP mutant FYVE2 protein. Co-transformation-based Y2H was used.
Figure 4
Figure 4
FYVE2 interacts with SAR1B and ATG18A in planta. A–C, BiFC interactions of FYVE2 using transient expression in N. benthamiana leaves. The indicated proteins fused to the NYFP were co-expressed with the indicated proteins fused to the CYFP. Vector controls (NYFP or CYFP) co-expressed with NYFP-FYVE2 or CYFP-FYVE2 are shown on the left. C, Quantification of reconstituted YFP intensity. D, BiFC interactions of NYFP-VPS38 (control; first and second rows) and NYFP-FYVE2 (third and fourth rows) using transient expression in Arabidopsis leaf protoplasts. Confocal images of medial (first and third rows) and superficial (second and fourth rows) optical sections are shown. V, vacuole. The graphs on the right show quantification of reconstituted YFP intensity. Columns marked with asterisks represent means that are significantly different from the CYFP or NYFP control, according to t test (mean ± se; n = 3–10 images in (A) and (B), n = 39–51 images in (D)). *0.01 < P < 0.05; **P < 0.01. Scale bars = 5 µm. E, Colocalization of mRFP-ATG8A puncta with YFP signal reconstituted from BiFC pairs FYVE2-SAR1B (second and third columns) and FYVE2-ATG18A (fourth and fifth columns). Confocal images of medial (second and fourth columns) and superficial (third and fifth columns) optical sections are shown. The Pearson correlation coefficients (PCCs) were calculated from 21 medial section images (mean ± se). F and G, Co-immunoprecipitation of Myc-FYVE2 with GFP-ATG8A (F) and GFP-ATG18A (G) expressed in Arabidopsis leaf protoplasts. Inputs (immunoblot images on the left) and immunoprecipitates (images on the right) are shown. Protein blots were reacted with anti-GFP (upper blots) and anti-Myc (lower blots) antibodies. Protein samples prepared from protoplasts expressing GFP and Myc-FYVE2 were used as a negative control. A representative set of immunoblots is shown, selected from three independent replicates.
Figure 5
Figure 5
Fluorescent fusions to FYVE2 are found near the ER and mostly co-localize with autophagic markers. A–F, Localization of mCherry-FYVE2 relative to biosensors and organelle markers. Confocal fluorescence images were acquired from root cells expressing mCherry-FYVE2 (A–F) and either a PI3P biosensor (A), late endosome marker (B), autophagic marker (C), TGN marker (D), Golgi apparatus marker (E), or ER luminal marker (F). Arrows indicate mCherry-FYVE2 puncta overlapping with the respective markers. G, Quantification of mCherry-FYVE2 puncta co-localizing with various markers. Images (n = 10–12) similar to those shown in (A)–(E) were collected to calculate the percentage of mCherry-FYVE2 puncta showing fluorescence at the yellow/green channel. The Pearson correlation coefficients (PCCs) are also provided in (A)–(F) (mean ± se). H, Membrane fractionation analysis of GFP-FYVE2. Anti-GFP antibodies were used to detect GFP-FYVE2. Immunoblots using antibodies reacting with UGPase and ER-resident isoform of heat shock protein 70 (BiP) were used as markers for soluble and microsomal fractions, respectively. I and J, Immunodetection of GFP-FYVE2 on the ER of cells at the root tip. CW, cell wall. Arrowheads indicate gold particles labeled with anti-GFP antibodies. K–P, Confocal fluorescence images of root cells expressing mCherry-FYVE2 and either GFP-ATG8A (K and L), GFP-ATG18A (M and N), or citrine-2xFYVE (O and P). Seedlings were incubated in liquid medium containing DMSO (K, M, and O) or 0.5 µM AZD (L, N, and P) for 1 h prior to microscopy. Arrows indicate mCherry-FYVE2 puncta overlapping with the respective autophagic markers. Q–S, Time-lapse imaging analysis of puncta emitting both mCherry-FYVE2 and either GFP-ATG8A (Q), GFP-ATG18A (R), or citrine-2xFYVE (S). Scale bars = 5 µm (A–E, F, and K–P) or 200 nm (I and J).
Figure 6
Figure 6
GFP-FYVE2 is targeted to the vacuole via the autophagic route. A, Confocal fluorescence images of mature root cells expressing GFP-FYVE2. GFP-FYVE2 seedlings with the indicated genetic background were incubated in N-sufficient liquid medium for 9 days and treated with DMSO, 0.5-µM ConA, or 0.5 µM ConA plus 30 µM Wm for 16 h. Numbers in the second and third rows show the number of autophagic bodies (mean ± se; n = 11–12 images) per 1,000 µm2 area of the central vacuole. B, GFP-FYVE2 cleavage assay. WT, vps38-2, or atg7-2 seedlings expressing GFP-FYVE2 were incubated as described above, and protein extract was prepared for immunoblot analysis using anti-GFP (upper) and anti-histone H3 (lower; for loading control) antibodies. Representative images selected from four repeat experiments are shown. C, Confocal fluorescence images of root cells expressing GFP-ATG8A and mCherry-FYVE2. Seedlings grown in N-rich medium were treated with DMSO or 0.5 µM ConA for 16 h prior to confocal microscopy. The Pearson correlation coefficients (PCCs) were calculated from 12 images (mean ± se). D and E, Immunodetection of GFP-FYVE2 in atg7-2 cells at the root tip. Arrowheads indicate gold particles labeled with anti-GFP antibodies. F and G, Confocal fluorescence images of mature root cells expressing GFP-ATG8A and mCherry-FYVE2 in WT (F) and atg2-1 (G) background. Seedlings were incubated in −N liquid medium for 2 days and treated with DMSO or 30 µM Wm for 1 h prior to microscopic observation. The PCCs were calculated from 11 (F) and 10 (G) images (mean ± se). Arrows (C, F, and G) indicate GFP-ATG8A puncta overlapping with mCherry-FYVE2 signal. Solid and open arrowheads (C, F, and G) indicate nonoverlapping puncta labeled only by mCherry-FYVE2 and GFP-ATG8A, respectively. Scale bars = 5 µm (A, C, F, and G) or 200 nm (D and E).
Figure 7
Figure 7
SAR1 function is crucial for autophagy. A, Confocal fluorescent images of WT or atg5-1 root cells expressing SAR1B-GFP. Seedlings grown in N-rich medium for 9 days were treated with DMSO, 0.5-µM ConA, or 0.5-µM ConA plus 30-µM Wm for 16 h prior to microscopic observation. B, Immunoblot analysis of SAR1B-GFP transgenic plants using anti-GFP antibodies. Seedlings were incubated as described above. The graph shows quantification of relative band intensities (mean ± se; n = 4 seedling populations). C and D, Anti-GFP immunoblot analysis of Arabidopsis leaf protoplasts transiently expressing AALP-GFP (C) or GFP-ATG8A (D) for 16–18 h. Immunoblot analysis using anti-GFP (upper), anti-Myc (middle; for the expression control) and anti-histone H3 (lower; for the loading control) antibodies. The graphs below (B–D) show the quantification of relative band intensities (mean ± se; n = 4). Columns marked with asterisks represent means that are significantly different from each other, according to t test. *0.01 < P < 0.05; **P < 0.01. E, Confocal fluorescence images of Col-0 leaf protoplasts transiently expressing GFP-ATG8A and either SAR1B-RFP, SAR1B(DN)-RFP, SAR1C-RFP, SAR1C(DN)-RFP, SAR1D-RFP, or SAR1D(DN)-RFP. Leaf protoplast preparations were incubated in liquid medium containing DMSO or 0.5 µM AZD for 1 h prior to observation. F, Quantification of GFP-ATG8A punctum number per 900 µm2, using images (n = 30–40) similar to those shown in (E). Columns marked with black and gray asterisks represent means that are significantly different from those of paired columns and of the DMSO controls, respectively, according to t test. G, Confocal fluorescence images of Col-0, atg7-2, atg2-1, or fyve2-2 leaf protoplasts transiently expressing GFP-ATG8A and SAR1B-RFP or SAR1B(DN)-RFP. The protoplasts were treated with ConA for 12 h prior to observation. The numbers show the quantification of vacuolar puncta per 400 µm2 area of the vacuole (mean ± se; n = 25–31 images). Scale bars = 5 µm.
Figure 8
Figure 8
Either fyve2 mutation or expression of the SAR1B DN fluorescent fusion leads to the over-accumulation of autophagic vesicles in the cytoplasm. A, Confocal fluorescence images of WT (first and second rows), fyve2-2 (third and fourth rows), and atg2-1 (fifth and sixth rows) protoplasts expressing GFP-ATG8A and either SAR1B-RFP (left columns) or SAR1B(DN)-RFP (right columns). Leaf protoplast preparations were incubated in liquid medium containing DMSO (first, third, and fifth rows) or 0.5 µM AZD for 1 h prior to observation. Scale bars = 5 µm. B, Quantification of GFP-ATG8A punctum number per 900 µm2, using images (n = 20–26) similar to those shown in (A). Columns marked with black and gray asterisks represent means that are significantly different from those of paired columns and of the DMSO controls, respectively, according to t test. Mean ± se. *0.01 < P < 0.05; **P < 0.01. C, A model for the roles of Arabidopsis FYVE2 and SAR1B in autophagosome biogenesis. The highly curved rim and neck of the phagophore are highlighted in red.

Comment in

  • Back to the roots: A focus on plant cell biology.
    Weijers D, Bezanilla M, Jiang L, Roeder AHK, Williams M. Weijers D, et al. Plant Cell. 2022 Jan 20;34(1):1-3. doi: 10.1093/plcell/koab278. Plant Cell. 2022. PMID: 34755878 Free PMC article. No abstract available.

References

    1. Arabidopsis Interactome Mapping Consortium. (2011) Evidence for network evolution in an Arabidopsis interactome map. Science 333: 601–607 - PMC - PubMed
    1. Avin-Wittenberg T, Baluska F, Bozhkov PV, Elander PH, Fernie AR, Galili G, Hassan A, Hofius D, Isono E, Le Bars R, et al. (2018) Autophagy-related approaches for improving nutrient use efficiency and crop yield protection. J Exp Bot 69: 1335–1353 - PubMed
    1. Axe EL, Walker SA, Manifava M, Chandra P, Roderick HL, Habermann A, Griffiths G, Ktistakis NT (2008) Autophagosome formation from membrane compartments enriched in phosphatidylinositol 3-phosphate and dynamically connected to the endoplasmic reticulum. J Cell Biol 182: 685–701 - PMC - PubMed
    1. Barberon M, Dubeaux G, Kolb C, Isono E, Zelazny E, Vert G (2014) Polarization of IRON-REGULATED TRANSPORTER 1 (IRT1) to the plant-soil interface plays crucial role in metal homeostasis. Proc Natl Acad Sci USA 111: 8293–8298 - PMC - PubMed
    1. Belda-Palazon B, Rodriguez L, Fernandez MA, Castillo MC, Anderson EA, Gao C, Gonzalez-Guzman M, Peirats-Llobet M, Zhao Q, De Winne N, et al. (2016) FYVE1/FREE1 interacts with the PYL4 ABA receptor and mediates its delivery to the vacuolar degradation pathway. Plant Cell 28: 2291–2311 - PMC - PubMed

Publication types

MeSH terms

Substances

LinkOut - more resources