. 2022 Jan;64(1):171-184.
doi: 10.1007/s00234-021-02825-5. Epub 2021 Oct 31.

MR imaging characteristics of uveal melanoma with histopathological validation

Affiliations

MR imaging characteristics of uveal melanoma with histopathological validation

Teresa A Ferreira et al. Neuroradiology. 2022 Jan.

Abstract

Purpose: To evaluate the magnetic resonance imaging (MRI) characteristics of uveal melanoma (UM), to compare them with fundoscopy and ultrasound (US), and to validate them with histopathology.

Methods: MR images from 42 UM were compared with US and fundoscopy, and on 14 enucleated cases with histopathology.

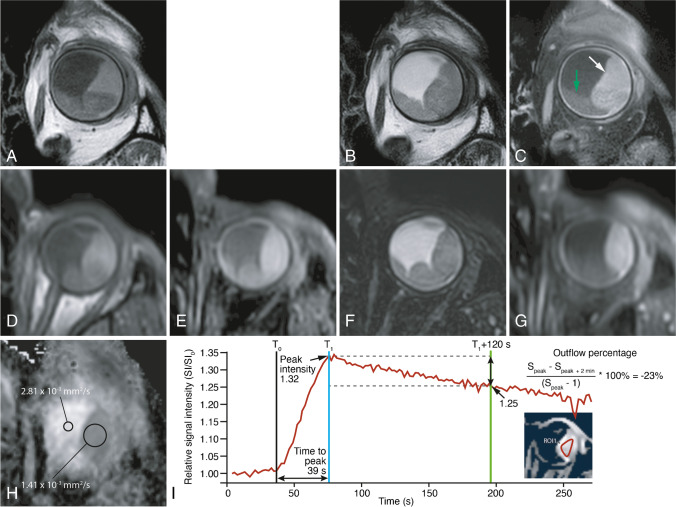
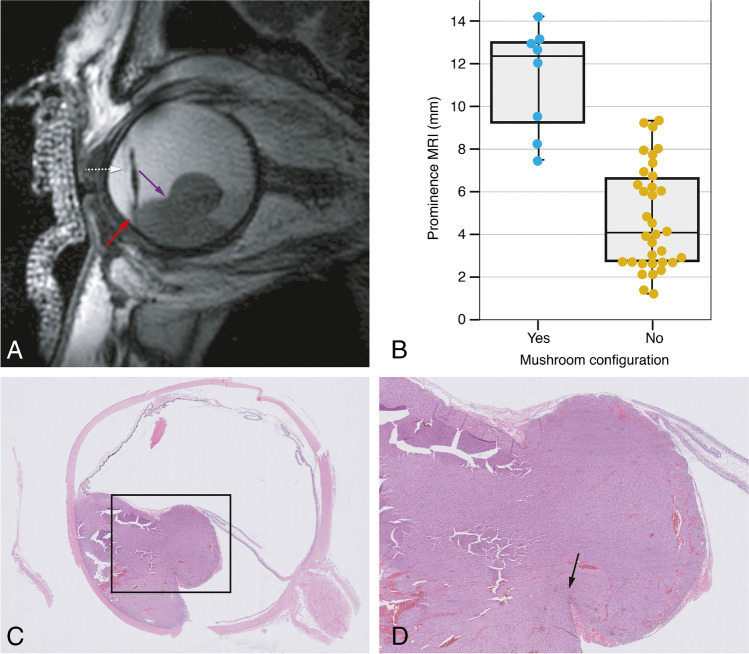
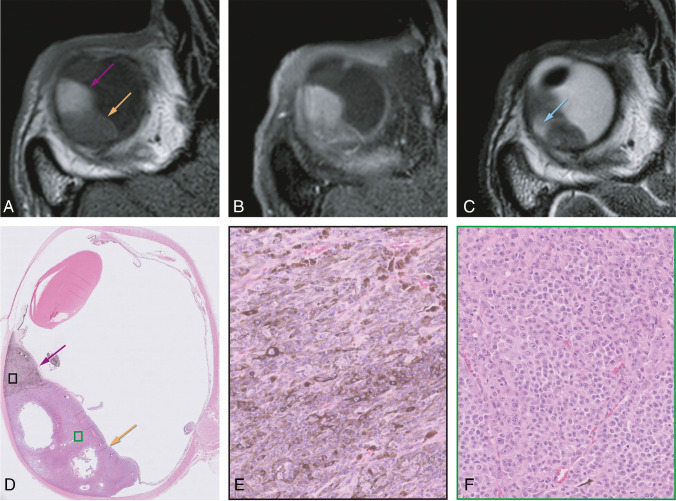
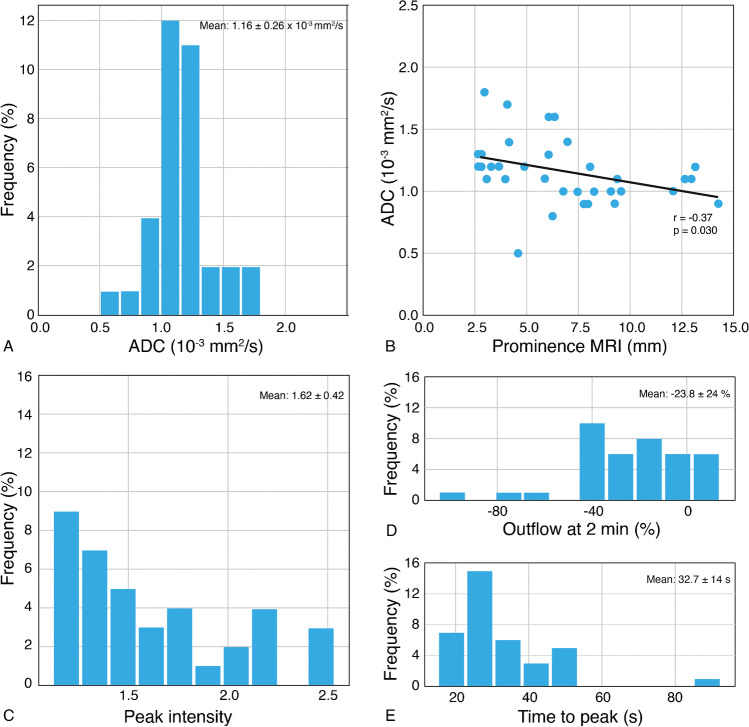
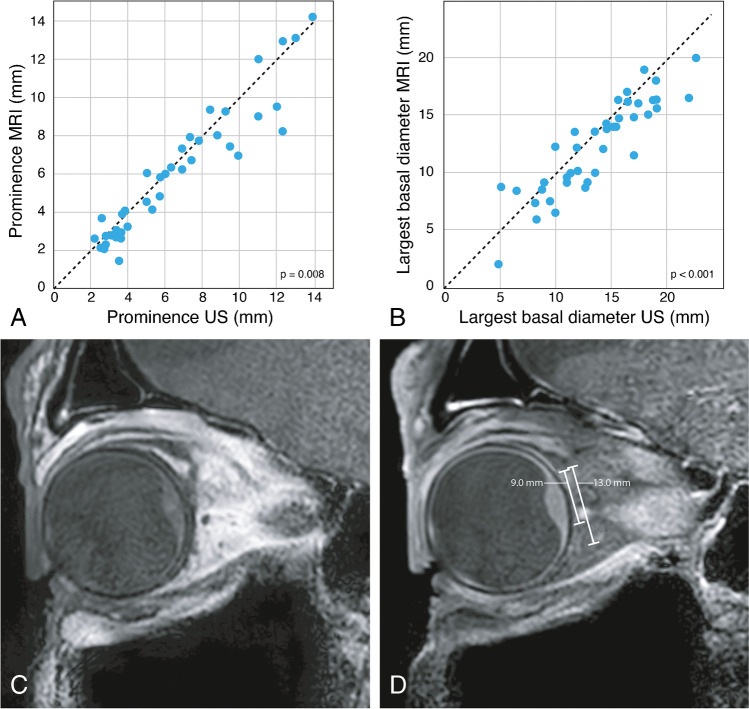
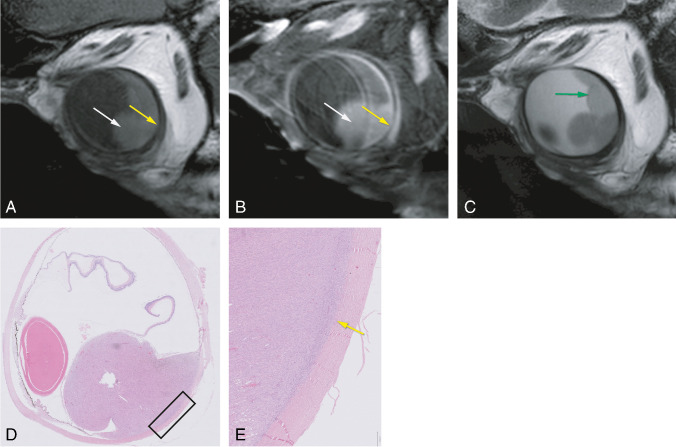
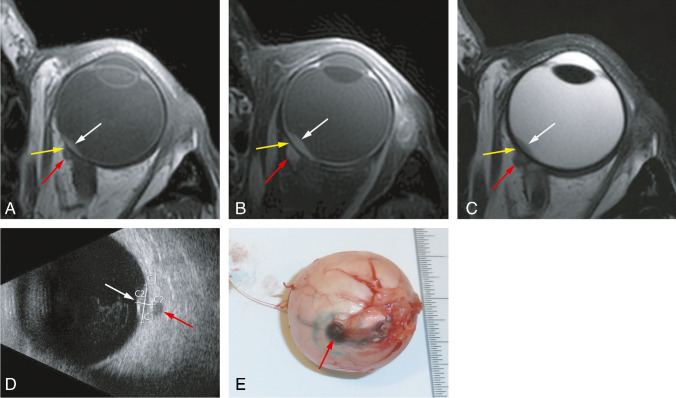
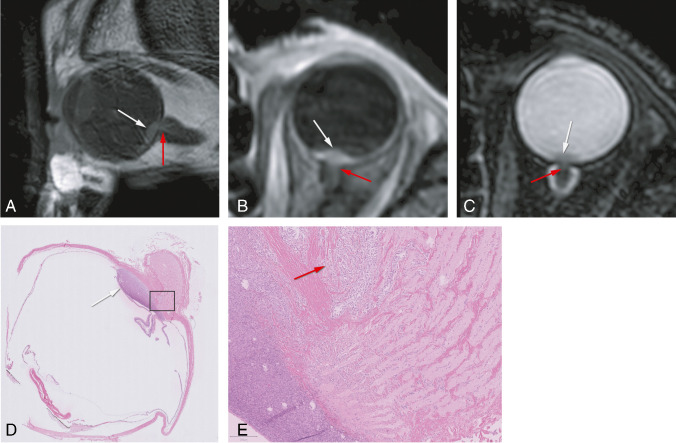
Results: A significant relationship between the signal intensity on T1 and pigmentation on histopathology was found (p=0.024). T1 hyperintense UM were always moderately or strongly pigmented on histopathology, while T1-hypointense UM were either pigmented or non-pigmented. Mean apparent diffusion coefficient (ADC) of the UM was 1.16 ± 0.26 × 10⁻³ mm2/s. Two-thirds of the UM had a wash-out and the remaining a plateau perfusion time-intensity curve (TIC). MRI was limited in evaluating the basal diameter of flat tumors. US tends to show larger tumor prominence (0.5mm larger, p=0.008) and largest basal diameter (1.4mm larger, p<0.001). MRI was good in diagnosing ciliary body involvement, extrascleral extension, and optic nerve invasion, but limited on identifying scleral invasion. An increase of tumor prominence was associated with lower ADC values (p=0.030) and favored a wash-out TIC (p=0.028). An increase of tumor ADC correlated with a plateau TIC (p=0.011).

Conclusions: The anatomical and functional MRI characteristics of UM were comprehensively assessed. Knowing the MRI characteristics of UM is important in order to confirm the diagnosis and to differentiate UM from other intra-ocular lesions and because it has implications for treatment planning. MRI is a good technique to evaluate UM, being only limited in case of flat tumors or on identifying scleral invasion.

Keywords: Histopathology; Magnetic resonance imaging; Ocular oncology; Ultrasound; Uveal melanoma.


Conflict of interest statement

We received research support from Philips Healthcare.

Figures

Fig. 1
Fig. 1
MRI ocular protocol. Uveal melanoma of the left eye (white arrow) with associated retinal detachment (green arrow). ADC of 1.4 × 10⁻³ mm2/s. Wash-out time-intensity curve at DCE. A MS T1. B MS T2. C MS contrast-enhanced T1 with fat signal suppression. D 3D TSE T1. E 3D TSE T1 with fat signal suppression. F 3D TSE T2 with fat signal suppression. G 3D TSE contrast-enhanced T1 with fat signal suppression. H ADC. I Quantitative evaluation of the DCE. Black line—arrival time (T0) = timepoint at which the lesion starts to enhance, determined manually. Blue line—corresponds approximately to the peak time (T1) = first timepoint when the lesion reached 95% of its maximum intensity, determined automatically and corresponding to the timepoint at which peak intensity (PI) is calculated. Time to peak (TTP) (s) = T1-T0. Green line—outflow percentage at 2 min (OP2,%) = percentage of signal intensity loss at 2 min compared to the intensity at the peak time. Notice the wash-out time-intensity curve. SI, signal intensity at every timepoint. SI0, signal intensity at timepoint zero
Fig. 2
Fig. 2
MR image of a mushroom configuration, its corresponding histopathological image, and the comparison of tumor prominence between uveal melanomas with and without a mushroom shape. A MRI with sagittal MS TSE T2-WI showing a UM with a mushroom configuration (purple arrow). There is invasion of the ciliary body and iris (red arrow). Notice that the iris can be clearly identified (white dashed arrow) and that the patient has an intraocular lens. B Boxplot to illustrate the relation between the presence of a mushroom configuration and tumor prominence (n=42). It is evident that a mushroom configuration is more present in tumors with larger prominences, with five patients having a tumor prominence of 12 mm or more. CD Histopathologic examination hematoxylin and eosin stain (H&E). Notice the rupture of the Bruch membrane in the region of the neck of the mushroom (black arrow)
Fig. 3
Fig. 3
Bipartite uveal melanoma with a good correspondence between signal intensity on T1 and pigmentation on histopathology. AC MRI with axials MS TSE T1-WI (A), contrast-enhanced T1-WI with fat signal suppression (B), and T2-WI (C). DF Histopathologic examination H&E. Bipartite UM of the right eye, with one component which is hyperintense on T1 and on histopathological examination strongly pigmented (pink arrows and E), and a second component which is hypointense on T1 and on histopathological examination non-pigmented (orange arrows and F). Notice that on T2, these two different components are not differentiated, but a small hyperintense area (blue arrow) is seen corresponding to a cystic necrotic area depicted on the histopathological examination. Notice also the presence of both epithelioid and spindle cells on the pigmented component (E), while the non-pigmented part only harbors epithelioid cells (F)
Fig. 4
Fig. 4
ADC and DCE quantitative results. A Histogram with ADC results of the UM (n=35). B Scatterplot ADC value versus tumor prominence (n=35), showing that larger tumors tend to have lower ADC values (r = −0.367; p=0.03). C Histogram with peak intensity results. D Histogram with outflow percentage 2 min results. E Histogram with time to peak results
Fig. 5
Fig. 5
Comparison of tumor prominence and largest basal diameter by MRI and by US measurement with a good correlation found for both dimensions. MRI limitations on measuring the largest basal diameter in flat uveal melanomas. A Scatterplot tumor prominence US versus MRI. B Scatterplot tumor largest basal diameter US versus MRI. CD MRI with sagittals MS TSE T1-WI (C) and contrast-enhanced T1-WI with fat signal suppression (D) showing different tumor basal diameters taking the peripheral flat tumor components into account or not. On MRI, a basal diameter of 9 mm was erroneously measured, while histopathology showed 14 mm. Retrospectively and taking the peripheral components of the tumor into account, 13 mm was obtained
Fig. 6
Fig. 6
MR and histopathological images of a uveal melanoma with scleral invasion. AC MRI with sagittals MS TSE T1 (A), contrast-enhanced T1-WI with fat signal suppression (B), and T2-WI (C). Uveal melanoma (white arrow) with scleral invasion. The scleral invasion (yellow arrow) is seen as sclera enhancement and irregularity. Associated retinal detachment (green arrow). DE Histopathologic examination H&E with corresponding findings of scleral invasion (yellow arrow)
Fig. 7
Fig. 7
MR and grossing images of a uveal melanoma with extrascleral extension. AC MRI with axials MS TSE T1-WI (A), contrast-enhanced T1-WI with fat signal suppression (B), and T2-WI (C). Small lentiform shape UM of the left eye (white arrow), with the extrascleral extension (red arrow) having, on all sequences, a signal intensity similar to its intraocular component. Notice the sclera, between the intra- and extraocular tumor components, with a normal aspect (yellow arrow). D B-scan ultrasound showing the small UM (white arrow) and also clearly the extrascleral extension (red arrow). E Enucleated eye at grossing with visible scleral and extrascleral extension (red arrow)
Fig. 8
Fig. 8
MR and histopathological images of a uveal melanoma with optic nerve invasion. AC MRI with sagittal MS TSE T1-WI (A) and axials 3D TSE contrast-enhanced T1-WI with fat signal suppression (B) and T2-WI with fat signal suppression (C) showing a small lentiform shape UM of the left eye (white arrow) with minimal invasion of the optic nerve (red arrow). DE Histopathologic examination H&E showing the UM (white arrow) with minimal invasion of the optic nerve (red arrow)
Fig. 9
Fig. 9
Comparison between the presence of loops (extracellular matrix patterns “vascular loops”) in histopathology and the perfusion parameters. AD. Scatterplots showing the relation between the presence of loops in histopathology and AT (A), TTP (B), PI (C), and OP2,% (D). Notice one UM without loops that, probably due its high vascularization, had perfusion values similar to the ones of UM with loops (red dots)

References

    1. Weis E, Salopek TG, McKinnon JG et al (2016) Management of uveal melanoma: a consensus-based provincial clinical practice guideline. Curr Oncol. 10.3747/co.23.2859 - PMC - PubMed
    1. Beenakker JWM, Ferreira TA, Soemarwoto KP, et al. Clinical evaluation of ultra-high-field MRI for three-dimensional visualisation of tumour size in uveal melanoma patients, with direct relevance to treatment planning. Magn Reson Mater Physics, Biol Med. 2016;29:571–577. doi: 10.1007/s10334-016-0529-4. - DOI - PMC - PubMed
    1. Foti PV, Longo A, Reibaldi M et al (2017) Uveal melanoma: quantitative evaluation of diffusion-weighted MR imaging in the response assessment after proton-beam therapy, long-term follow-up. Radiol Medica. 10.1007/s11547-016-0697-3 - PubMed
    1. Singh M, Durairaj P, Yeung J. Uveal melanoma: a review of the literature. Oncol Ther. 2018;6:87–104. doi: 10.1007/s40487-018-0056-8. - DOI - PMC - PubMed
    1. Carvajal RD, Piperno-Neumann S, Kapiteijn E, et al. Selumetinib in combination with dacarbazine in patients with metastatic uveal melanoma: a phase III, multicenter, randomized trial (SUMIT) J Clin Oncol. 2018;36:1232–1239. doi: 10.1200/JCO.2017.74.1090. - DOI - PubMed