

Associations between online food outlet access and online food delivery service use amongst adults in the UK: a cross-sectional analysis of linked data
- PMID: 34719382
- PMCID: PMC8557109
- DOI: 10.1186/s12889-021-11953-9
Associations between online food outlet access and online food delivery service use amongst adults in the UK: a cross-sectional analysis of linked data
Abstract
Background: Online food delivery services facilitate 'online' access to food outlets that typically sell lenergy-dense nutrient-poor food. Greater online food outlet access might be related to the use of this purchasing format and living with excess bodyweight, however, this is not known. We aimed to investigate the association between aspects of online food outlet access and online food delivery service use, and differences according to customer sociodemographic characteristics, as well as the association between the number of food outlets accessible online and bodyweight.
Methods: In 2019, we used an automated data collection method to collect data on all food outlets in the UK registered with the leading online food delivery service Just Eat (n = 33,204). We linked this with contemporaneous data on food purchasing, bodyweight, and sociodemographic information collected through the International Food Policy Study (analytic sample n = 3067). We used adjusted binomial logistic, linear, and multinomial logistic regression models to examine associations.
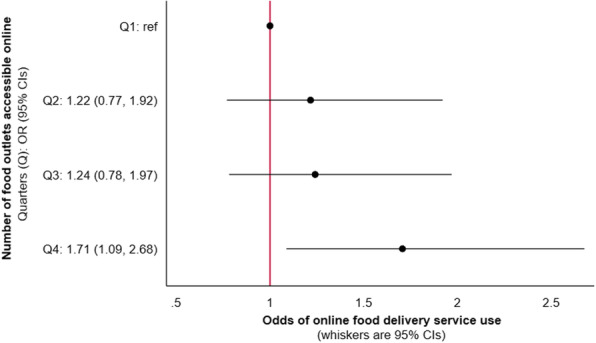
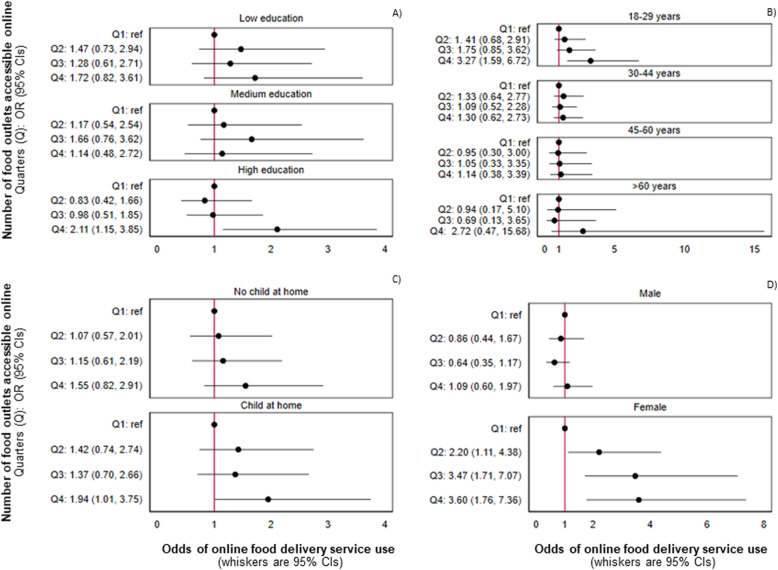
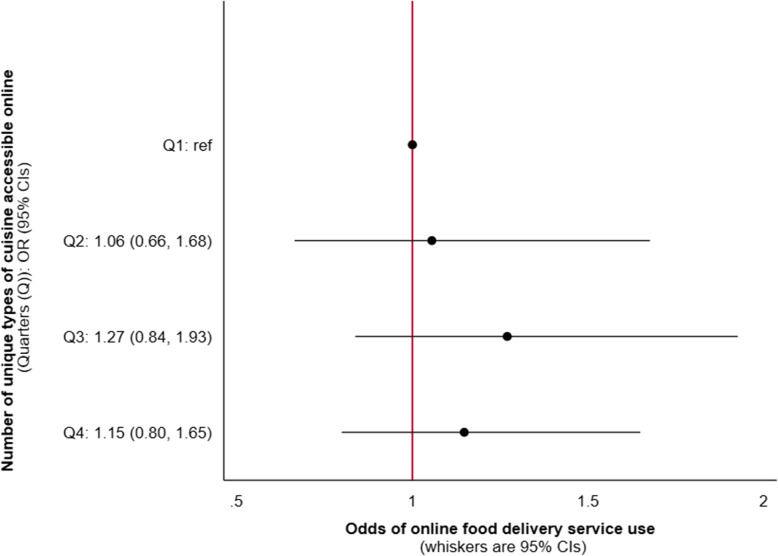
Results: Adults in the UK had online access to a median of 85 food outlets (IQR: 34-181) and 85 unique types of cuisine (IQR: 64-108), and 15.1% reported online food delivery service use in the previous week. Those with the greatest number of accessible food outlets (quarter four, 182-879) had 71% greater odds of online food delivery service use (OR: 1.71; 95% CI: 1.09, 2.68) compared to those with the least (quarter one, 0-34). This pattern was evident amongst adults with a university degree (OR: 2.11; 95% CI: 1.15, 3.85), adults aged between 18 and 29 years (OR: 3.27, 95% CI: 1.59, 6.72), those living with children (OR: 1.94; 95% CI: 1.01; 3.75), and females at each level of increased exposure. We found no association between the number of unique types of cuisine accessible online and online food delivery service use, or between the number of food outlets accessible online and bodyweight.
Conclusions: The number of food outlets accessible online is positively associated with online food delivery service use. Adults with the highest education, younger adults, those living with children, and females, were particularly susceptible to the greatest online food outlet access. Further research is required to investigate the possible health implications of online food delivery service use.
Keywords: Diet; Fast foods; Food delivery; Food environment; Obesity; Online food delivery services; Public health; Takeaway foods.
© 2021. The Author(s).
Conflict of interest statement
The authors declare that they have no competing interests.
Figures
References
-
- Jaworowska A, Toni MB, Rachel L, Catherine T, Matthew A, Leonard S, Ian GD. Nutritional composition of takeaway food in the UK. Nutr Food Sci. 2014;44(5):414–430. doi: 10.1108/NFS-08-2013-0093. - DOI
-
- Marty L, Evans R, Sheen F, Humphreys G, Jones A, Boyland E, et al. The energy and nutritional content of snacks sold at supermarkets and coffee shops in the UK. J Hum Nutr Diet. 2021. Published online ahead of print. - PubMed
-
- Needham C, Orellana L, Allender S, Sacks G, Blake MR, Strugnell C. Food retail environments in greater Melbourne 2008–2016: longitudinal snalysis of intra-city variation in density and healthiness of food outlets. Int J Environ Res Public Health. 2020;17(4):1321. doi: 10.3390/ijerph17041321. - DOI - PMC - PubMed
Publication types
MeSH terms
Grants and funding
LinkOut - more resources
Full Text Sources
Miscellaneous
