. 2021 Dec;13(1_suppl):1702S-1717S.
doi: 10.1177/19476035211053824. Epub 2021 Oct 31.

Apolipoprotein D as a Potential Biomarker and Construction of a Transcriptional Regulatory-Immune Network Associated with Osteoarthritis by Weighted Gene Coexpression Network Analysis

Affiliations

Apolipoprotein D as a Potential Biomarker and Construction of a Transcriptional Regulatory-Immune Network Associated with Osteoarthritis by Weighted Gene Coexpression Network Analysis

Yong Qin et al. Cartilage. 2021 Dec.

Abstract

Objective: Synovial inflammation influences the progression of osteoarthritis (OA). Herein, we aimed to identify potential biomarkers and analyze transcriptional regulatory-immune mechanism of synovitis in OA using weighted gene coexpression network analysis (WGCNA).

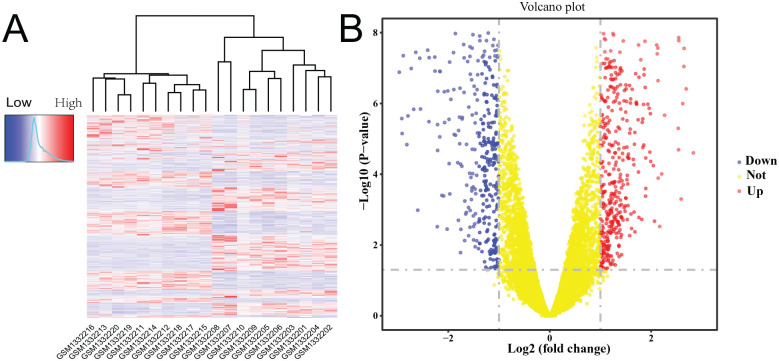
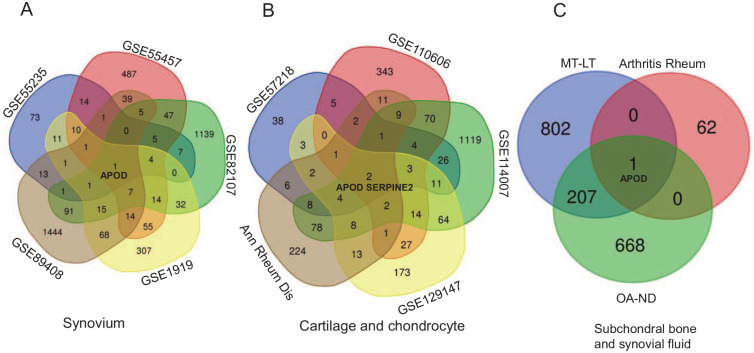
Design: A data set of OA synovium samples (GSE55235) was analyzed based on WGCNA. The most significant module with OA was identified and function annotation of the module was performed, following which the hub genes of the module were identified using Pearson correlation and a protein-protein interaction network was constructed. A transcriptional regulatory network of hub genes was constructed using the TRRUST database. The immune cell infiltration of OA samples was evaluated using the single-sample Gene Set Enrichment Analysis (ssGSEA) method. The hub genes coexpressed in multiple tissues were then screened out using data sets of synovium, cartilage, chondrocyte, subchondral bone, and synovial fluid samples. Finally, transcriptional factors and coexpressed hub genes were validated via experiments.

Results: The turquoise module of GSE55235 was identified via WGCNA. Functional annotation analysis showed that "mineral absorption" and "FoxO signaling pathway" were mostly enriched in the module. JUN, EGR1, FOSB, and KLF4 acted as central nodes in protein-protein interaction network and transcription factors to connect several target genes. "Activated B cell," "activated CD4T cell," "eosinophil," "neutrophil," and "type 17 T helper cell" showed high immune infiltration, while FOSB, KLF6, and MYBL2 showed significant negative correlation with type 17 T helper cell.

Conclusions: Our results suggest that the expression level of apolipoprotein D (APOD) was correlated with OA. Furthermore, transcriptional regulatory-immune network was constructed, which may contribute to OA therapy.

Keywords: hub genes; multiple tissues; osteoarthritis; transcriptional regulatory-immune network; weighted gene coexpression network analysis.


Conflict of interest statement

Declaration of Conflicting Interests: The author(s) declared no potential conflicts of interest with respect to the research, authorship, and/or publication of this article.

Figures

Figure 1.
Figure 1.
Flow diagram of the study design. The synovium data set GSE55235 of osteoarthritis was analyzed using differentially expressed genes analysis, weighted gene coexpression network analysis, function annotation, identification of hub genes, protein-protein interaction network analysis, and step-by-step immune infiltration. Then, the hub genes were screened with data sets of multiple tissues. Finally, transcriptional factors and coexpressed hub genes in multiple tissues were validated with experiments. WGCNA = weighted gene coexpression network analysis; PPI = protein-protein interaction.
Figure 2.
Figure 2.
Screening of differentially expressed genes (DEGs) from the OA synovium data set GSE55235. (A) Heatmap of DEGs between OA and normal tissues. (B) Volcano plot of DEGs between OA and normal tissues. |Fold Change| > 2 and P < 0.05 were considered as cutoff criteria. OA = osteoarthritis.
Figure 3.
Figure 3.
Construction of modules based on weighted gene coexpression network analysis. (A) Sample clustering of GSE55235 to detect outliers. (B) and (C) Soft power value screening of differentially expression genes for OA related coexpression modules. (D) Establishment of the cluster dendrogram in OA coexpression modules. OA = osteoarthritis.
Figure 4.
Figure 4.
The combination of heatmap (A) and module clustering (B) indicates that the turquoise module was highly related to OA. (C) Analysis of GS across modules showed that the turquoise module was significant. (D) A scatterplot of GS for OA versus module membership in the turquoise module. OA = osteoarthritis; GS, gene significance.
Figure 5.
Figure 5.
Function annotation of the turquoise module genes showing (A) biological process enrichment results, (B) cell component enrichment results, (C) molecular function enrichment results, and (D) Kyoto Encyclopedia of Genes and Genomes enrichment results. The size of the bubble indicates the gene number, while the color indicates the enrichment significance (−log10[P value]). cAMP = cyclic advenosine monophosphato; TNF = tumor necrosis factor.
Figure 6.
Figure 6.
Protein-protein interaction network construction of hub genes in the turquoise module. (A) Overview of the network with a combined score of >0.4. The larger the size of the node, the greater the number of connected nodes. (B) The top 20 genes are calculated based on the maximal clique centrality method. The redder colors of the node indicate greater connectedness.
Figure 7.
Figure 7.
Transcriptional regulation and immune characterization of hub genes. (A) Transcriptional regulatory network of hub genes. Yellow round nodes represent hub genes, blue round nodes represent target genes, and the square nodes with a red border represent transcription factors. (B) A heatmap of immune infiltration scores in OA samples. The color of the heatmap from blue to red indicates the increase in immune infiltration scores. (C) Transcription factor and immune cell type network. Yellow round nodes represent cell types, green triangle nodes represent transcription factors, yellow lines represent positive correlation, and grey lines represent negative correlation. (D) A correlation between the transcription factor and immune cell type. The color and proportion of pie chart indicate the Pearson correlation coefficient. (E) The correlation plot of “type 17 T helper cell” and expression of FOSB and KLF6. Each yellow point represents an OA sample. OA = osteoarthritis.
Figure 8.
Figure 8.
Screening coexpressed genes with multiple tissue data sets. (A) Venn diagram reveals that APOD was the only gene in synovium interactions. (B) Two genes were obtained in cartilage and chondrocyte interactions. (C) APOD was the only gene in subchondral bone and synovial fluid interactions. APOD = apolipoprotein D.
Figure 9.
Figure 9.
Validation of transcription factors and APOD expression. (A) Relative mRNA expression levels of transcription factors in FLS. N = 3 for each sample group. (B-C) APOD was downregulated in FLS and chondrocyte stimulated by IL-1β. N = 3 for each sample group. (D) APOD was downregulated in lesioned medial tibia than relatively normal lateral tibia. N =10 and n = 9 for medial and lateral sample groups, respectively. (E) We isolated total ribonucleic acid from relatively normal lateral tibia and the sclerosis area of the medial tibia. (F-G) Relative protein expression of APOD in medium supernatant of FLS and chondrocyte stimulated by IL-1β. N = 3 for each sample group. (H) Relative protein expression of APOD in synovial fluid. N = 5 for both osteoarthritis samples and control samples. Data are shown as mean ± standard error. ns = not significant; IL-1β = interleukin-1β; APOD = apolipoprotein D; FLS = fibroblast-like synoviocyte; *P < .05, **P < .01, ***P < .001.

References

    1. Shi Y, Hu X, Cheng J, Zhang X, Zhao F, Shi W, et al.. A small molecule promotes cartilage extracellular matrix generation and inhibits osteoarthritis development. Nat Commun. 2019;10:1914. doi:10.1038/s41467-019-09839-x. - DOI - PMC - PubMed
    1. Postler A, Goronzy J, Günther KP, Lange T, Redeker I, Schmitt J, et al.. Which disease-related factors influence patients’ and physicians’ willingness to consider joint replacement in hip and knee OA? Results of a questionnaire survey linked to claims data. BMC Musculoskelet Disord. 2020;21:352. doi:10.1186/s12891-020-03368-1. - DOI - PMC - PubMed
    1. Martel-Pelletier J, Barr AJ, Cicuttini FM, Conaghan PG, Cooper C, Goldring MB, et al.. Osteoarthritis. Nat Rev Dis Primers. 2016;2:16072. doi:10.1038/nrdp.2016.72. - DOI - PubMed
    1. Hügle T, Geurts J. What drives osteoarthritis? Synovial versus subchondral bone pathology. Rheumatology (Oxford). 2017;56:1461-71. doi:10.1093/rheumatology/kew389. - DOI - PubMed
    1. Han D, Fang Y, Tan X, Jiang H, Gong X, Wang X, et al.. The emerging role of fibroblast-like synoviocytes-mediated synovitis in osteoarthritis: an update. J Cell Mol Med. 2020;24:9518-32. doi:10.1111/jcmm.15669. - DOI - PMC - PubMed

Publication types