. 2021;83(8):51.
doi: 10.1007/s00445-021-01476-x. Epub 2021 Jul 16.

Quantitative chemical mapping of plagioclase as a tool for the interpretation of volcanic stratigraphy: an example from Saint Kitts, Lesser Antilles

Affiliations

Quantitative chemical mapping of plagioclase as a tool for the interpretation of volcanic stratigraphy: an example from Saint Kitts, Lesser Antilles

Oliver Higgins et al. Bull Volcanol. 2021.

Abstract

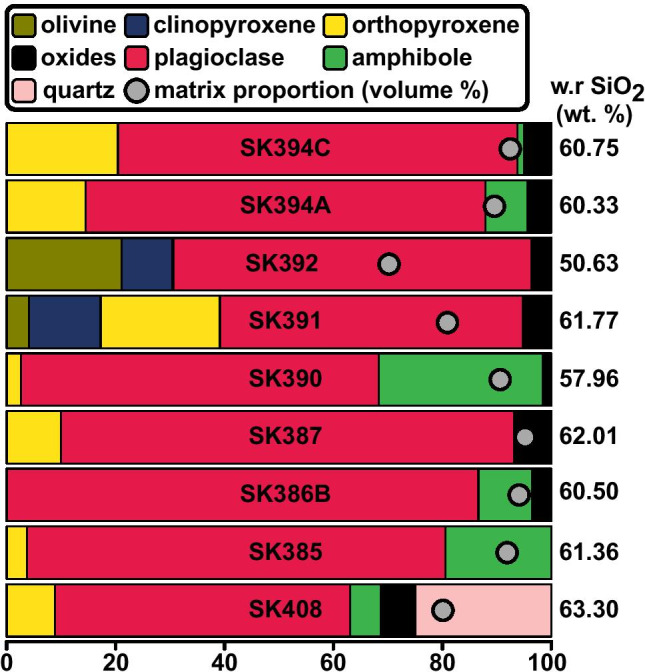
Establishing a quantitative link between magmatic processes occurring at depth and volcanic eruption dynamics is essential to forecast the future behaviour of volcanoes, and to correctly interpret monitoring signals at active centres. Chemical zoning in minerals, which captures successive events or states within a magmatic system, can be exploited for such a purpose. However, to develop a quantitative understanding of magmatic systems requires an unbiased, reproducible method for characterising zoned crystals. We use image segmentation on thin section scale chemical maps to segment textural zones in plagioclase phenocrysts. These zones are then correlated throughout a stratigraphic sequence from Saint Kitts (Lesser Antilles), composed of a basal pyroclastic flow deposit and a series of fall deposits. Both segmented phenocrysts and unsegmented matrix plagioclase are chemically decoupled from whole rock geochemical trends, with the latter showing a systematic temporal progression towards less chemically evolved magma (more anorthitic plagioclase). By working on a stratigraphic sequence, it is possible to track the chemical and textural complexity of segmented plagioclase in time, in this case on the order of millennia. In doing so, we find a relationship between the number of crystal populations, deposit thickness and time. Thicker deposits contain a larger number of crystal populations, alongside an overall reduction in this number towards the top of the deposit. Our approach provides quantitative textural parameters for volcanic and plutonic rocks, including the ability to measure the amount of crystal fracturing. In combination with mineral chemistry, these parameters can strengthen the link between petrology and volcanology, paving the way towards a deeper understanding of the magmatic processes controlling eruptive dynamics.

Supplementary information: The online version contains supplementary material available at 10.1007/s00445-021-01476-x.

Keywords: Anorthite; Crystal population; Image segmentation; Magma; Zoning.


Conflict of interest statement

Conflict of interestThe authors declare no competing interests.

Figures

Fig. 1
Fig. 1
a Map of the Lesser Antilles island arc modified after Toothill et al. (2007). The arc is divided into the active Volcanic Caribbees (west) and inactive Limestone Caribbees (east). Saint Kitts, the field area for this study, is located at the northern tip of the Volcanic Caribbees. b Geological map of Saint Kitts, Lesser Antilles, modified after Geologist and Martin-Kaye (1959). The island consists of four volcanic centres which young towards the NW. Peléan Style volcanic domes of various ages outcrop across the island (e.g. Baker, 1968). Study locality is a sea cliff showing a well-exposed pyroclastic sequence between the villages of Mansion and Tabernacle
Fig. 2
Fig. 2
a Stratigraphic sequence that is the focus of this study. A basal pyroclastic flow deposit separates the Lower Mansion Series (units A–C according to Roobol et al., 1981). Strata are subhorizontal and show no signs of reworking. b Material was excavated to retrieve a fresh surface for sampling and field measurements. c A land snail (genus: Cerion) inside a palaeosoil layer
Fig. 3
Fig. 3
Example of image segmentation of plagioclase zoning inside exemplar crystals from sample SK408. White areas within a crystal represent mixed pixels (e.g. containing melt inclusions, cracks, etc.). In this example, segmentation splits plagioclase crystals in up to three distinct spatial-chemical zones (ac). Zoning patterns from segmentation match well with observations from Ca and Na zoning in chemical maps. The An# distributions of all segmented zones from all crystals within the stratigraphy are compared using hierarchical clustering to produce zoning groups (colours in Fig. 3) in which An# distributions are comparable (d). Crystals are not to scale. Letters are to be used to match zoning domains to each individual barplot in d
Fig. 4
Fig. 4
Variation of selected major and trace elements of the Saint Kitts Lower Mansion Series as a function of stratigraphic height (relative age). Samples chosen for quantitative mapping are indicated by large, coloured symbols. Different deposits (see Online Resource 1, Table S1 for details) are separated with horizontal lines. Palaeosoil horizons are shown in light brown
Fig. 5
Fig. 5
Modal mineralogy of crystals in volume % for all chemically mapped samples in stratigraphic order (oldest at the base). Matrix volume % is shown as grey dots. Whole rock wt% SiO2 is reported for each unit on the right of each bar
Fig. 6
Fig. 6
An# distributions of plagioclase for all chemically mapped samples. Panels from left to right are a all plagioclase, b phenocryst plagioclase that has been included in the textural segmentation (with a crystal area ≥ 81 pixels or 32400 µm2), c phenocryst rims (outermost pixel of all phenocrysts) and d matrix plagioclase (unsegmented plagioclase). Vertical black dashed lines are the mean An# for each distribution. Grey points are whole rock wt% SiO2. Phenocrysts generally show bimodal distributions which reflect composite zoning patterns in plagioclase phenocrysts. Matrix plagioclase shows unimodal distributions with slight tails to higher An#, e.g. SK390. Distributions considering all plagioclase show wider distributions that capture features from both segmented and matrix plagioclase. Grey bar in d shows An# ~ 85 where the mean of the anorthite distributions for matrix plagioclase becomes invariant at the top of the sequence
Fig. 7
Fig. 7
An# distributions of all segmented crystals, divided into 13 zoning groups. Zoning groups are ordered by decreasing abundance of crystals present in each group and coloured by sample. Dashed lines signify the interquartile range of each An# distribution. Three pieces of scoria were scanned for sample SK392 (A, B, C; upper x-axis labels)
Fig. 8
Fig. 8
Population abundance for each sample plotted in stratigraphic order. A population is defined as crystals with the same combination of zoning groups (e.g. “1, 13” would be crystals composed of zoning group 1 + zoning group 13). Green, yellow, orange and red boxes denote 1, 2, 3 and 4 zoning groups per crystal, respectively. The interiors of boxes are shaded for abundance (% of crystals). SK394A and SK394C have amongst the lowest number of populations, with homogeneous crystals of zoning group 2 dominating in both samples. Right margin labels show volcanic deposit thickness (cm). In general, thicker deposits have a higher number of crystal populations. Note that the three samples of SK392 contain near-identical crystal populations even using relatively small scan areas (≤ 50 mm2) for the chemical maps
Fig. 9
Fig. 9
Fracture index (FI) vs rim An# interquartile range of all phenocrysts (crystals subjected to zone segmentation). Crystals growing with concentric zoning patterns should have their youngest zone surrounding the crystal margin, irrespective of cut section effects (Fig. 3 of Cheng et al., 2017). One mechanism for this condition not being satisfied is that the crystal is fractured, exposing core or mantle zones on the outer margin of the crystal. This process is evident in thin section and chemical maps from Saint Kitts samples, as well as in the exemplar crystal from SK408 (inset of this figure). The fracture index is defined as 100 minus the percentage of the most abundant zoning group that occupies the rim of each crystal (Eq. 1). The rim is defined as the outermost pixel of each crystal. The greater the fracture index, the higher the likelihood of crystal fracturing. Those crystals with FI = 0 are all single zoning group crystals (crystals with FI = 0 have been jittered in the Y direction for clarity and lie within the grey-shaded area). There is a correlation between the mean FI (diamonds) and the rim An# interquartile range, suggesting scatter in An# of phenocryst rims (Fig. 6c) is largely being controlled by crystal fracturing. Numbers inside diamonds relate to relative stratigraphic order of the samples (1 = oldest, 9 = youngest)

References

    1. Annen C, Blundy JD, Sparks RSJ. The genesis of intermediate and silicic magmas in deep crustal hot zones. J Petrol. 2006;47:505–539. doi: 10.1093/petrology/egi084. - DOI
    1. Baker PE. Volcanic hazards on St Kitts and Montserrat, West Indies. J Geol Soc. 1985;142:279–295. doi: 10.1144/gsjgs.142.2.0279. - DOI
    1. Baker PE. Geology and geochemistry of the mansion pyroclast fall succession. St Kitts Bull Volcanol. 1980;43:303–310. doi: 10.1007/BF02598034. - DOI
    1. Baker PE. Petrology of Mt. Misery Volcano, St. Kitts. West Indies Lithos. 1968;1:124–150. doi: 10.1016/S0024-4937(68)80004-0. - DOI
    1. Baker PE, Holland JG. Geochemical variations in a pyroclastic succession on St. Kitts. West Indies Bull Volcanol. 1973;37:472–490. doi: 10.1007/BF02596887. - DOI

LinkOut - more resources