. 2021;52(8):995-1015.
doi: 10.1007/s00723-021-01321-6. Epub 2021 Mar 29.

DEER and RIDME Measurements of the Nitroxide-Spin Labelled Copper-Bound Amine Oxidase Homodimer from Arthrobacter Globiformis

Affiliations

DEER and RIDME Measurements of the Nitroxide-Spin Labelled Copper-Bound Amine Oxidase Homodimer from Arthrobacter Globiformis

Hannah Russell et al. Appl Magn Reson. 2021.

Abstract

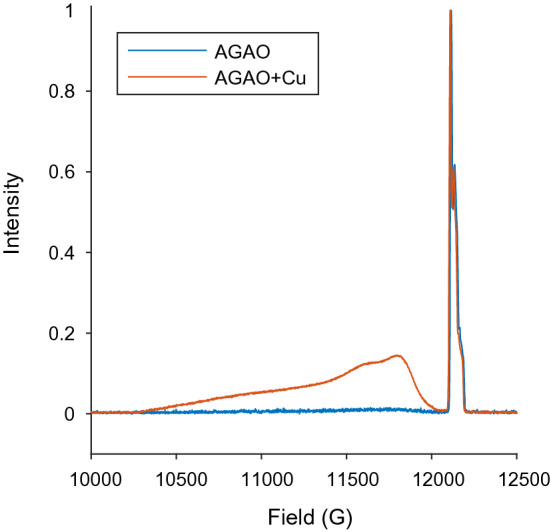
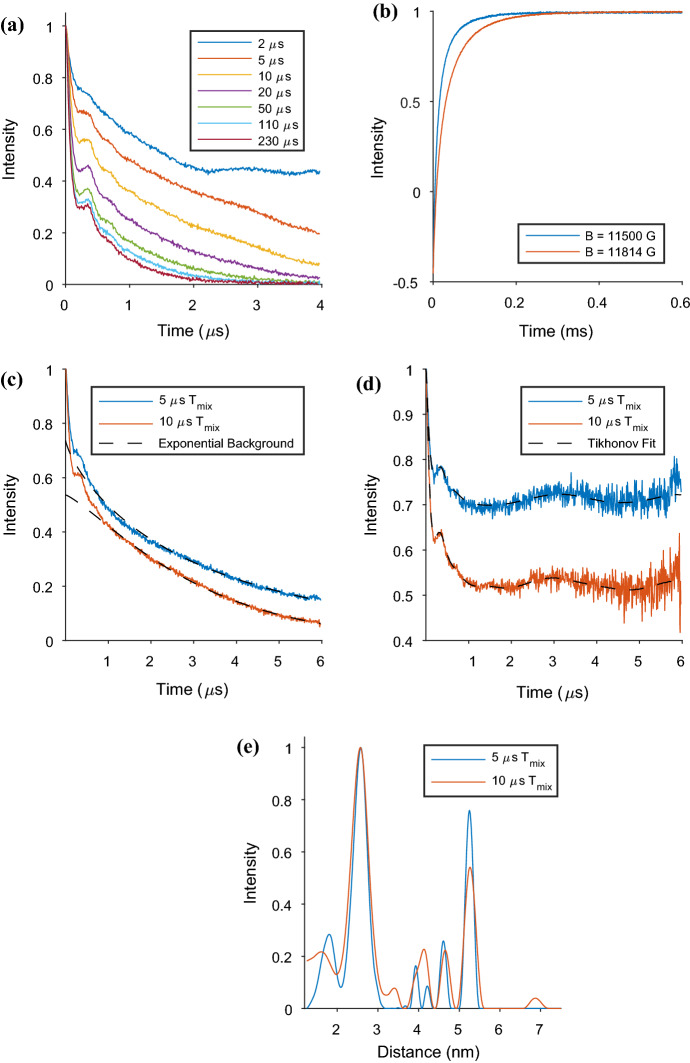
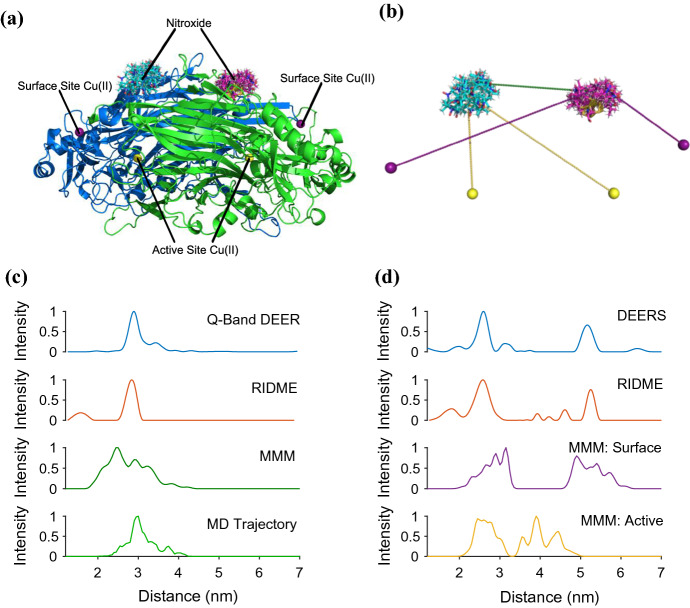
In the study of biological structures, pulse dipolar spectroscopy (PDS) is used to elucidate spin-spin distances at nanometre-scale by measuring dipole-dipole interactions between paramagnetic centres. The PDS methods of Double Electron Electron Resonance (DEER) and Relaxation Induced Dipolar Modulation Enhancement (RIDME) are employed, and their results compared, for the measurement of the dipolar coupling between nitroxide spin labels and copper-II (Cu(II)) paramagnetic centres within the copper amine oxidase from Arthrobacter globiformis (AGAO). The distance distribution results obtained indicate that two distinct distances can be measured, with the longer of these at c.a. 5 nm. Conditions for optimising the RIDME experiment such that it may outperform DEER for these long distances are discussed. Modelling methods are used to show that the distances obtained after data analysis are consistent with the structure of AGAO.

Supplementary information: The online version contains supplementary material available at 10.1007/s00723-021-01321-6.


Figures

Fig. 1
Fig. 1
Echo-detected field swept spectra of the AGAO protein samples before and after extra Cu(II) was added to the system. The result shows the original AGAO sample (before Cu(II) was added) to be an essentially apo-protein, while the AGAO + Cu field sweep clearly shows Cu(II)
Fig. 2
Fig. 2
The results of DEER and RIDME measurements on the AGAO sample prior to extra Cu(II) being added to the system are presented. Both the DEER and RIDME experiments were run at a temperature of 25 K. The RIDME experiment used Q-band frequency, while the DEER experiments were run at both X and Q-band. The RIDME experiment used a Tmix of 40 μs; a raw data for DEER and RIDME measurements. The background of each spectrum is also presented as a dashed line on these plots; b background corrected data again for DEER and RIDME. Here, the Tikhonov regularisation fit is also presented as a dashed line on each spectrum; c distance distributions found from DEER and RIDME measurements after background correction and using Tikhonov regularisation methods
Fig. 3
Fig. 3
RIDME measurements, all measured at 30 K on the AGAO + Cu sample, with different mixing time values and collection window time lengths; a raw data collected from RIDME measurements on the AGAO + Cu sample, all measured at 30 K with τ2 = 4280 ns, with mixing time values ranging from 2 μs to 230 μs; b inversion recovery curves measured on the Cu(II) spins at two field positions (11,500 G and 11,814 G), the corresponding echo decays are in Fig. S4; c raw data of RIDME experiments measured at two mixing times, 5 μs and 10 μs, with τ2 = 6280 ns. The accompanying background, fit with a stretched exponential function, are also presented; d is the background corrected RIDME traces of the data shown in c with Tikhonov regularisation fit, and e distance distributions extracted from both measurements
Fig. 4
Fig. 4
The results of the ‘best’ DEER and RIDME measurements, selected based on the criteria discussed in the main text, on the AGAO + Cu are presented. Both the three and four-pulse DEER experiments, stitched together into a DEERS spectrum, were run at a temperature of 15 K at X-Band frequency, while the RIDME experiment was run at 30 K with Tmix = 5 μs; a raw data for DEER and RIDME measurements. The background of each spectrum is also presented as a dashed line on these plots; b background corrected data again for DEER and RIDME. Here, the Tikhonov regularisation fit is also presented as a dashed line on each spectrum; c distance distributions found from DEER and RIDME measurements after background correction and using Tikhonov regularisation methods
Fig. 5
Fig. 5
Distance result analysis in terms of AGAO protein structure; a shows the MD-derived AGAO model with MMM-calculated R1 rotamers. The active and surface site Cu(II) ions are labelled. In b, a schematic of the distance measurements between R1 and Cu(II) centres is presented. The following two panels show the distance distributions extracted using Tikhonov regularisation methods from background corrected RIDME and Q-band DEER measurements compared to MMM calculations for c AGAO sample prior to extra Cu being added to the system and d AGAO + Cu sample

Similar articles

Cited by

References

    1. D. Goldfarb and S. Stoll, EPR Spectroscopy: Fundamentals and Methods. 2018: Wiley.
    1. Abdullin D, Schiemann O. ChemPlusChem. 2020;85(2):353–372. doi: 10.1002/cplu.201900705. - DOI - PubMed
    1. Roessler MM, Salvadori E. Chem. Soc. Rev. 2018;47(8):2534–2553. doi: 10.1039/C6CS00565A. - DOI - PubMed
    1. Jeschke G. Annu. Rev. Phys. Chem. 2012;63(1):419–446. doi: 10.1146/annurev-physchem-032511-143716. - DOI - PubMed
    1. Todd AP, Cong J, Levinthal F, Levinthal C, Hubbell WL. Proteins. 1989;6(3):294–305. doi: 10.1002/prot.340060312. - DOI - PubMed

LinkOut - more resources