. 2021 Oct 13:15:733115.
doi: 10.3389/fnins.2021.733115. eCollection 2021.

A Novel Histological Technique to Assess Severity of Traumatic Brain Injury in Rodents: Comparisons to Neuroimaging and Neurological Outcomes

Affiliations

A Novel Histological Technique to Assess Severity of Traumatic Brain Injury in Rodents: Comparisons to Neuroimaging and Neurological Outcomes

Dmitry Frank et al. Front Neurosci. .

Abstract

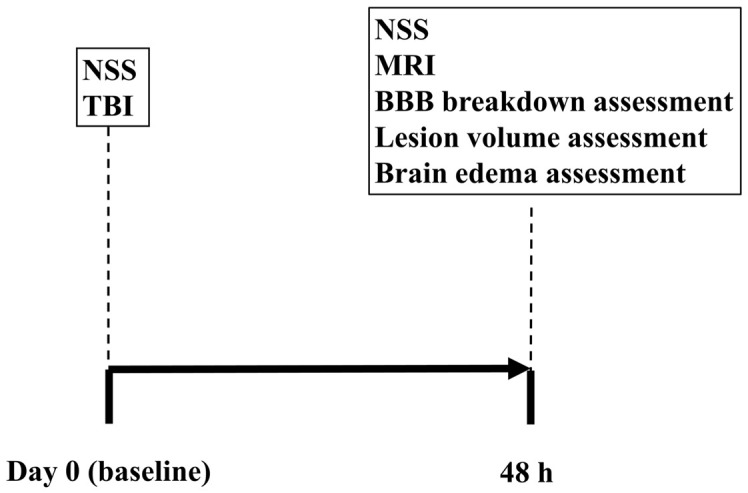
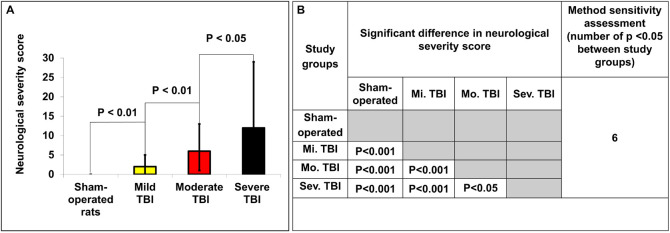
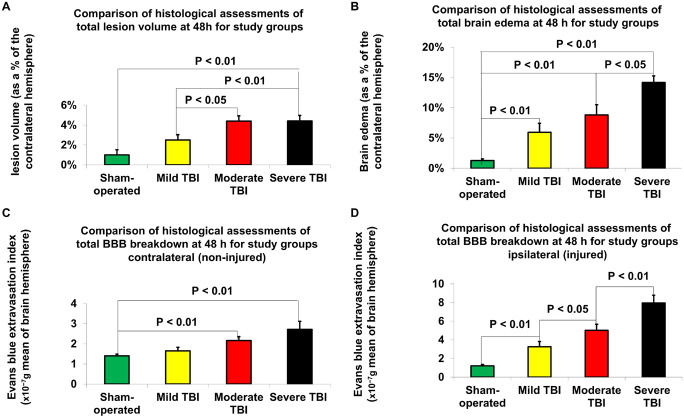
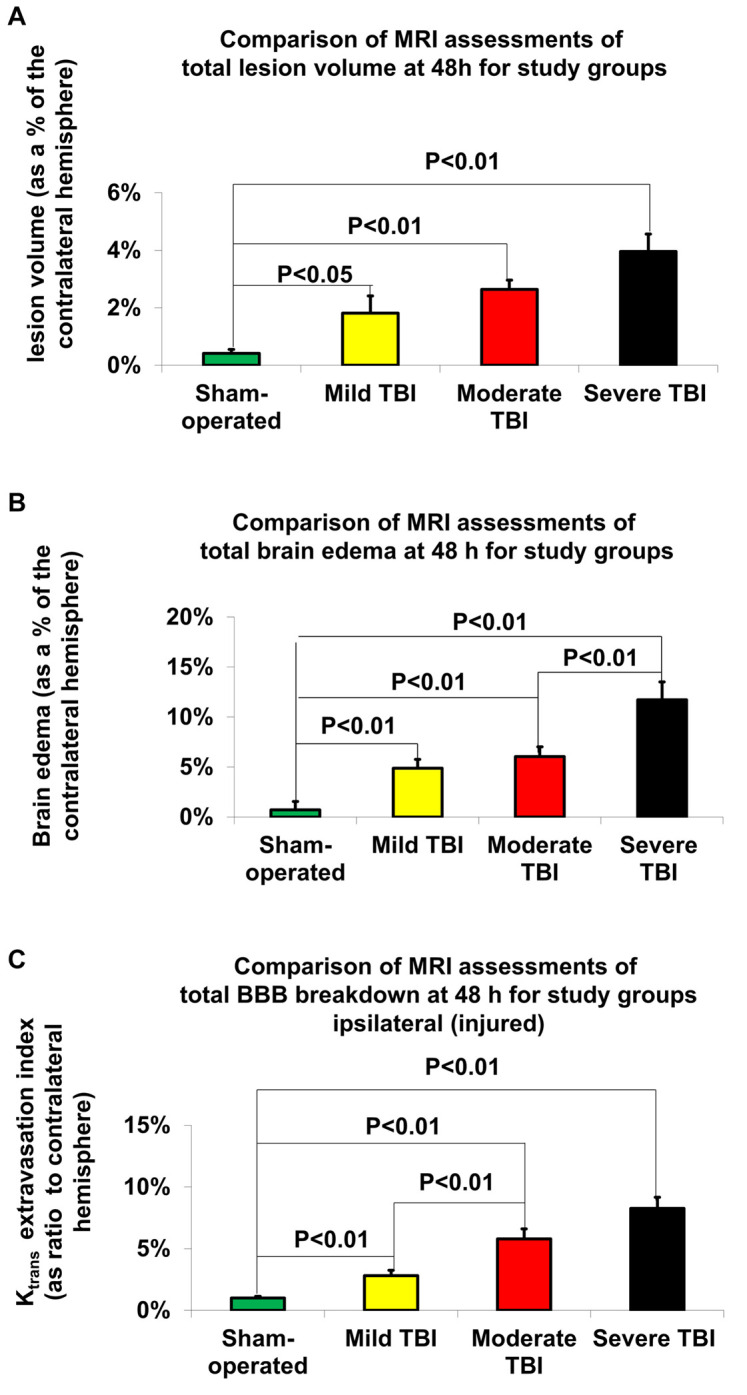
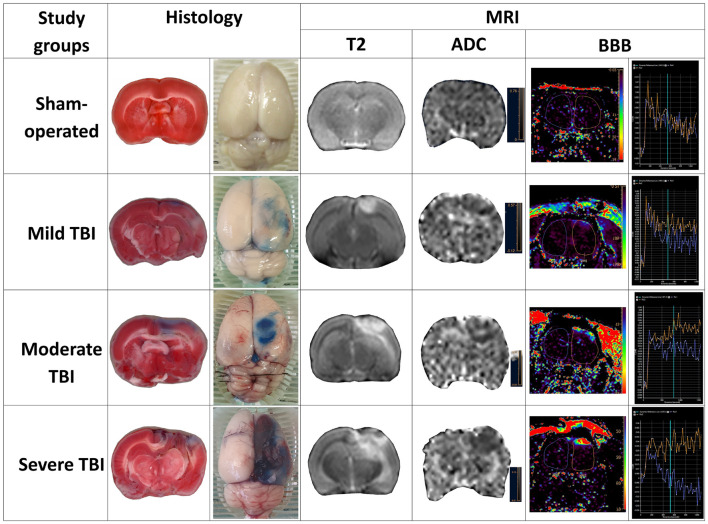
Here we evaluate an alternative protocol to histologically examine blood-brain barrier (BBB) breakdown, brain edema, and lesion volume following traumatic brain injury (TBI) in the same set of rodent brain samples. We further compare this novel histological technique to measurements determined by magnetic resonance imaging (MRI) and a neurological severity score (NSS). Sixty-six rats were randomly assigned to a sham-operated, mild TBI, moderate TBI, or severe TBI group. 48 h after TBI, NSS, MRI and histological techniques were performed to measure TBI severity outcome. Both the histological and MRI techniques were able to detect measurements of severity outcome, but histologically determined outcomes were more sensitive. The two most sensitive techniques for determining the degree of injury following TBI were NSS and histologically determined BBB breakdown. Our results demonstrate that BBB breakdown, brain edema, and lesion volume following TBI can be accurately measured by histological evaluation of the same set of brain samples.

Keywords: histology; magnetic imaging resonance; methods; rodent; traumatic brain injury.


Conflict of interest statement

The authors declare that the research was conducted in the absence of any commercial or financial relationships that could be construed as a potential conflict of interest.

Figures

FIGURE 1
FIGURE 1
Experimental timeline.
FIGURE 2
FIGURE 2
Determination of neurological severity score 48 h after TBI. (A) The neurological severity score (NSS) 48 h after TBI in the different experimental groups. There was a significant difference in NSS between groups 48 h after TBI (p < 0.05). The data are measured as counts and presented as median ± range. (B) Comparison of significant differences (displayed as the p value) between the NSS of different experimental groups.
FIGURE 3
FIGURE 3
Histological assessment of outcome parameters 48 h after TBI. (A) Lesion volume. The data are expressed as a percentage of the contralateral hemisphere and presented as mean ± SEM. (B) Brain edema. The data are expressed as a percentage of the contralateral hemisphere and presented as mean ± SEM. (C) Blood-brain barrier (BBB) breakdown on contralateral (non-injured) hemisphere. The data are measured in 10– 7g of brain tissue and presented as mean ± SEM. (D) BBB breakdown on ipsilateral (injured) hemisphere. Significant differences were found between groups of varying injury severity. The data are measured in ng/g of brain tissue and presented as mean ± SEM.
FIGURE 4
FIGURE 4
MRI-determined outcome parameters 48 h after TBI. (A) Lesion volume. The data are expressed as a percentage of the contralateral hemisphere and presented as mean ± SEM. (B) Brain edema. The data are expressed as a percentage of the contralateral hemisphere and presented as mean ± SEM. (C) Blood-brain barrier (BBB) breakdown. The data are expressed as a percentage of the contralateral hemisphere and presented as mean ± SEM.
FIGURE 5
FIGURE 5
Representative sample of parameters of severity outcome following TBI by histological and MRI-determined techniques in the various experimental groups.

References

    1. Ahishali B., Kaya M. (2020). Evaluation of blood-brain barrier integrity using vascular permeability markers: evans blue, sodium fluorescein, albumin-alexa fluor conjugates, and horseradish peroxidase. Methods Mol. Biol. 2367:87–103. 10.1007/7651_2020_316 - DOI - PubMed
    1. Albrecht J., Polenz D., Kuhl A. A., Rogasch J. M., Leder A., Sauer I. M., et al. (2019). Diffusion-weighted magnetic resonance imaging using a preclinical 1 T PET/MRI in healthy and tumor-bearing rats. EJNMMI Res. 9 1–11. 10.1186/s13550-019-0489-6 - DOI - PMC - PubMed
    1. Alves J. L. (2014). Blood–brain barrier and traumatic brain injury. J. Neurosci. Res. 92 141–147. 10.1002/jnr.23300 - DOI - PubMed
    1. Bardutzky J., Shen Q., Henninger N., Bouley J., Duong T. Q., Fisher M. (2005). Differences in ischemic lesion evolution in different rat strains using diffusion and perfusion imaging. Stroke 36 2000–2005. 10.1161/01.STR.0000177486.85508.4d - DOI - PMC - PubMed
    1. Başkaya M. K., Dogan A., Temiz C., Dempsey R. J. (2000). Application of 2, 3, 5-triphenyltetrazolium chloride staining to evaluate injury volume after controlled cortical impact brain injury: role of brain edema in evolution of injury volume. J. Neurotr. 17 93–99. 10.1089/neu.2000.17.93 - DOI - PubMed

LinkOut - more resources