. 2021 Oct 14:13:755164.
doi: 10.3389/fnagi.2021.755164. eCollection 2021.

Inhibition of Rho Kinase by Fasudil Ameliorates Cognition Impairment in APP/PS1 Transgenic Mice via Modulation of Gut Microbiota and Metabolites

Affiliations

Inhibition of Rho Kinase by Fasudil Ameliorates Cognition Impairment in APP/PS1 Transgenic Mice via Modulation of Gut Microbiota and Metabolites

Yuqing Yan et al. Front Aging Neurosci. .

Abstract

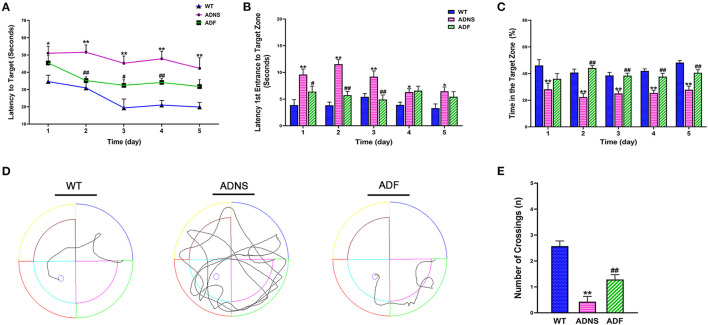
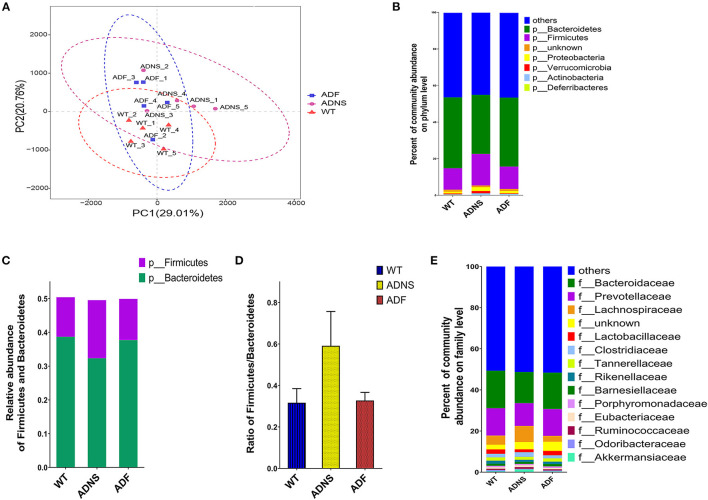
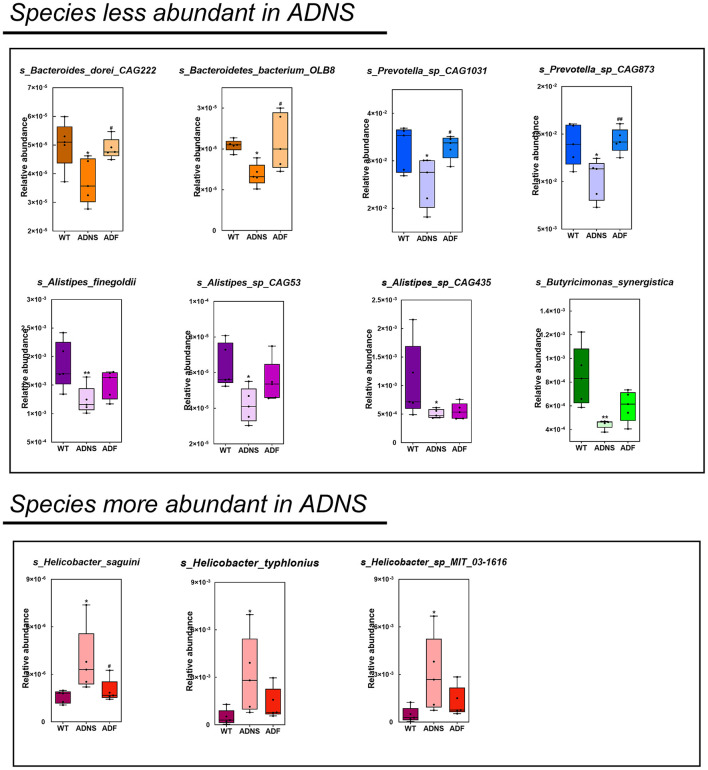
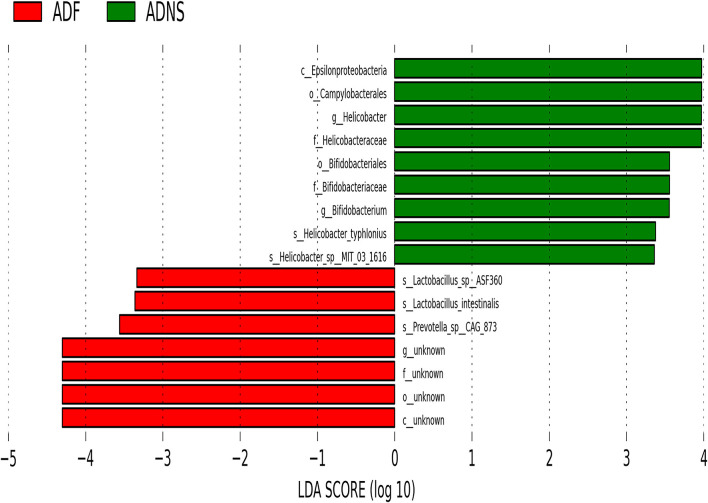
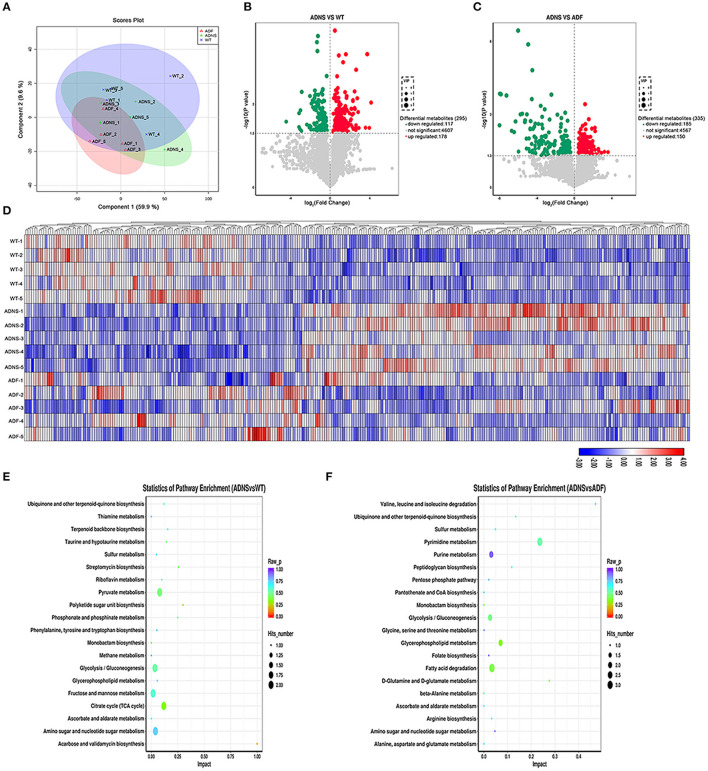
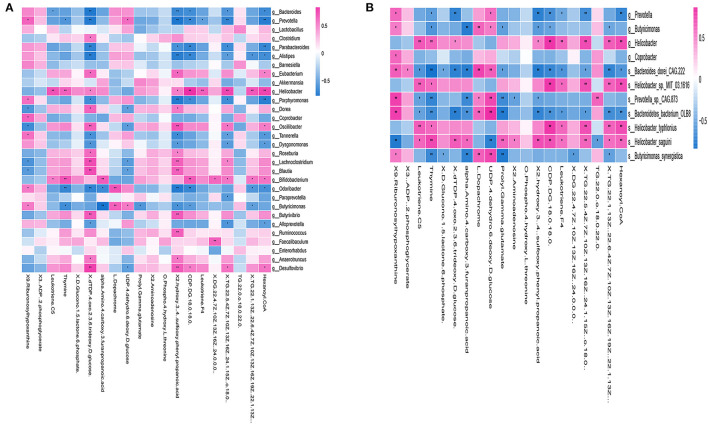
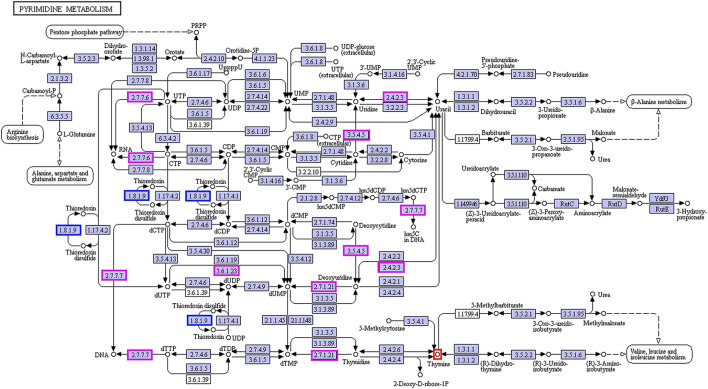
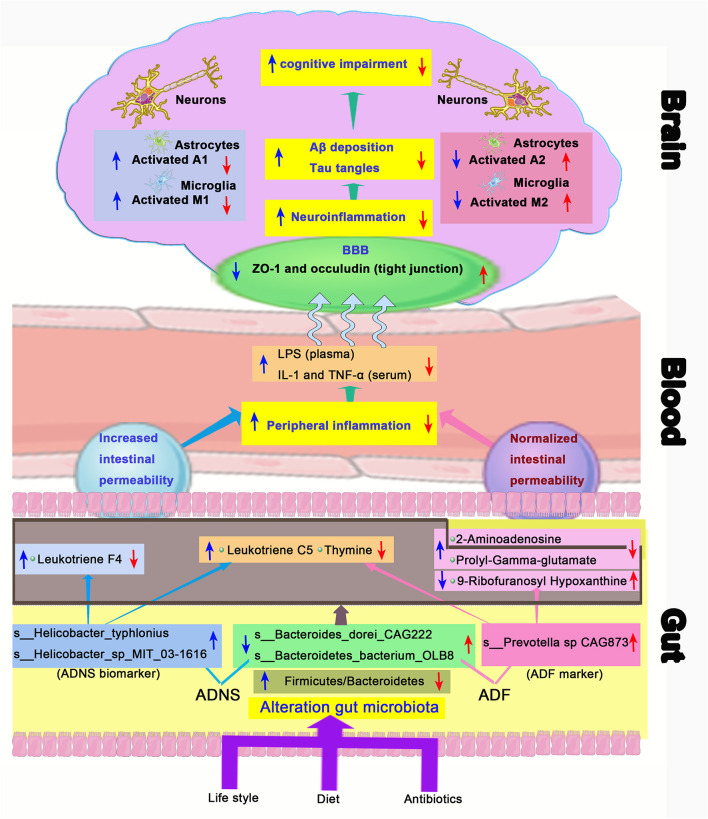
Background: Fasudil, a Rho kinase inhibitor, exerts therapeutic effects in a mouse model of Alzheimer's disease (AD), a chronic neurodegenerative disease with progressive loss of memory. However, the mechanisms remain unclear. In addition, the gut microbiota and its metabolites have been implicated in AD. Methods: We examined the effect of fasudil on learning and memory using the Morris water-maze (MWM) test in APPswe/PSEN1dE9 transgenic (APP/PS1) mice (8 months old) treated (i.p.) with fasudil (25 mg/kg/day; ADF) or saline (ADNS) and in age- and gender-matched wild-type (WT) mice. Fecal metagenomics and metabolites were performed to identify novel biomarkers of AD and elucidate the mechanisms of fasudil induced beneficial effects in AD mice. Results: The MWM test showed significant improvement of spatial memory in APP/PS1 mice treated with fasudil as compared to ADNS. The metagenomic analysis revealed the abundance of the dominant phyla in all the three groups, including Bacteroidetes (23.7-44%) and Firmicutes (6.4-26.6%), and the increased relative abundance ratio of Firmicutes/Bacteroidetes in ADNS (59.1%) compared to WT (31.7%). In contrast, the Firmicutes/Bacteroidetes ratio was decreased to the WT level in ADF (32.8%). Lefse analysis of metagenomics identified s_Prevotella_sp_CAG873 as an ADF potential biomarker, while s_Helicobacter_typhlonius and s_Helicobacter_sp_MIT_03-1616 as ADNS potential biomarkers. Metabolite analysis revealed the increment of various metabolites, including glutamate, hypoxanthine, thymine, hexanoyl-CoA, and leukotriene, which were relative to ADNS or ADF microbiota potential biomarkers and mainly involved in the metabolism of nucleotide, lipids and sugars, and the inflammatory pathway. Conclusions: Memory deficit in APP/PS1 mice was correlated with the gut microbiome and metabolite status. Fasudil reversed the abnormal gut microbiota and subsequently regulated the related metabolisms to normal in the AD mice. It is believed that fasudil can be a novel strategy for the treatment of AD via remodeling of the gut microbiota and metabolites. The novel results also provide valuable references for the use of gut microbiota and metabolites as diagnostic biomarkers and/or therapeutic targets in clinical studies of AD.

Keywords: APP/PS1 double transgenic AD mouse; Alzheimer's disease; Morris water maze; cognition; gut microbiota; metabolite; metagenomics.


Conflict of interest statement

The authors declare that the research was conducted in the absence of any commercial or financial relationships that could be construed as a potential conflict of interest.

Figures

Figure 1
Figure 1
Effects of fasudil on learning and memory of APP/PS1 mice in the Morris water maze test. (A–C) Changes in escape latency (A), latency of first entrance to the target zone (B), and the total time (%) spent in target zone (C) during the 5-d acquisition training in WT, APP/PS1 mice treated with saline (ADNS) or fasudil (ADF). (D) Representative swimming paths of WT, ADNS, and ADF mice in the probe trial. (E) The number of crossings into the border of the target zone in the probe trial. Data presented are the means ± SEM; n = 7; *p < 0.05, **p < 0.01 vs. WT; #p < 0.05, ##p < 0.01 vs. ADNS.
Figure 2
Figure 2
Senile plaques and neurofibrillary tangles in the mouse hippocampus with Bielschowsky silver-plated nerve staining. (A) Representative images of hippocampal sections from WT and APP/PS1 mice treated with saline (ADNS) or fasudil (ADF). The neurofibrillary tangles (red arrow) were densely distributed in ADNS, but not in WT and only sparsely observed in ADF. (B) Magnification of the representative images (squared areas) of the hippocampal sections from WT, ADNS, and ADF mice. A large number of senile plaques (black arrow) and neurofibrillary tangles (blue arrow) were visible in ADNS, but not in WT and only occasionally in ADF. Scale = 200 μm (A) or 50 μm (B).
Figure 3
Figure 3
Microflora alteration in WT and APP/PS1 mice treated with fasudil. (A) Comparison of microbiota based on species composition by principal component analysis (PCA) in WT (red triangles) and APP/PS1 mice treated with saline (ADNS, purple circles) or fasudil (ADF, blue squares). The colored ellipses indicate 0.95 confidence interval (CI) ranges within each tested group. The scale of the horizontal and vertical axes refers to a relative distance. PC1 and PC2 represent the suspected influencing factors for the deviation of the species composition of samples. The closer the distance between the two points represents the smaller the difference of species abundance composition between the two samples. The data indicate ADF is closer to WT than ADNS. (B) The dominant representation in phyla. WT, ADNS, and ADF were colored at the phylum level on a stream graph. Bacteroides (green) and Firmicutes (purple) were the two most abundant bacteria at the phylum level. (C,D) The two most abundant phyla of Bacteroidetes and Firmicutes. The columns indicate the abundance of Bacteroidetes (green) and Firmicutes (purple) (C). The ratio of Firmicutes/Bacteroidetes was increased in ADNS compared to WT, which was reversed in ADF (D), indicating an alteration in the types of bacteria. (E) The dominant levels of bacterium families in WT, ADNS, and ADF mice, which were colored on a stream graph. The order of relative abundance is: Bacteroidaceae > Prevotellaceae > Lachnospiraceae > Lactobacteriaceae; n = 5.
Figure 4
Figure 4
Comparison of bacterial species in WT, ADNS and ADF mice. Each box plot represents the median, interquartile range, minimum, and maximum values for the relative abundance of individual species. Species with less abundant in ADNS compared to WT (p < 0.05), which was reversed in ADF, included (upper): s_Bacteroides_dorei_CAG222 (p < 0.05), s_Bacteroidetes_bacterium_OLB8 (p < 0.05) (both in orange), s_Prevotella_sp_CAG1031 (p < 0.05), and s_Prevotella_sp_CAG873 (p < 0.01) (both in blue). Species with less abundant in ADNS compared to WT, which was not significantly blocked in ADF, included (middle): s_Alistipes_finegoldii (p < 0.01), s_Alistipes_sp_CAG53 (p < 0.05), s_Alistipes_sp_CAG435 (p < 0.05) (all in purple), and s_Butyricimonas_synergistica (p < 0.01; in green). Species with more abundant in ADNS compared to WT (p < 0.05), which was significantly blocked in ADF, included (lower left) s_Helicobacter_saguini (p < 0.05; in pink); species with increased abundance in ADNS relative to WT (p < 0.05), which was not significantly attenuated in ADF, included (lower middle and right) g_Helicobacter (s_Helicobacter_typhlonius and s_Helicobacter_sp_MIT_03-1616); n = 5. *p < 0.05, **p < 0.01 vs. WT; #p < 0.05, ##p < 0.01 vs. ADNS.
Figure 5
Figure 5
Linear discriminant analysis (LDA) effect size (LEfSe) analysis of microbiota in ADF (negative score) relative to ADNS (positive score). The LDA scores (log10) > ±3 were more abundant at the species level in ADNS compared to WT. s_Prevotella_sp_CAG873 was identified as a potential biomarker in response to fasudil treatment in APP/PS1 mice (ADF), while s_Helicobacter_typhlonius and s__Helicobacter_sp_MIT_03-1616 were identified as potential biomarkers in APP/PS1 mice (ADNS); n = 5.
Figure 6
Figure 6
Intestinal metabolite alteration of APP/PS1 mice treated with fasudil. (A) The PLS-DA score plots of metabolic profiles in WT (blue) and APP/PS1 mice treated with saline (ADNS, in green), or fasudil (ADF, in red). The separation trend of metabolic changes was observed in ADNS, WT and ADF; all samples were analyzed with 95% confidence interval (CI). (B,C) Volcano diagram of the changes in metabolites in WT, ADNS, and ADF mice. There were 295 metabolites differentially expressed in ADNS vs WT (B), including 117 metabolites significantly downregulated (green) and 178 metabolites significantly upregulated (red) (metabolites with non-significant differences are shown in gray). In addition, there were 335 metabolites differentially expressed in ADF vs. ADNS (C), including 185 downregulated metabolites and 150 upregulated metabolites. Each point in the volcano diagram represents a single metabolite. The scatter color represents the final screening result. (D) The heat map by the Hierarchical Clustering Analysis for different comparison combinations with significant changes. ADNS (middle 1–5) was presented in a different color pattern relative to WT (upper 1–5), which was similar to ADF (lower 1–5). (E,F) Analysis of the top 20 metabolic pathways in comparison combinations according to the impact factors (bubble plot). The results of the metabolic pathway analysis were presented as bubble plots. The bubble color represents the p value of the enrichment analysis, while the size of the point represents the number of different metabolites enriched in the pathway. Compared to WT, ADNS was focus on the metabolisms of pyruvate, glycolysis/gluconeogenesis, fructose, mannose, citrate cycle (TCA cycle), amino sugar, and nucleotide sugar; compared to ADNS, ADF was focused on the metabolisms of pyrimidine, purine, glycolysis/gluconeogenesis, glycerophospholipid, and fatty acid degradation; n = 5.
Figure 7
Figure 7
Correlation between gut microbiotas and metabolites. (A) Correlation analysis at the genus level of the 30 most abundant gut microbiotas and 20 different metabolites. Some microbiotas were correlated with specific metabolites, including g_Clostridium, which showed a positive correlation with dTDP-4-oxo-2,3,6-trideoxy-d-glucose (p < 0.05), and g_Faecalibaculum, which had a positive correlation with DG (22:4(7Z,10Z,13Z,16Z) (p < 0.01). (B) The heat map of the most abundant species and 20 different metabolites. The correlation analysis revealed that both of s_Bacteroides_dorei_CAG222 and s_Bacteroidetes_bacterium_OLB8 were correlated with 14 different metabolites, including 9-ribofuranosyl hypoxanthine, leukotriene C5, thymine, dTDP-4-oxo-2,3,6-trideoxy-D-glucose, alpha-amino-4-carboxy-3-furanpropanoic acid, L-dopachrome, UDP-4-dehydro-6-deoxy-D-glucose, prolyl-gamma-glutamate, 2-hydroxy-3-[4-(sulfooxy)phenyl]propanoic acid, CDP-DG(18:0/18:0), leukotriene F4, TG(22:5(4Z,7Z,10Z,13Z,16Z), TG(22:1(13Z)/22:6(4Z,7Z,10Z,13Z,16Z,19Z), and hexanoyl-CoA, all of which were widely related to a variety of metabolisms, such as carbohydrate metabolism and fatty acid metabolism. *p < 0.05, **p < 0.01; positive correlation is indicated in red and negative correlation is in blue; n = 5.
Figure 8
Figure 8
Correlation between thymine and the biomarkers for ADF and ADNS. The enzyme EC:1.8.1.9 (in blue rectangles) encoded by the gene trxB was correlated with the ADNS biomarker (s_Helicobacter_sp_MIT_03-1616), while the enzymes EC:2.7.7.6, EC:3.5.4.5, EC:2.7.1.21, EC:2.7.7.7, EC:3.6.1.23, and EC:2.4.2.3 (in pink rectangles) were encoded by the genes rpoC, cdd/CDA, tdk/TK, holA /DPO3D1, dut/DUT, udp/UPP, respectively; they were correlated with in the ADF biomarker (s-Prevotella sp CAG873) (also see Table 1 for the genes), n = 5. EC:1.8.1.9, thioredoxin-disulfide reductase; EC:2.7.7.6, DNA-directed RNA polymerase; EC:3.5.4.5, cytidine deaminase; EC:2.7.1.21, thymidine kinase; EC:2.7.7.7, DNA-directed DNA polymerase; EC:3.6.1.23, dUTP diphosphatase; EC:2.4.2.3: uridine phosphorylase; trxB, thioredoxin reductase gene; rpoC, RNA polymerase subunit C gene; cdd, cytidine deaminase gene; tdk, the thymidine kinase gene; holA, holA gene encoded one subunit of DNA polymerase III holoenzyme; dut, dUTPase (DUT) gene; udp, uridine diphosphate gene.
Figure 9
Figure 9
Schematic diagram of the gut-brain axis in AD treated with or without fasudil. Changes in the gut microbiota in the mouse model of AD (ADNS) cause abnormal production of metabolites, which aggravate peripheral inflammation, leading to increases in the brain infiltration of immune cells. Microglia M1 and astrocytes A1 cells are then activated in the brain, resulting in Aβ deposition, tau phosphorylation, and cognitive impairment. Treatment with fasudil (ADF) reconditions the gut microbiota, normalizes disordered metabolites, reduces the peripheral immune cell infiltration to the brain, ameliorates neuroinflammation, and lowers the accumulation of Aβ deposition and pTau, leading to ultimate improvement of cognitive functions. Blue arrows represent ADNS-related changes, while the red arrows refer to ADF-related changes. BBB, blood brain barrier; LPS, lipopolysaccharide; IL-1, interleukin-1; TNF-α, tumor necrosis factor -α; ZO-1, zonula occluden-1.

Similar articles

Cited by

References

    1. Alonso-Andres P., Albasanz J. L., Ferrer I., Martin M. (2018). Purine-related metabolites and their converting enzymes are altered in frontal, parietal and temporal cortex at early stages of Alzheimer's disease pathology. Brain Pathol. 28, 933–946. 10.1111/bpa.12592 - DOI - PMC - PubMed
    1. An Y., Varma V. R., Varma S., Casanova R., Dammer E., Pletnikova O., et al. . (2018). Evidence for brain glucose dysregulation in Alzheimer's disease. Alzheimers Dement. 14, 318–329. 10.1016/j.jalz.2017.09.011 - DOI - PMC - PubMed
    1. Anand S., Mande S. S. (2018). Diet, microbiota and gut-lung connection. Front. Microbiol. 9:2147. 10.3389/fmicb.2018.02147 - DOI - PMC - PubMed
    1. Beydoun M. A., Beydoun H. A., Weiss J., Hossain S., El-Hajj Z. W., Zonderman A. B. (2020). Helicobacter pylori, periodontal pathogens, and their interactive association with incident all-cause and Alzheimer's disease dementia in a large national survey. Mol Psychiatry 10.1038/s41380-020-0736-2. [Epub ahead of print]. - DOI - PubMed
    1. Blennow K., Zetterberg H. (2018). Biomarkers for Alzheimer's disease, current status and prospects for the future. J. Intern. Med. 284, 643–663. 10.1111/joim.12816 - DOI - PubMed