. 2021 Oct 14:12:716434.
doi: 10.3389/fphys.2021.716434. eCollection 2021.

The Use of Artificial Neural Networks to Forecast the Behavior of Agent-Based Models of Pathophysiology: An Example Utilizing an Agent-Based Model of Sepsis

Affiliations

The Use of Artificial Neural Networks to Forecast the Behavior of Agent-Based Models of Pathophysiology: An Example Utilizing an Agent-Based Model of Sepsis

Dale Larie et al. Front Physiol. .

Abstract

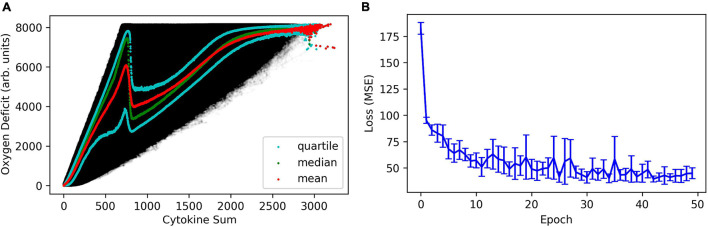
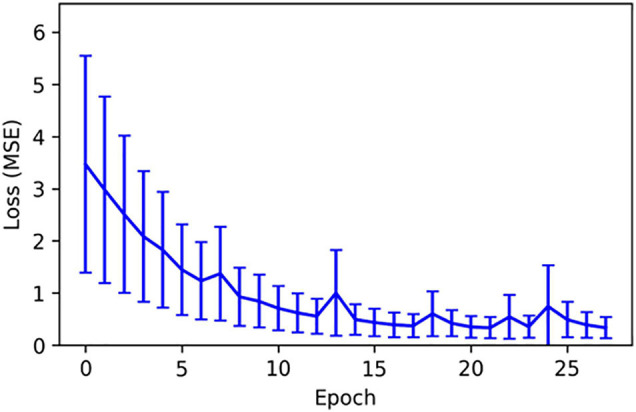
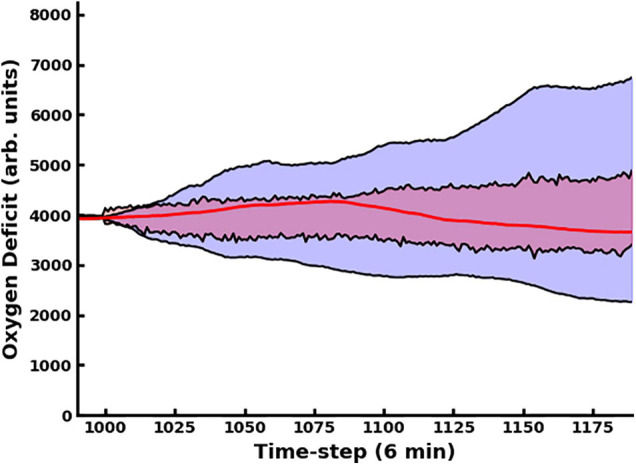
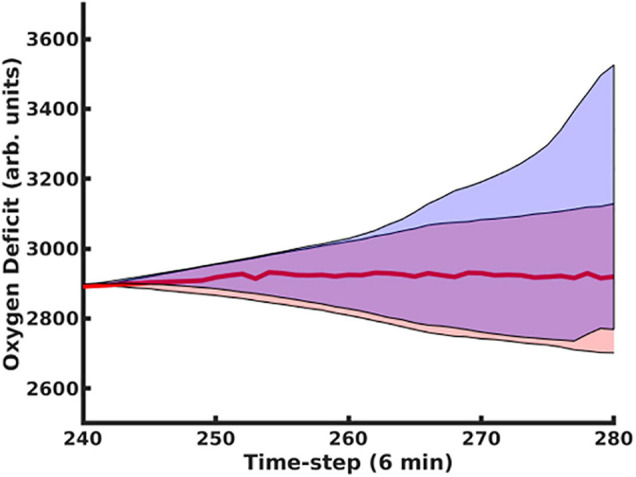
Introduction: Disease states are being characterized at finer and finer levels of resolution via biomarker or gene expression profiles, while at the same time. Machine learning (ML) is increasingly used to analyze and potentially classify or predict the behavior of biological systems based on such characterization. As ML applications are extremely data-intensive, given the relative sparsity of biomedical data sets ML training of artificial neural networks (ANNs) often require the use of synthetic training data. Agent-based models (ABMs) that incorporate known biological mechanisms and their associated stochastic properties are a potential means of generating synthetic data. Herein we present an example of ML used to train an artificial neural network (ANN) as a surrogate system used to predict the time evolution of an ABM focusing on the clinical condition of sepsis. Methods: The disease trajectories for clinical sepsis, in terms of temporal cytokine and phenotypic dynamics, can be interpreted as a random dynamical system. The Innate Immune Response Agent-based Model (IIRABM) is a well-established model that utilizes known cellular and molecular rules to simulate disease trajectories corresponding to clinical sepsis. We have utilized two distinct neural network architectures, Long Short-Term Memory and Multi-Layer Perceptron, to take a time sequence of five measurements of eleven IIRABM simulated serum cytokine concentrations as input and to return both the future cytokine trajectories as well as an aggregate metric representing the patient's state of health. Results: The ANNs predicted model trajectories with the expected amount of error, due to stochasticity in the simulation, and recognizing that the mapping from a specific cytokine profile to a state-of-health is not unique. The Multi-Layer Perceptron neural network, generated predictions with a more accurate forecasted trajectory cone. Discussion: This work serves as a proof-of-concept for the use of ANNs to predict disease progression in sepsis as represented by an ABM. The findings demonstrate that multicellular systems with intrinsic stochasticity can be approximated with an ANN, but that forecasting a specific trajectory of the system requires sequential updating of the system state to provide a rolling forecast horizon.

Keywords: agent-based model (ABM); machine learning; neural networks; sepsis; time series.


Conflict of interest statement

The authors declare that the research was conducted in the absence of any commercial or financial relationships that could be construed as a potential conflict of interest.

Figures

FIGURE 1
FIGURE 1
In panel (A), we present the variance in oxygen deficit as a function of the sum of cytokine concentrations in the whole area of simulated tissue, effectively compressing an 11-dimensinal vector into a scalar quantity indicative of total biological activity (e.g., cells performing functions) in the simulated tissue. In panel (B), we show the mean absolute error in the regression of the oxygen deficit as a function of cytokine profile, as a function of training epoch.
FIGURE 2
FIGURE 2
The mean squared error (in arbitrary units) as a function of training epoch for TNFα. The training of this cytokine prediction network was representative of all simulated cytokine prediction networks.
FIGURE 3
FIGURE 3
In this figure, we compare the dual-network predictor, which uses an MLP to predict the 11-dimensional cytokine profile trajectory and then another MLP to regress the oxygen deficit value (shaded in red), with an MLP which is informed solely by prior values for the oxygen deficit (shaded in blue).
FIGURE 4
FIGURE 4
Here we present trajectory clouds for the MLP and LSTM-generated predictions. In both cases, 11-dimensional cytokine trajectories were predicted. The predicted values were then fed into the MLP regressor network, which regressed the future predicted oxygen deficit as a function of the predicted cytokine profile trajectories. The future health-trajectory probability cloud predicted using the MLP network is shaded in red; the future health-trajectory probability cloud predicted using the LSTM network is shaded in blue; the true trajectory is plotted in red.
FIGURE 5
FIGURE 5
Using the MLP Trajectory Forecast Model combined with the MLP Oxygen-Deficit Regressor, we determined the upper and lower boundaries for the future health-trajectory probability cone, which are indicated by the blue lines; the actual trajectory is plotted with a red line. Predictions began at t = 200 and were update upon every time-step.
FIGURE 6
FIGURE 6
In this figure, we compare predictions generated using the MLP Cytokine Trajectory Prediction/MLP Oxygen-Deficit Regressor with a set of stochastic replicates generated by the simulation. In panel (A), we contrast the future health-trajectory probability cones with networks that used data collected in the first 24 h (shaded in red) and networks that excluded the first-day data (shaded in blue); we note that the blue area appears purple as it is entirely contained within the red area. In panel (B), we present 100 stochastic replicates of the actual simulation health-trajectory, reseeded at the time of the first prediction (red) compared with the predicted probability cone trajectories (blue). In panel (C), we generated the simulation trajectory cone through reseeding the simulation’s random number generator at the upper and lower boundaries of the trajectory cone every 100 time steps from t = 1100 to t = 1800.

References

    1. An G. (2004). In silico experiments of existing and hypothetical cytokine-directed clinical trials using agent-based modeling. Crit. Care Med. 32 2050–2060. 10.1097/01.ccm.0000139707.13729.7d - DOI - PubMed
    1. An G. (2018). The crisis of reproducibility, the denominator problem and the scientific role of multi-scale modeling. Bull. Math. Biol. 80 3071–3080. 10.1007/s11538-018-0497-0 - DOI - PMC - PubMed
    1. An G., Fitzpatrick B. G., Christley S., Federico P., Kanarek A., Miller Neilan R., et al. (2017). Optimization and control of agent-based models in biology: a perspective. Bull. Math. Biol. 79 63–87. 10.1007/s11538-016-0225-6 - DOI - PMC - PubMed
    1. An G., Mi Q., Dutta-Moscato J., Vodovotz Y. (2009). Agent-based models in translational systems biology. Wiley Interdiscip. Rev. Syst. Biol. Med. 1 159–171. 10.1002/wsbm.45 - DOI - PMC - PubMed
    1. Angus D. C. (2011). The search for effective therapy for sepsis: back to the drawing board? JAMA 306 2614–2615. 10.1001/jama.2011.1853 - DOI - PubMed