

Comparison of 16S rRNA Gene Based Microbial Profiling Using Five Next-Generation Sequencers and Various Primers
- PMID: 34721319
- PMCID: PMC8552068
- DOI: 10.3389/fmicb.2021.715500
Comparison of 16S rRNA Gene Based Microbial Profiling Using Five Next-Generation Sequencers and Various Primers
Abstract
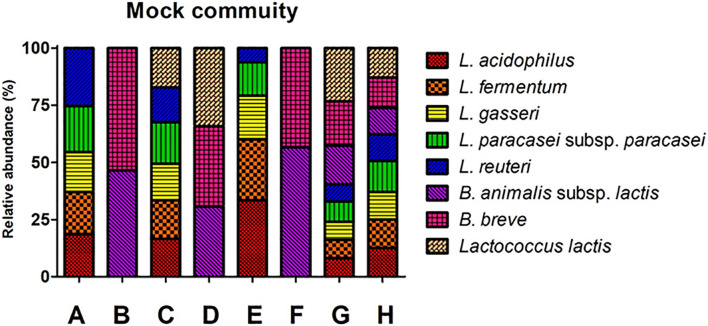
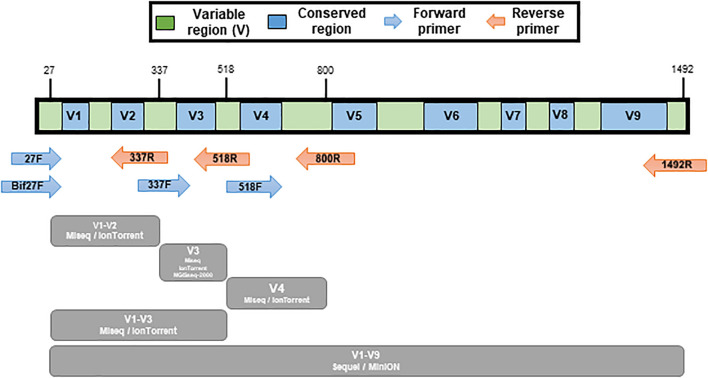
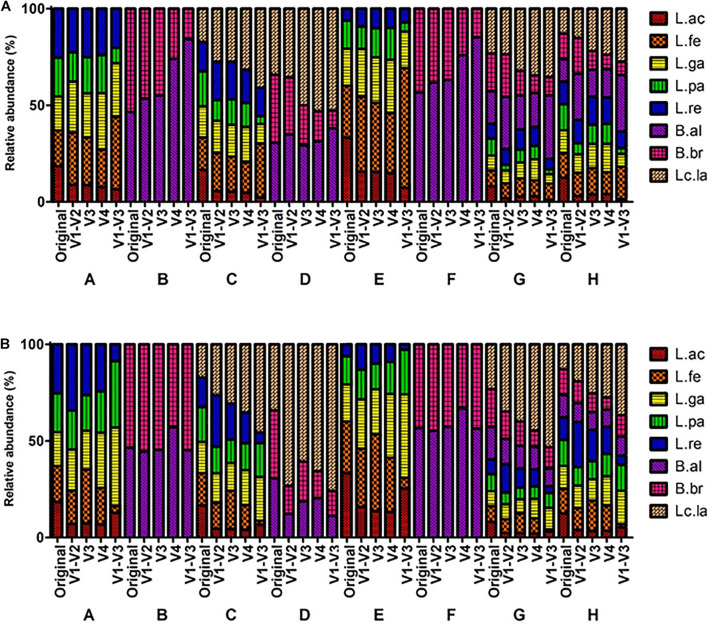
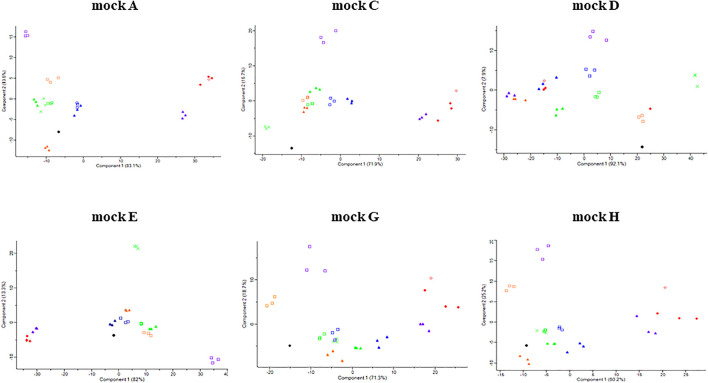
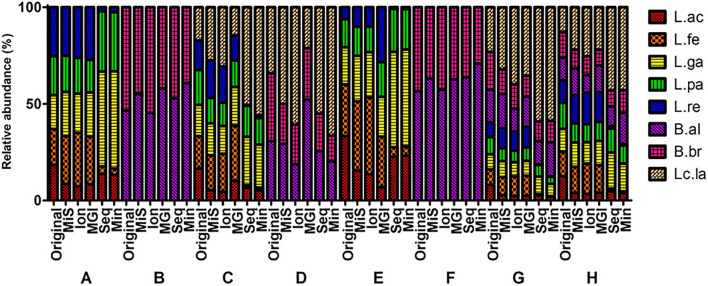
Microbial community analysis based on the 16S rRNA-gene is used to investigate both beneficial and harmful microorganisms in various fields and environments. Recently, the next-generation sequencing (NGS) technology has enabled rapid and accurate microbial community analysis. Despite these advantages of NGS based metagenomics study, sample transport, storage conditions, amplification, library preparation kits, sequencing, and bioinformatics procedures can bias microbial community analysis results. In this study, eight mock communities were pooled from genomic DNA of Lactobacillus acidophilus KCTC 3164T, Limosilactobacillus fermentum KCTC 3112T, Lactobacillus gasseri KCTC 3163T, Lacticaseibacillus paracasei subsp. paracasei KCTC 3510T, Limosilactobacillus reuteri KCTC 3594T, Lactococcus lactis subsp. lactis KCTC 3769T, Bifidobacterium animalis subsp. lactis KCTC 5854T, and Bifidobacterium breve KCTC 3220T. The genomic DNAs were quantified by droplet digital PCR (ddPCR) and were mixed as mock communities. The mock communities were amplified with various 16S rRNA gene universal primer pairs and sequenced by MiSeq, IonTorrent, MGIseq-2000, Sequel II, and MinION NGS platforms. In a comparison of primer-dependent bias, the microbial profiles of V1-V2 and V3 regions were similar to the original ratio of the mock communities, while the microbial profiles of the V1-V3 region were relatively biased. In a comparison of platform-dependent bias, the sequence read from short-read platforms (MiSeq, IonTorrent, and MGIseq-2000) showed lower bias than that of long-read platforms (Sequel II and MinION). Meanwhile, the sequences read from Sequel II and MinION platforms were relatively biased in some mock communities. In the data of all NGS platforms and regions, L. acidophilus was greatly underrepresented while Lactococcus lactis subsp. lactis was generally overrepresented. In all samples of this study, the bias index (BI) was calculated and PCA was performed for comparison. The samples with biased relative abundance showed high BI values and were separated in the PCA results. In particular, analysis of regions rich in AT and GC poses problems for genome assembly, which can lead to sequencing bias. According to this comparative analysis, the development of reference material (RM) material has been proposed to calibrate the bias in microbiome analysis.
Keywords: 16S rRNA; Bias Index (BI); Droplet Digital PCR (ddPCR); mock community; next-generation sequencing (NGS); reference material (RM).
Copyright © 2021 Park, Kim, Choi and Kim.
Conflict of interest statement
The authors declare that the research was conducted in the absence of any commercial or financial relationships that could be construed as a potential conflict of interest.
Figures
References
-
- Bio-Rad Laboratories, Inc. (2015). Rare Mutation Detection Best Practices Guidelines. Available online at: https://www.bio-rad.com/webroot/web/pdf/lsr/literature/Bulletin_6628.pdf (accessed September 27, 2021).
-
- Boers S. A., Jansen R., Hays J. P. (2019). Understanding and overcoming the pitfalls and biases of next-generation sequencing (NGS) methods for use in the routine clinical microbiological diagnostic laboratory. Eur. J. Clin. Microbiol. Infect. Dis. 38 1059–1070. 10.1007/s10096-019-03520-3 - DOI - PMC - PubMed
LinkOut - more resources
Full Text Sources
Other Literature Sources
Molecular Biology Databases
Miscellaneous