. 2021 Oct 14:12:702074.
doi: 10.3389/fimmu.2021.702074. eCollection 2021.

B Cell Mobilization, Dissemination, Fine Tuning of Local Antigen Specificity and Isotype Selection in Asthma

Affiliations

B Cell Mobilization, Dissemination, Fine Tuning of Local Antigen Specificity and Isotype Selection in Asthma

Line Ohm-Laursen et al. Front Immunol. .

Abstract

In order to better understand how the immune system interacts with environmental triggers to produce organ-specific disease, we here address the hypothesis that B and plasma cells are free to migrate through the mucosal surfaces of the upper and lower respiratory tracts, and that their total antibody repertoire is modified in a common respiratory tract disease, in this case atopic asthma. Using Adaptive Immune Receptor Repertoire sequencing (AIRR-seq) we have catalogued the antibody repertoires of B cell clones retrieved near contemporaneously from multiple sites in the upper and lower respiratory tract mucosa of adult volunteers with atopic asthma and non-atopic controls and traced their migration. We show that the lower and upper respiratory tracts are immunologically connected, with trafficking of B cells directionally biased from the upper to the lower respiratory tract and points of selection when migrating from the nasal mucosa and into the bronchial mucosa. The repertoires are characterized by both IgD-only B cells and others undergoing class switch recombination, with restriction of the antibody repertoire distinct in asthmatics compared with controls. We conclude that B cells and plasma cells migrate freely throughout the respiratory tract and exhibit distinct antibody repertoires in health and disease.

Keywords: IgD; adaptive immunity; allergy; asthma; immunoglobulin; innate immunity; repertoire and AIRR-seq/sequencing.


Conflict of interest statement

SHK receives consulting fees from Northrop Grumman. KBH receives consulting fees from Prellis Biologics. YJ, CC, TGJ and RH are employed by Bristol Myers Squibb. The remaining authors declare that the research was conducted in the absence of any commercial or financial relationships that could be construed as a potential conflict of interest. The handling editor has declared past collaborations with one of the authors SHK at the time of this review.

Figures

Figure 1
Figure 1
Schematic showing origins of the various samples from the nasal mucosa, the right lung bronchial mucosa and the peripheral blood. The NBV_PBMC and BBC_PBMC peripheral blood sample were collected at the same time as the nasal biopsy (NBx) and the bronchial biopsies (BBx), respectively. For AA07, three biopsies from the left lung were also collected: BBx11 (3rd generation lower lobe), BBx12 (2nd generation lower lobe) and BBx13 (1st generation lower lobe). The carina is at the bottom of the trachea where it divides into the left and right main bronchi. 4th generation lower lobe biopsies were collected from all subjects but only sequenced from NANA03 as this individual lacked a 1st generation lower lobe biopsy sample. This figure was created in BioRender.com.
Figure 2
Figure 2
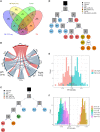
B cells can traffic between the left and the right lungs, as well as from the carina and the nose to the lower airways. (A) Venn diagram showing the numbers (and percentages) of clones that overlap in the left and the right lungs, carina and the nose from the asthmatic patient AA07. (B) Clonal relationships between all seven bronchial biopsies (BBx) and the nasal biopsy (NBx) from AA07 were calculated and plotted in a Circos plot. The lines between regions indicate a clonal relationship and the numbers around the perimeter indicate counts of overlapped clones between two biopsies. Clones that overlapped more than two biopsies could be duplicated in the Circos plot. (C, D) Examples of clonal trees for two clones from AA07 spanning both lungs (right: orange and left: red), the nose (blue) and, for the clones in (C), also the peripheral blood (green). The clone in (D) also has members from the carina (yellow). The clone in (C) has undergone isotype switching and contains both IgA and IgG sequences. The numbers along each of the branches indicate mutations. (E) Maximum parsimony phylogeography analyses show no enrichment for trafficking between the mucosa of the two lungs in either direction. (F) When the nasal clones are included, the analyses reveal enrichment for trafficking from the nasal mucosa to either lung (peach and yellow) whereas trafficking between the mucosa of the two lungs (purple and pink) shows no directional bias. There is negative enrichment for travel from either lung to the nasal mucosa (green and blue) confirming the directional preference for B cell trafficking from the nasal to the bronchial mucosa.
Figure 3
Figure 3
Greater diversity and positive immunoglobulin selection pressure in non-atopic, non-asthmatics (NANA) compared with atopic asthmatics (AA). The Shannon diversity and Simpson diversity indices of immunoglobulin sequences from biopsies from each individual show significantly less diversity in the asthmatics (green) compared with the non-atopic controls (yellow) in the bronchial (A) but not the nasal biopsies (B). Comparison of (C) pooled bronchial and nasal biopsy immunoglobulin sequences from asthmatics and non-atopic control samples (green and yellow, respectively) and (D) bronchial (red) and nasal (green) biopsy sequences from the atopic asthmatics and bronchial (blue) and nasal (purple) sequences from the non-atopic controls shows a higher degree of antigen-driven selection in the complementarity determining regions (CDRs) of the antibodies in the non-atopic controls compared with the atopic asthmatics. Statistically significant differences between the subject groups were found in the framework regions (FWR) when bronchial and nasal biopsy samples were combined (C) but not for individual sample types (D).
Figure 4
Figure 4
Analysis of isotype frequencies, levels of somatic hypermutation (SHM) and IGHV-gene usage of Ig clones from the bronchial (BBx) and nasal mucosal biopsies (NBx) and peripheral blood mononuclear cells of the atopic asthmatics and non-atopic, controls. (A) Isotype frequencies in samples were calculated as fractions of the total sequences expressing a given isotype. Each dot represents an individual. (B) SHM frequencies were calculated for each sequence, then means calculated for all the clones of a given isotype and then for each isotype in each tissue type for each individual. Each dot represents an individual. (C) Heatmap showing the IGHV-gene usage frequencies in the bronchial and nasal mucosal biopsies from each individual.
Figure 5
Figure 5
High frequency of immunoglobulin gene clones spanning nasal and bronchial mucosa and evidence of enrichment of trafficking from the nose to the lungs. (A) Overlap heatmap showing the numbers and frequencies of sequences (below the diagonal) and clones (above the diagonal) shared between all pairs of samples from subject AA02. Numbers immediately above and below the diagonal indicate the number of sequences and clones in each sample, respectively. There is a high degree of overlap of clones in the nasal biopsy (NBx1) and all the bronchial biopsies (BBx) (38-61% at clonal level) and between individual bronchial biopsies (24-28% at clonal level). Some overlap of clones is also seen in the two blood samples taken at the same times as the nasal and bronchial biopsies (6% at clonal level) as well as between both samples and the nasal biopsy (6% and 9%, respectively) and bronchial biopsy samples (6-9% for the NBV_PBMC taken at the time of the nasal biopsy and 12-19% for BBV_PBMC taken at the time of the bronchoscopy). A lower degree of overlap is found at sequence level, as this requires 100% nucleotide sequence identity. (B) Lineage tree analysis by maximum parsimony phylogeography showing an enrichment of switches along B cell lineage trees from nasal to bronchial mucosa compared to randomized trees. The enrichment is significantly more pronounced in the atopic asthmatics (AA, green, p<0.02 for all subjects) compared to the non-atopic controls (NANA, yellow, p<0.05 in 4 of 9 subjects). (C) Example of a phylogenetic tree from subject AA06 showing a clear pattern of trafficking from the nose (N, blue) to the lungs (bronchial biopsies B3, B5 and B9, red). N is an abbreviation for nasal biopsy (NBx) and B3, B5 and B9 abbreviations of bronchial biopsies BBx3, BBx5 and BBx9. All the members of this particular clone are of the IgA isotype.
Figure 6
Figure 6
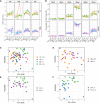
B cells of all isotypes are able to traffic from the nasal to the bronchial mucosa. Global clones are defined as those that contain both nasal and bronchial sequences. We divided the sequences into non-global nasal sequences (NBx_NG) – sequences from clones found in the nasal but not in the bronchial mucosa, global nasal sequences (NBx_G) – the nasal mucosal sequences from global clones, global bronchial sequences (BBx_G) – the bronchial sequences from global clones and non-global bronchial sequences (BBx_NG) – sequences from clones found only in the bronchial mucosa. (A) The percentages of the total number of sequences belonging to each isotype (IgD = orange, IgM = purple, IgG = green and IgA = blue) were plotted for each of the four sequence groups for atopic asthmatics (AA) or non-atopic, non-asthmatic controls (NANA). The percentages were calculated for each subject first and then averaged for the asthmatics and non-atopic controls separately. (B) Linked changes in the percentage of each isotype from NBx_NG to NBx_G to BBx-G and BBx_NG were plotted for each individual (each line represents an individual, colored the same way as panel (D). (C) For each global clone, corresponding to a data point in the plot, the percentages of sequences of a given isotype within the clone found in the nasal mucosa (y-axis) were plotted against the percentages of sequences from the bronchial mucosa (x-axis). (D) The mutation frequencies were plotted as the mean of the mutation frequency for sequences of a given isotype for each individual (each line represents an individual, colored the same way as panel (B). (E) Left: mean clone size for a given cell subset in each subject for non-global and global clones from either the nasal or bronchial mucosa. Right: mean numbers of isotypes in a clone (right). Each point represents an individual.
Figure 7
Figure 7
Global clones have longer CDR3 regions with distinct amino acid properties. Sequences from the nasal and bronchial mucosa were divided into groups as described in Figure 6 . (A) The mean lengths (in amino acids) of the CDR3 region of sequences belonging to each group were calculated for each individual (each line represents an individual, colored the same way as panel (B) and Figure 6 ). (B) The IGHJ-gene usage in sequences of the four sample types was plotted for atopic asthmatics (AA) and non-atopic, non-asthmatic controls (NANA) separately for each individual (each line represents an individual, colored the same way as panel (A) and Figure 6 ). Eight different properties of the CDR3 amino acids were calculated (see Supplementary Figure 7 ) and summarized in PCA plots. Each unique sequence was included with the weight of one. The PCA plots were for (C) the four sequence subsets together (non-global nasal sequences (orange), global nasal sequences (purple), global bronchial sequences (green) and non-global bronchial sequences (blue), (D) non-global (orange) versus global (purple) nasal sequences, (E) global nasal (purple) versus bronchial (green) sequences and (F) global (green) versus non-global (blue) bronchial sequences.
Figure 8
Figure 8
Highly mutated IgD-only sequences with a long CDR3 region and a bias towards IGHJ6 are found in both the bronchial and nasal tissue. (A) IgD-only sequences are more commonly found in the bronchial mucosa (BBx) of atopic asthmatics (AA) compared to non-atopic controls (NANA). Lower frequencies of IgD-only sequences are seen in the nasal mucosa (NBx) of both subject groups. NANA03, 07 and 12 have been excluded from this and all subsequent analyses involving the IgD-only cell subset as they have too few IgD-only sequences (< 20 IgD-only sequences). (B) IgD-only sequences have a high rate of somatic hypermutation in both atopic asthmatics and non-atopic controls and both bronchial and nasal mucosa. No significant differences were found between groups. (C) The CDR3 lengths (given as the numbers of amino acids) of sequences belonging to each sequence type (IgD-only, IgM, IgG and IgA). Each dot represents the sequences from one individual. The IgD-only CDR3s were significantly longer than those from IgM sequences (p=0.05) except in bronchial biopsies from asthmatics which showed only a trend (p=0.067) but not compared to other isotypes (p>0.05 for all other comparisons). No significant differences were found between atopic asthmatics and non-atopic controls. (D) IGHJ6 is over-used in IgD-only sequences in both bronchial and nasal tissue (p<0.05 for all comparisons). Each dot represents an individual and the line is the mean for the group. (E) Sequences where divided into those using IGHJ6 or other IGHJ genes (Non_IGHJ6), which shows that the significantly longer CDR3 regions of IgD-only sequences compared to IgM sequences are found even in sequences using other IGHJ genes (blue) (p<0.05 in both the nasal and bronchial mucosa of atopic asthmatics). Each dot represents an individual and the line is the mean for the group.
Figure 9
Figure 9
The antigenic selection pressure exerted on IgD-only cell varies between tissues and sample types. (A, B) BASELINe estimation of the posterior distribution of selection strengths (∑) for the complementarity determining regions (CDR) and framework regions (FWR) of IgD-only sequences (light green for atopic asthmatics (AA) and yellow for non-atopic, non-asthmatic controls (NANA)] and those of other switched isotypes: IgA (light blue AA, violet NANA) and IgG (dark blue AA, maroon NANA) and IgM sequences (dark green AA, pink NANA) in (A) the bronchial mucosal and (B) the nasal mucosa samples. IgD-only sequences display significantly more negative selection strength in the CDRs compared to switched isotypes and IgM in both the bronchial and nasal mucosa. The IgD-only bronchial mucosa also showed a statistically significant difference between atopic asthmatics and non-atopic controls with asthmatics displaying the lowest pressure in the CDRs of all sample types tested. (C) Position weight matrix (pwm) analyses of somatic hypermutation generated amino acid substitutions selected for in IgD-only sequences (over the axis) and against (below the axis) in the IGHV3-30 gene in the bronchial (top panel) and nasal (bottom panel) mucosa of atopic asthmatics. The red areas indicate CDR1 and 2 and the white areas are the FWRs. The letters denote the one letter amino acid codes and the colors show the properties of the amino acids selected for or against with red = acidic, blue = basic, black = hydrophobic, purple = neutral and green = polar. The size of the letters shows the strength of selective pressure in the given position. Dots indicate significant differences between IgD-only and the other sequences.

References

    1. Richmond I, Pritchard GE, Ashcroft T, Avery A, Corris PA, Walters EH. Bronchus Associated Lymphoid Tissue (BALT) in Human Lung: Its Distribution in Smokers and non-Smokers. Thorax (1993) 48(11):1130–4. doi: 10.1136/thx.48.11.1130 - DOI - PMC - PubMed
    1. Hwang JY, Randall TD, Silva-Sanchez A. Inducible Bronchus-Associated Lymphoid Tissue: Taming Inflammation in the Lung. Front Immunol (2016) 7:258. doi: 10.3389/fimmu.2016.00258 - DOI - PMC - PubMed
    1. Elliot JG, Jensen CM, Mutavdzic S, Lamb JP, Carroll NG, James AL. Aggregations of Lymphoid Cells in the Airways of Nonsmokers, Smokers, and Subjects With Asthma. Am J Respir Crit Care Med (2004) 169(6):712–8. doi: 10.1164/rccm.200308-1167OC - DOI - PubMed
    1. Randall TD, Mebius RE. The Development and Function of Mucosal Lymphoid Tissues: A Balancing Act With Micro-Organisms. Mucosal Immunol (2014) 7(3):455–66. doi: 10.1038/mi.2014.11 - DOI - PubMed
    1. Takhar P, Smurthwaite L, Coker HA, Fear DJ, Banfield GK, Carr VA, et al. . Allergen Drives Class Switching to IgE in the Nasal Mucosa in Allergic Rhinitis. J Immunol (2005) 174(8):5024–32. doi: 10.4049/jimmunol.174.8.5024 - DOI - PubMed

Publication types