. 2021 Oct 14:12:722581.
doi: 10.3389/fimmu.2021.722581. eCollection 2021.

Cholesterol Regulates Exosome Release in Cultured Astrocytes

Affiliations

Cholesterol Regulates Exosome Release in Cultured Astrocytes

Mohammad Abdullah et al. Front Immunol. .

Abstract

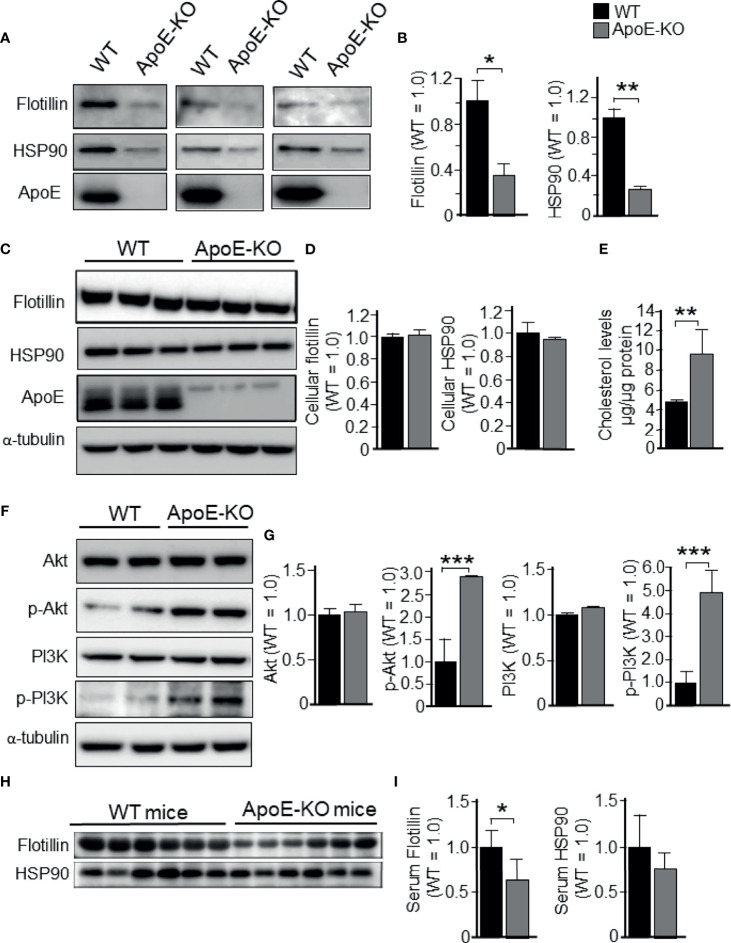
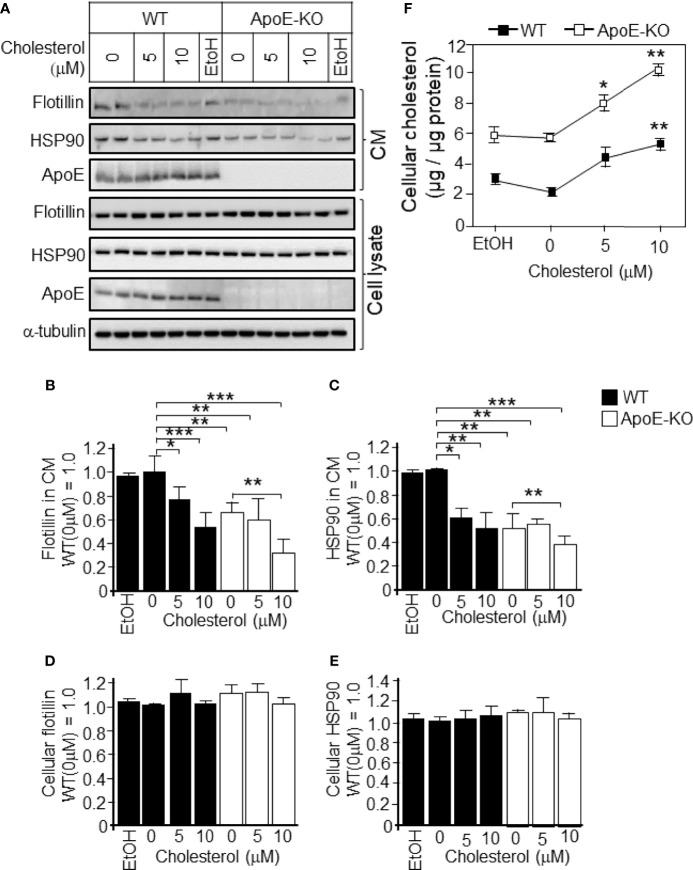
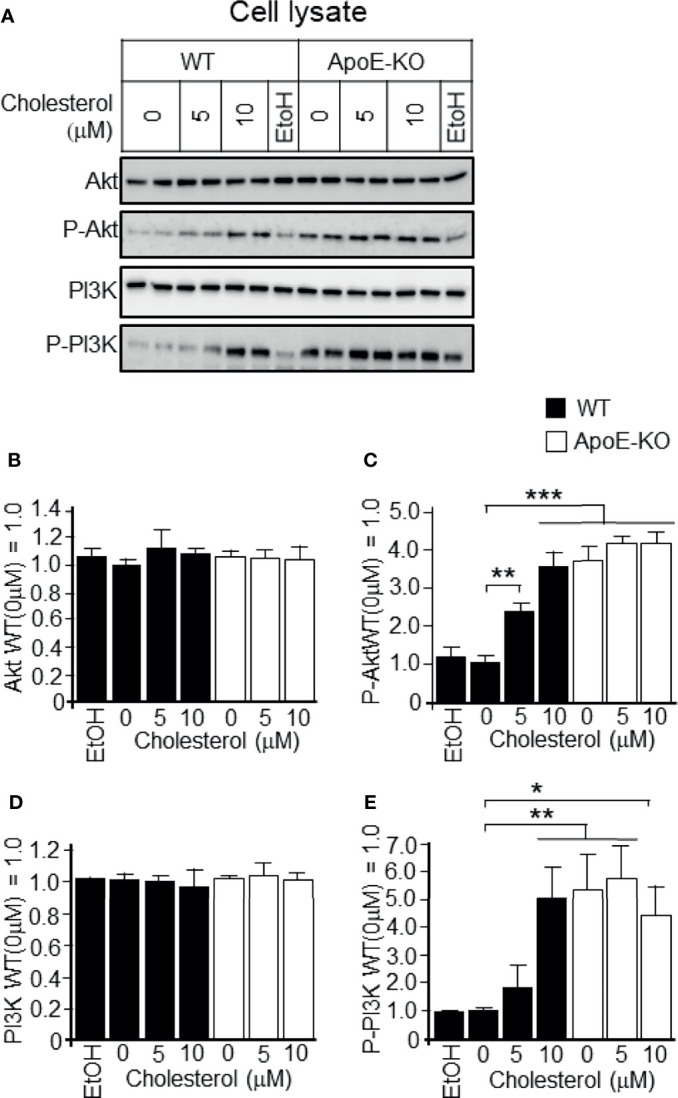
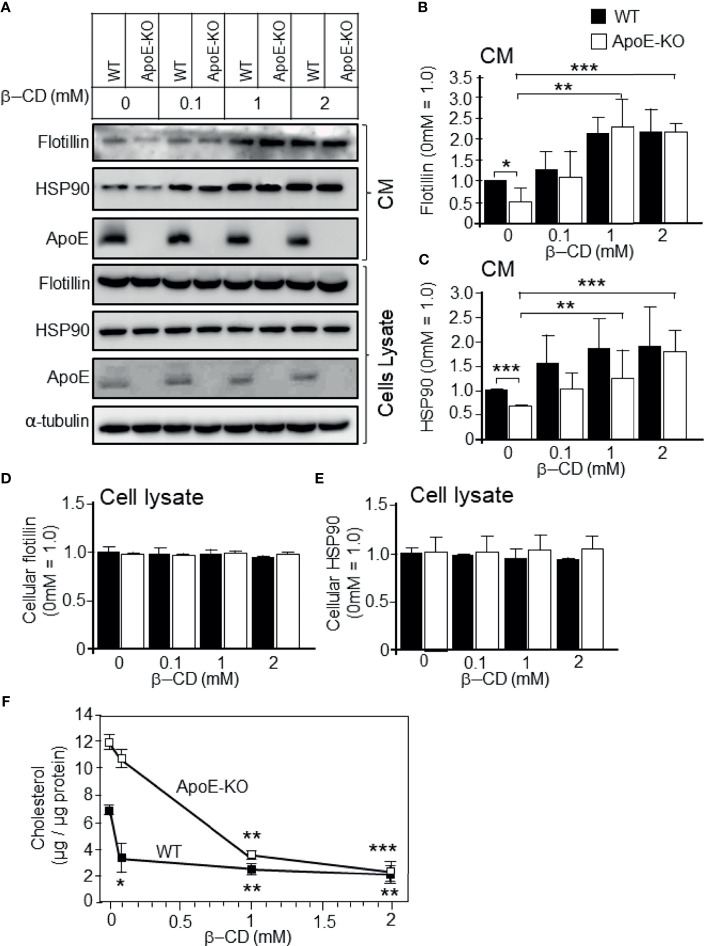
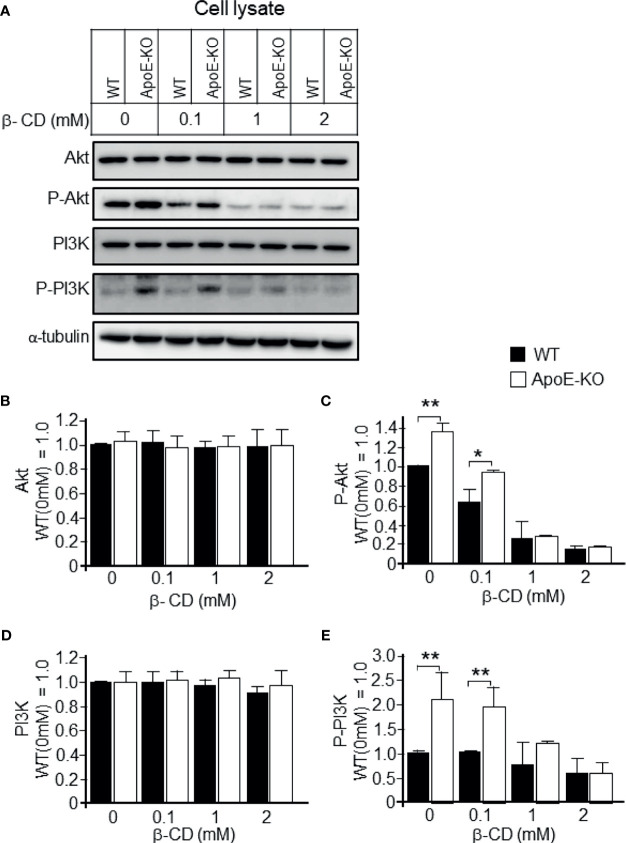
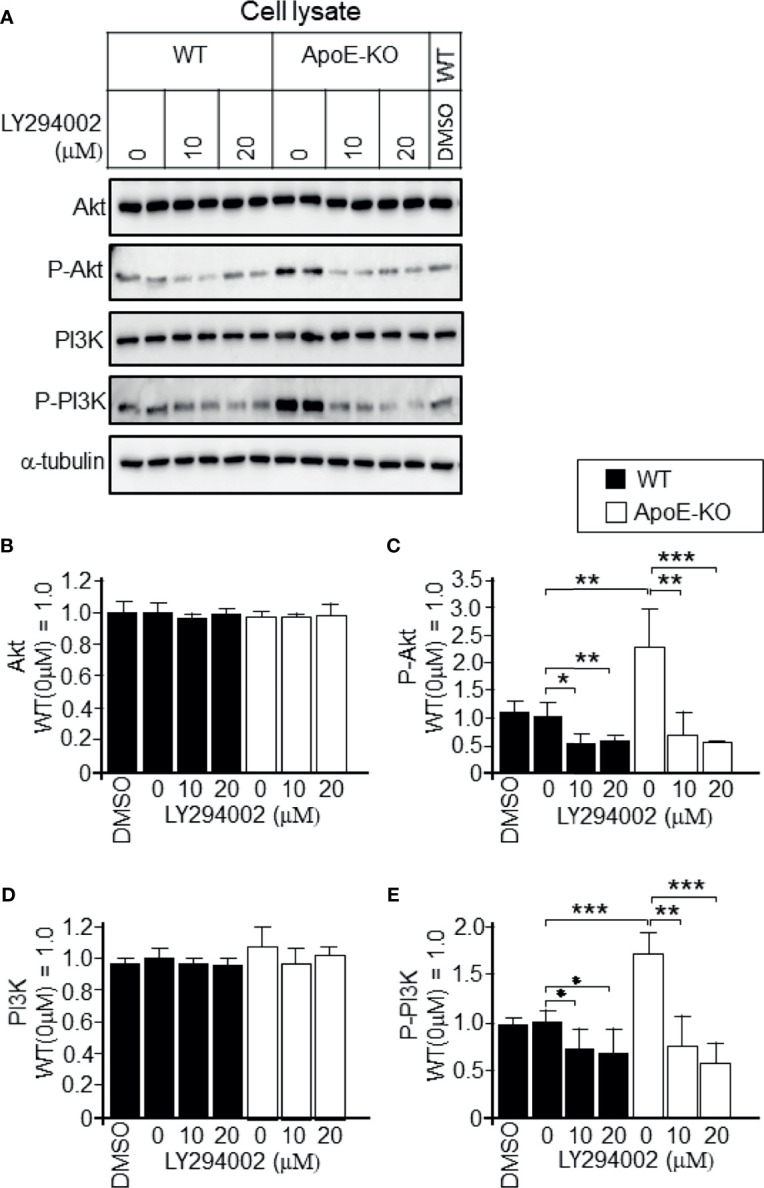
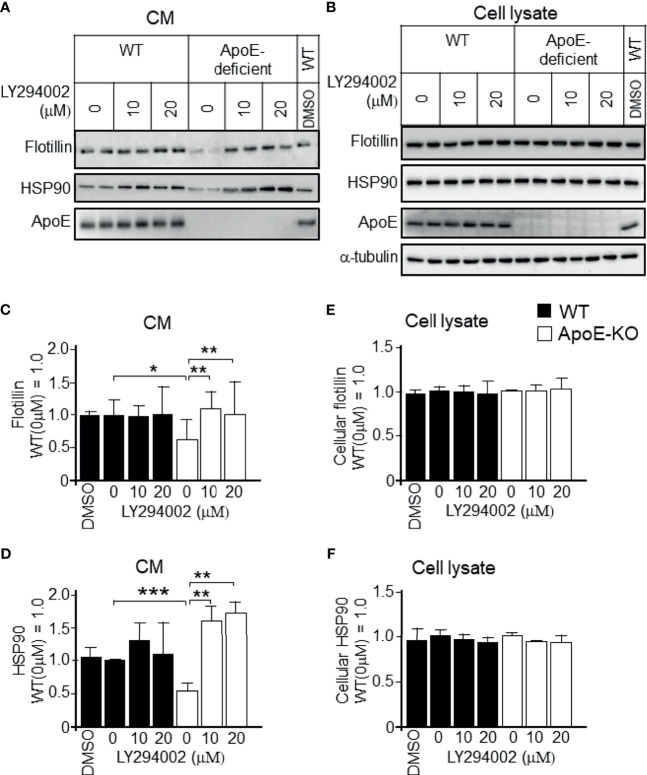
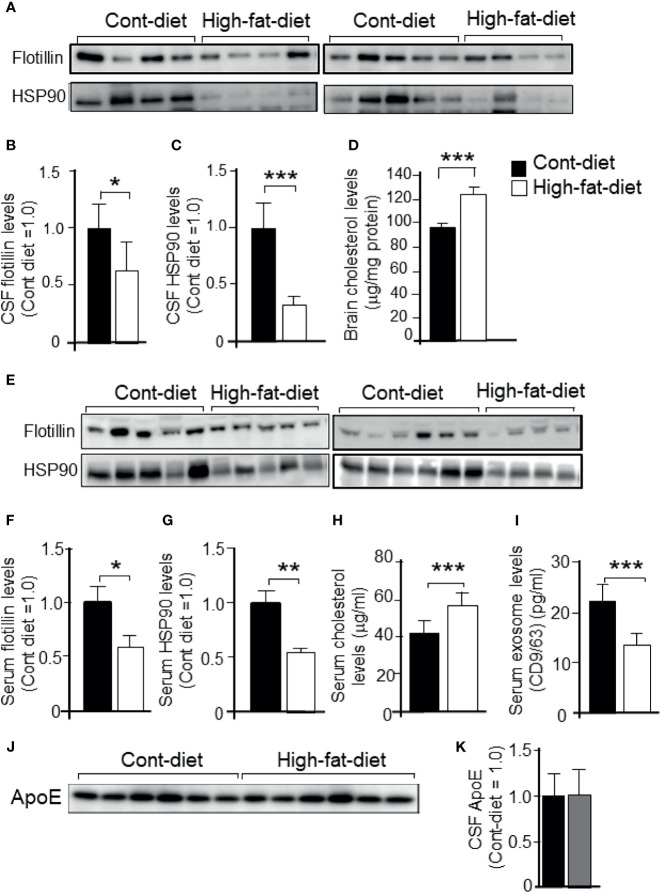
Exosomes are vesicles secreted by various kinds of cells, and they are rich in cholesterol, sphingomyelin (SM), phosphatidylcholine, and phosphatidylserine. Although cellular sphingolipid-mediated exosome release has been reported, the involvement of other lipid components of cell membranes in the regulation of exosome release is poorly understood. Here, we show that the level of exosome release into conditioned media is significantly reduced in cultured astrocytes prepared from apolipoprotein E (ApoE) knock-out mice when compared to those prepared from wild-type (WT) mice. The reduced level of exosome release was accompanied by elevated levels of cellular cholesterol. The addition of cholesterol to WT astrocytes significantly increased the cellular cholesterol levels and reduced exosome release. PI3K/Akt phosphorylation was enhanced in ApoE-deficient and cholesterol-treated WT astrocytes. In contrast, the depletion of cholesterol in ApoE-deficient astrocytes due to treatment with β-cyclodextrin recovered the exosome release level to a level similar to that in WT astrocytes. In addition, the reduced levels of exosome release due to the addition of cholesterol recovered to the control levels after treatment with a PI3K inhibitor (LY294002). The cholesterol-dependent regulation of exosome release was also confirmed by in vivo experiments; that is, exosome levels were significantly reduced in the CSF and blood serum of WT mice that were fed a high-fat diet and had increased cholesterol levels when compared to those in WT mice that were fed a normal diet. These results suggest that exosome release is regulated by cellular cholesterol via stimulation of the PI3K/Akt signal pathway.

Keywords: Akt; PI3K; apolipoprotein E; astrocytes; cholesterol; exosome.


Conflict of interest statement

The authors declare that the research was conducted in the absence of any commercial or financial relationships that could be construed as a potential conflict of interest.

Figures

Figure 1
Figure 1
Levels of exosome release in cultured astrocytes prepared from WT and ApoE-KO mouse brain. Astrocyte-rich cultures were prepared from mouse brains as described in the Experimental Procedures section. CM and cell lysates were harvested and subjected to western blot analysis using antibodies against flotillin, HSP90, p-PI3K, pan-PI3K, p-Akt, pan-Akt, and ApoE. WT and ApoE-deficient astrocytes were cultured for 48 h, then the CM (A, B) and cell lysates (C, D) were obtained and analyzed by western blot analysis. (E) The cellular cholesterol levels were determined by a cholesterol determination kit. (F, G) Cellular levels of p-PI3K, pan-PI3K, p-Akt, and pan-Akt were determined by western blot analysis using specific antibodies against these molecules. (H, I) Flotillin and HSP90 levels in the serum collected from WT and ApoE-KO mice were subjected to western blot analysis using anti-flotillin and HSP90 antibodies. The intensity of each band was quantified by densitometry. Data are expressed as the mean ± SE. n = 3 each. *p < 0.05, **p < 0.01, ***p < 0.001 by Student’s t-test.
Figure 2
Figure 2
Levels of exosome release in cultured WT and ApoE-deficient astrocytes treated with varying concentrations of cholesterol. Primary astrocyte cultures prepared from WT and ApoE-KO mouse brain were treated with cholesterol at the concentration of 0, 5, or 10 μM. The cultures were then incubated for 48 h, and the CM and cell lysates were harvested. The samples were subjected to western blot analysis using antibodies against flotillin, HSP90, ApoE, and α-tubulin. (A) Western blot analysis of the CM and cell lysates. (B–E) The signal intensities of the western blots were quantified. (F) The cellular cholesterol levels were determined by a cholesterol determination kit. Data are expressed as the mean ± SE. n = 3. *p < 0.05, **p < 0.01, ***p < 0.001 by one-way ANOVA followed by the Bonferroni-Dunn test versus EtOH.
Figure 3
Figure 3
Levels of p-Akt, pan-AKT, p-PI3K, and pan-PI3K in WT and ApoE-deficient astrocytes treated with varying concentrations of cholesterol. Primary astrocyte cultures prepared from WT and ApoE-KO mouse brain were treated with cholesterol at the concentration of 0, 5, or 10 μM. The cultures were then incubated for 48 h, and the cell lysates were harvested. (A) The cell lysates were subjected to western blot analysis using antibodies against Akt, p-Akt, PI3K, and p-PI3K. (B–E) The intensity of each band was quantified by image analysis software (ImageJ 1.46r; Java 1.6.0-20 [64 bit]). Data are expressed as the mean ± SE. n = 3. *p < 0.05, **p < 0.01, ***p < 0.001 by one-way ANOVA followed by the Bonferroni-Dunn test.
Figure 4
Figure 4
Effect of cholesterol depletion due to β-CD on exosome release. Primary astrocyte cultures prepared from WT and ApoE-KO mouse brain were treated with β-CD at the concentration of 0.1, 1, or 2 mM, and incubated for 24 h. Then, the CM and cell lysates were harvested and subjected to western blot analysis to determine the flotillin, HSP90, and ApoE levels in the CM (A–C) and cell lysates (A, D, E). (B–E) The intensity of each band was quantified by image analysis software (ImageJ 1.46r; Java 1.6.0-20 [64 bit]). Data are expressed as the mean ± SE. n = 3 each. *p < 0.05, **p < 0.01, ***p < 0.001 by one-way ANOVA followed by the Bonferroni-Dunn test. (F) The cellular cholesterol levels were determined by a cholesterol determination kit. Data are expressed as the mean ± SE. n = 3 each. *p < 0.05, **p < 0.01, ***p < 0.001 by one-way ANOVA followed by the Bonferroni-Dunn test versus no β-CD treatment.
Figure 5
Figure 5
Effect of cholesterol depletion due to β-CD on phospho-PI3K and phospho-Akt. Astrocyte cultures prepared from WT and ApoE-KO mouse brain were treated with β-CD at the concentration of 0.1, 1, or 2 mM, and incubated for 24 h. Then, the CM and cell lysates were harvested and subjected to western blot analysis. (A) Western blot analysis was performed using antibodies against Akt, p-Akt, PI3K, p-PI3K, and α-tubulin as an internal control. (B–E) The intensity of each band was quantified by image analysis software (ImageJ 1.46r; Java 1.6.0-20 [64 bit]). Data are expressed as the mean ± SE. n = 3 each. *p < 0.05, **p < 0.01 by one-way ANOVA followed by the Bonferroni-Dunn test.
Figure 6
Figure 6
Attenuation of the activation of PI3K and Akt in ApoE-deficient astrocytes by a PI3K-specific inhibitor, LY294002. Astrocyte cultures prepared from WT and ApoE-KO mouse brain were treated with LY294002, a specific inhibitor of PI3K. The cultures were then incubated for another 2 days, and the cell lysates were harvested. (A) An equal amount of protein from each sample was subjected to western blot analysis using antibodies against Akt, p-Akt, PI3K, p-PI3K, and α-tubulin. (B–E) The intensity of each band was quantified by image analysis software (ImageJ 1.46r; Java 1.6.0-20 [64 bit]). Data are expressed as the mean ± SE. n = 3 each. *p < 0.05, **p < 0.01, ***p < 0.001 by one-way ANOVA followed by the Bonferroni-Dunn test.
Figure 7
Figure 7
Recovery of the decreased exosome release by treatment with a PI3K-specific inhibitor, LY294002, in cultured ApoE-deficient astrocytes. Astrocyte cultures prepared from WT and ApoE-KO mouse brain were treated with LY294002, a specific inhibitor of PI3K. The cultures were then incubated for another 2 days, and the CM and cell lysates were harvested. (A, B) Western blot analysis of each sample was performed to determine the levels of flotillin, HSP90, and ApoE in the CM and cell lysates from the WT and ApoE-deficient astrocytes. (C–F) The intensity of each band was quantified by image analysis software (ImageJ 1.46r; Java 1.6.0-20 [64 bit]). Data are expressed as the mean ± SE. n = 3 each. *p < 0.05, **p < 0.01, ***p < 0.001 by one-way ANOVA followed by the Bonferroni-Dunn test.
Figure 8
Figure 8
Exosome levels in the CSF and serum collected from mice that were fed a high-fat diet or control diet. Three-month-old WT mice were fed a high-fat diet or control diet for 4 months. At the age of 7 months, the mice were sacrificed, CSF was obtained from the cisterna magna, and serum was collected. Then, each sample was subjected to western blot analysis. (A) CSF samples were subjected to western blot analysis using antibodies against flotillin and HSP90. (B, C) The intensity of each band representing CSF flotillin and HSP90 was quantified by image analysis software (ImageJ 1.46r; Java 1.6.0-20 [64 bit]). (D) The cholesterol levels in mouse brain were determined by a cholesterol determination kit. (E) Serum samples were subjected to western blot analysis using antibodies against flotillin and HSP90. (F, G) The intensity of each band representing serum flotillin and HSP90 was quantified by image analysis software (ImageJ 1.46r; Java 1.6.0-20 [64 bit]). (H) The serum cholesterol concentrations were determined by a cholesterol determination kit. (I) Serum exosome levels were determined by a CD9/CD63 ELISA kit as described in the Experimental Procedures section. (J, K) ApoE levels in the CSF collected from mice fed with control diet and high-fat diet were determined by western blot analysis using anti-ApoE antibody. Data are expressed as the mean ± SE. *p < 0.05, **p < 0.01, ***p < 0.001 by Student’s t-test.

References

    1. Yanez-Mo M, Siljander PR, Andreu Z, Zavec AB, Borras FE, Buzas EI, et al. . Biological Properties of Extracellular Vesicles and Their Physiological Functions. J Extracell Vesicles (2015) 4:27066. doi: 10.3402/jev.v4.27066 - DOI - PMC - PubMed
    1. van Niel G, D’Angelo G, Raposo G. Shedding Light on the Cell Biology of Extracellular Vesicles. Nat Rev Mol Cell Biol (2018) 19(4):213–28. doi: 10.1038/nrm.2017.125 - DOI - PubMed
    1. Thery C, Ostrowski M, Segura E. Membrane Vesicles as Conveyors of Immune Responses. Nat Rev Immunol (2009) 9(8):581–93. doi: 10.1038/nri2567 - DOI - PubMed
    1. Pisitkun T, Shen RF, Knepper MA. Identification and Proteomic Profiling of Exosomes in Human Urine. Proc Natl Acad Sci U.S.A. (2004) 101(36):13368–73. doi: 10.1073/pnas.0403453101 - DOI - PMC - PubMed
    1. Laulagnier K, Motta C, Hamdi S, Roy S, Fauvelle F, Pageaux JF, et al. . Mast Cell- and Dendritic Cell-Derived Exosomes Display a Specific Lipid Composition and an Unusual Membrane Organization. Biochem J (2004) 380(Pt 1):161–71. doi: 10.1042/BJ20031594 - DOI - PMC - PubMed

Publication types