. 2021 Oct 15:12:759323.
doi: 10.3389/fimmu.2021.759323. eCollection 2021.

Integrating Serum Metabolome and Gut Microbiome to Evaluate the Benefits of Lauric Acid on Lipopolysaccharide- Challenged Broilers

Affiliations

Integrating Serum Metabolome and Gut Microbiome to Evaluate the Benefits of Lauric Acid on Lipopolysaccharide- Challenged Broilers

Yanping Wu et al. Front Immunol. .

Abstract

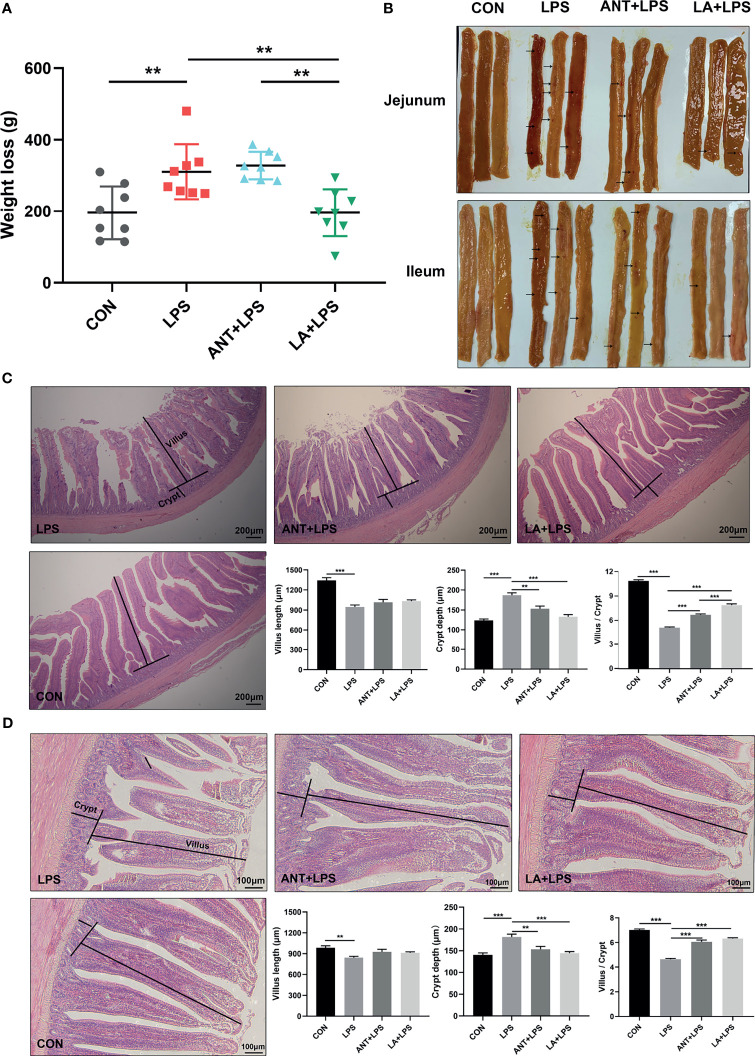
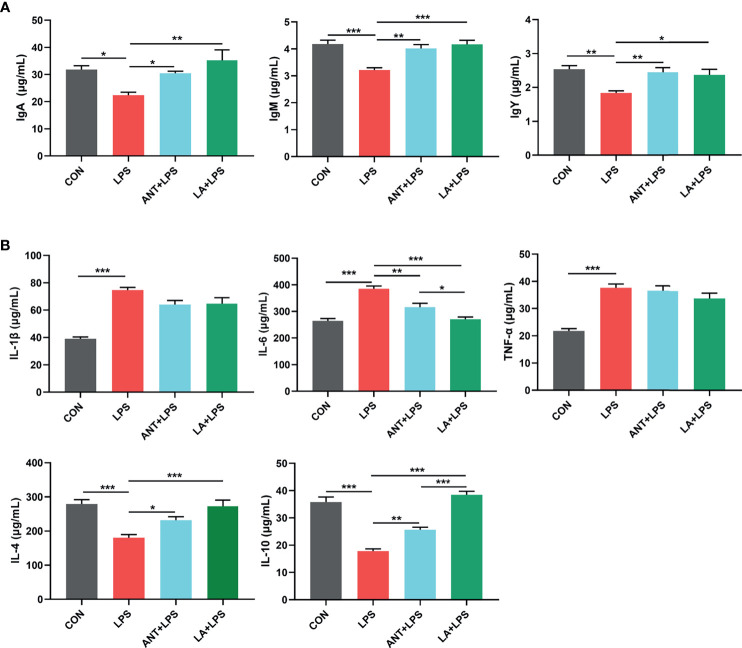
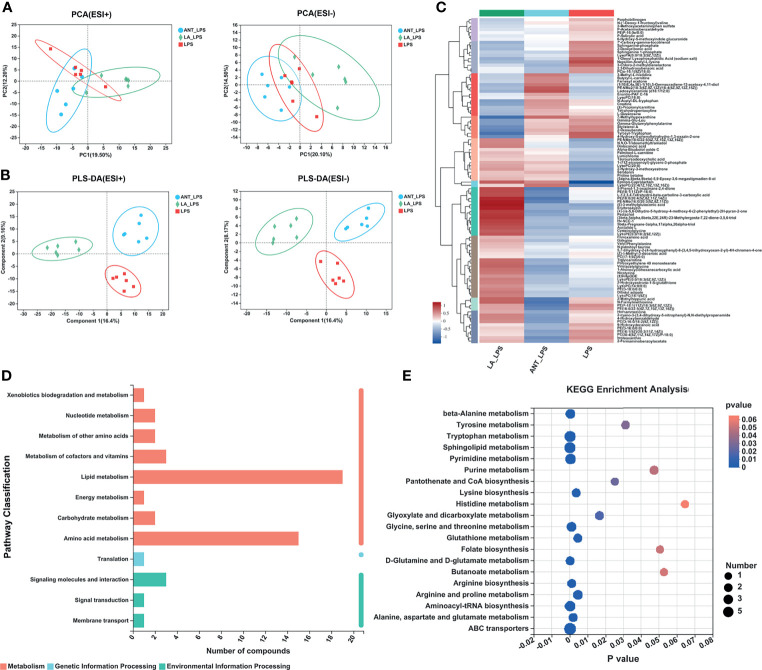
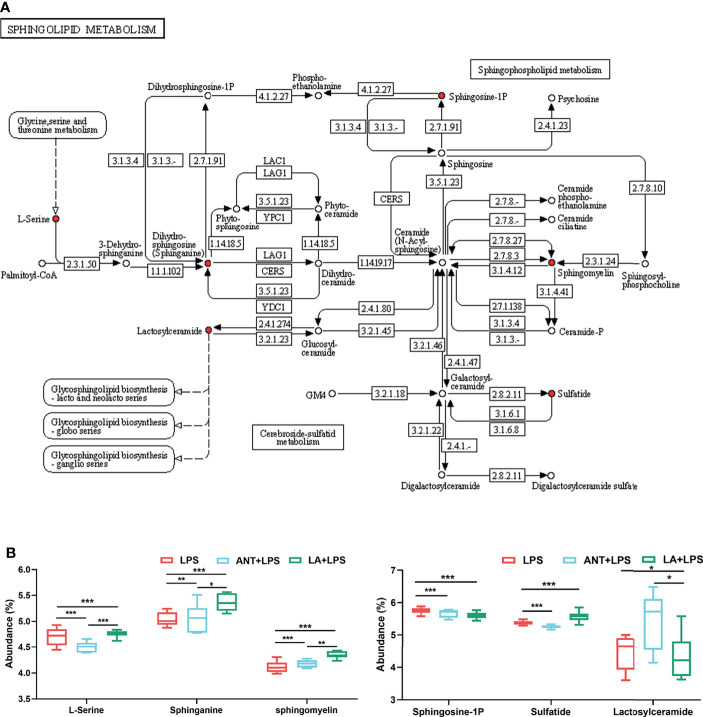
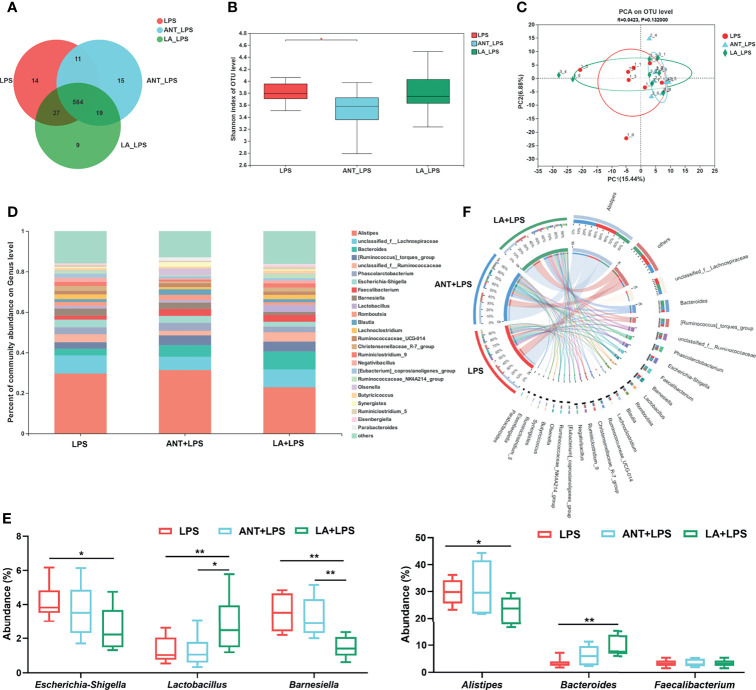
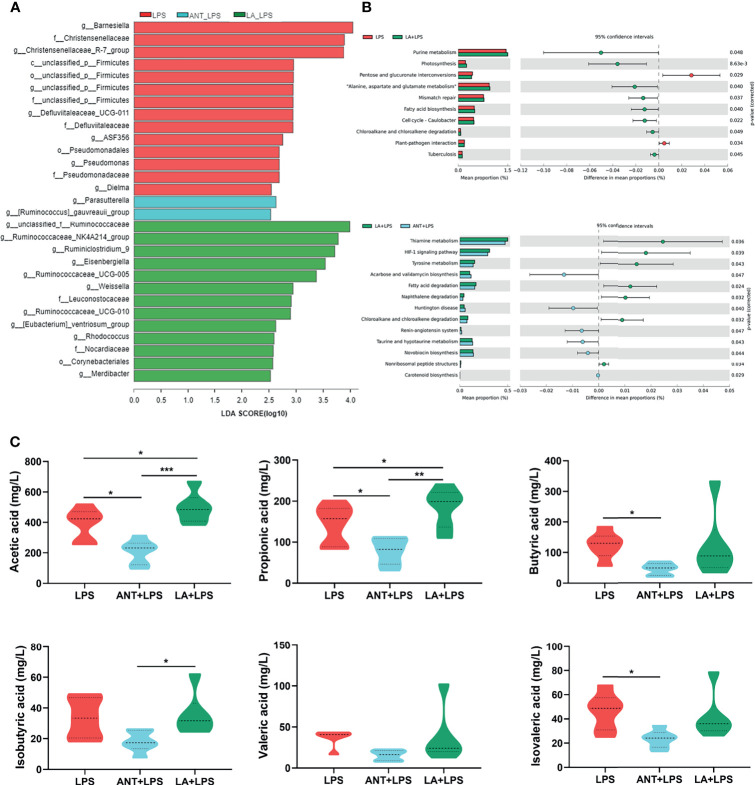
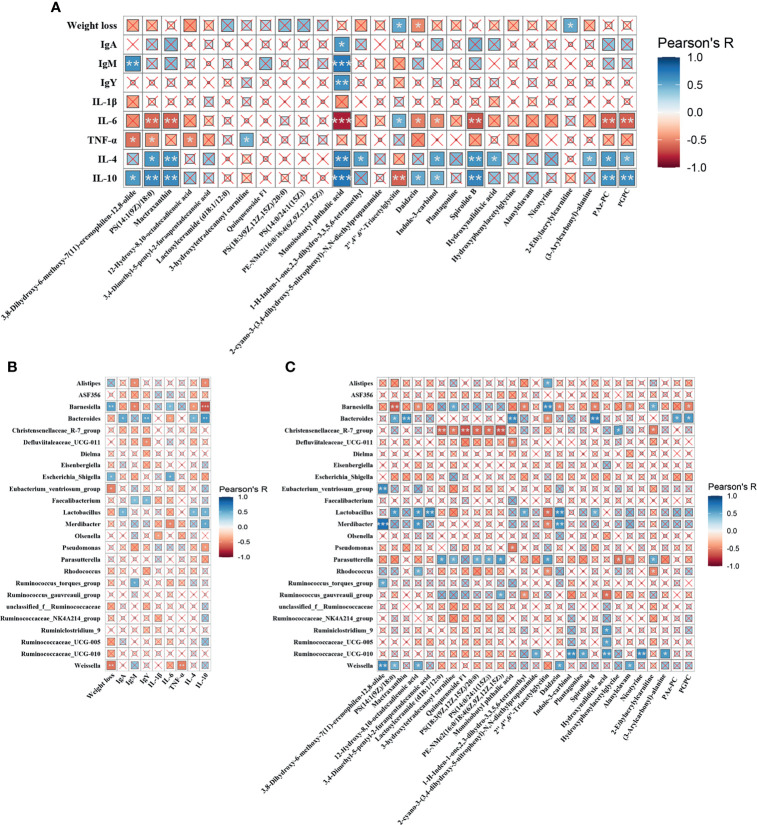
Lauric acid (LA) is a crucial medium-chain fatty acid (MCFA) that has many beneficial effects on humans and animals. This study aimed to investigate the effects of LA on the intestinal barrier, immune functions, serum metabolism, and gut microbiota of broilers under lipopolysaccharide (LPS) challenge. A total of 384 one-day-old broilers were randomly divided into four groups, and fed with a basal diet, or a basal diet supplemented with 75 mg/kg antibiotic (ANT), or a basal diet supplemented with 1000 mg/kg LA. After 42 days of feeding, three groups were intraperitoneally injected with 0.5 mg/kg Escherichia coli- derived LPS (LPS, ANT+LPS and LA+LPS groups) for three consecutive days, and the control (CON) group was injected with the same volume of saline. Then, the birds were sacrificed. Results showed that LA pretreatment significantly alleviated the weight loss and intestinal mucosal injuries caused by LPS challenge. LA enhanced immune functions and inhibited inflammatory responses by upregulating the concentrations of immunoglobulins (IgA, IgM, and IgY), decreasing IL-6 and increasing IL-4 and IL-10. Metabolomics analysis revealed a significant difference of serum metabolites by LA pretreatment. Twenty-seven serum metabolic biomarkers were identified and mostly belong to lipids. LA also markedly modulated the pathway for sphingolipid metabolism, suggesting its ability to regulate lipid metabolism. Moreover,16S rRNA analysis showed that LA inhibited LPS-induced gut dysbiosis by altering cecal microbial composition (reducing Escherichia-Shigella, Barnesiella and Alistipes, and increasing Lactobacillus and Bacteroides), and modulating the production of volatile fatty acids (VFAs). Pearson's correlation assays showed that alterations in serum metabolism and gut microbiota were strongly correlated to the immune factors; there were also strong correlations between serum metabolites and microbiota composition. The results highlight the potential of LA as a dietary supplement to combat bacterial LPS challenge in animal production and to promote food safety.

Keywords: LPS challenge; broilers; gut microbiota; lauric acid; serum metabolism.


Conflict of interest statement

Authors JL and YL are employed by Zhejiang Vegamax Biotechnology Co., Ltd. The remaining authors declare that the research was conducted in the absence of any commercial or financial relationships that could be construed as a potential conflict of interest.

Figures

Figure 1
Figure 1
Lauric acid (LA) attenuated the weight loss and intestinal injuries of lipopolysaccharide (LPS)- challenged broilers. CON: fed with a basal diet and injected with saline; LPS: fed with a basal diet and injected with 0.5 mg/kg LPS; ANT+LPS: fed with a basal diet supplemented with 75 mg/kg ANT, and injected with 0.5 mg/kg LPS; LA+LPS: fed with a basal diet supplemented with 1000 mg/kg LA, and injected with 0.5 mg/kg LPS. N=8 in each group. (A) Weight loss. Weight loss was calculated using the equation: weight on day 42 - weight on day 44. (B) Pictures of the jejunal and ileal lumen. The arrows indicates the hemorrhagic spots. (C) Histomorphometric analysis of the jejunum by Hematoxylin & Eosin (H&E) staining. 40× magnification, scale bar: 200μm. (D) Ileum histomorphometric analysis. 100× magnification, scale bar: 100μm. The villus height and crypt depth shown in the pictures were randomly measured in 10 visual fields in each sample from each group. The data shown as mean ± SEM were analyzed using one-way ANOVA and Tukey’s test. **P < 0.01, ***P < 0.001.
Figure 2
Figure 2
Lauric acid (LA) modulated the immune functions of broilers under lipopolysaccharide (LPS)- challenge. CON: fed with a basal diet and injected with saline; LPS: fed with a basal diet and injected with 0.5 mg/kg LPS; ANT+LPS: fed with a basal diet supplemented with 75 mg/kg ANT, and injected with 0.5 mg/kg LPS; LA+LPS: fed with a basal diet supplemented with 1000 mg/kg LA, and injected with 0.5 mg/kg LPS. (A) Concentrations of serum IgA, IgM, and IgY (B) Levels of serum cytokines (IL-1β, IL-4, IL-6, IL-10, and TNF-α). Data shown as mean ± SEM were analyzed by one-way ANOVA and Tukey’s test (N = 8 in each group). *P < 0.05, **P < 0.01, ***P < 0.001.
Figure 3
Figure 3
Multivariate statistical analysis, hierarchical clustering and summary of Kyoto Encyclopedia of Genes and Genomes (KEGG) enrichment pathways. LPS: fed with a basal diet and injected with 0.5 mg/kg LPS; ANT+LPS: fed with a basal diet supplemented with 75 mg/kg ANT, and injected with 0.5 mg/kg LPS; LA+LPS: fed with a basal diet supplemented with 1000 mg/kg LA, and injected with 0.5 mg/kg LPS. N=6 in each group. (A) Principal component analysis (PCA) score plot of nontargeted metabolite profiling of the serum samples among the three groups in both positive (ESI+) and negative ionization modes (ESI-). (B) Partial least squares-discriminant analysis (PLS-DA) score plot of metabolite profiling among groups in ESI+ and ESI-. (C) Hierarchical clustering analysis of serum metabolites from the LPS, ANT+LPS and LA+LPS groups. (D) KEGG pathway classification. The compounds were enriched and numbered at the second KEGG level. (E) Bubble diagram showing the KEGG enrichment analysis. The bubble size indicates enriched the numbers, while the color shade indicates the differences.
Figure 4
Figure 4
Analysis of Sphingolipid metabolism pathway. LPS: fed with a basal diet and injected with 0.5 mg/kg LPS; ANT+LPS: fed with a basal diet supplemented with 75 mg/kg ANT, and injected with 0.5 mg/kg LPS; LA+LPS: fed with a basal diet supplemented with 1000 mg/kg LA, and injected with 0.5 mg/kg LPS. N=6 in each group. (A) Kyoto Encyclopedia of Genes and Genomes (KEGG) pathway map of Sphingolipid metabolism (map00600). The red nodes represent the differential metabolites. (B) Analysis of the differential metabolites by one-way ANOVA and Tukey’s test. *P < 0.05, **P < 0.01, ***P < 0.001.
Figure 5
Figure 5
Analysis of the diversity and composition of gut microbiota. LPS: fed with a basal diet and injected with 0.5 mg/kg LPS; ANT+LPS: fed with a basal diet supplemented with 75 mg/kg ANT, and injected with 0.5 mg/kg LPS; LA+LPS: fed with a basal diet supplemented with 1000 mg/kg LA, and injected with 0.5 mg/kg LPS. N=8 in each group. (A) Venn diagram presenting the operational taxonomic units (OTUs) from each group. (B) Shannon index of OTU level reflecting the α diversity. (C) β diversity shown in a Principal component analysis (PCA) scatterplot. (D) Bar graph of microbial composition at the genus level. (E) Box plot of the significant genera among groups. (F) Circos diagram indicating the dominant genera in each group. The data were analyzed by one-way ANOVA and Tukey’s test. *P < 0.05, **P < 0.01.
Figure 6
Figure 6
Analysis of taxonomic biomarkers, predicted microbial functions and volatile fatty acid (VFA) production. LPS: fed with a basal diet and injected with 0.5 mg/kg LPS; ANT+LPS: fed with a basal diet supplemented with 75 mg/kg ANT, and injected with 0.5 mg/kg LPS; LA+LPS: fed with a basal diet supplemented with 1000 mg/kg LA, and injected with 0.5 mg/kg LPS. (A) Histogram of Linear discriminant analysis (LDA) scores representing the taxonomic biomarkers by LDA effect size (LEfSe) analysis. LDA score (log10) >2 suggests the enriched taxa in cases, N=8 in each group. (B) Comparisons of gut microbes (LPS vs. LA+LPS, LA+LPS vs. ANT+LPS) by statistical analysis of taxonomic and functional profiles (STAMP), N=8 in each group. (C) Violin plots displaying VFA production of the cecal microbiota, N=6 in each group. Data shown as Mean ± SEM were analyzed by one-way ANOVA and Tukey’s test. *P < 0.05, **P < 0.01, ***P < 0.001.
Figure 7
Figure 7
Heatmaps of Pearson’s correlation. (A) Correlation between the metabolic biomarkers and immune indices. (B) Correlation between differential microbiota and immune parameters. (C) Correlation between the differential microbiota and metabolic biomarkers. The sizes of the small boxes reflect the correlation coefficient. The colors were according to the Pearson’s correlation coefficient distribution. ×P > 0.05, *P < 0.05, **P < 0.01, ***P < 0.001.

References

    1. Dayrit FM. The Properties of Lauric Acid and Their Significance in Coconut Oil. J Am Oil Chem Soc (2015) 92:1–15. doi: 10.1007/s11746-014-2562-7 - DOI
    1. Liu YH, Zhang Y, Zhang XS, Xu Q, Yang XY, Xue CY. Medium-Chain Fatty Acids Reduce Serum Cholesterol by Regulating the Metabolism of Bile Acid in C57BL/6J Mice. Food Funct (2017) 8:291–8. doi: 10.1039/c6fo01207h - DOI - PubMed
    1. De Preter V, Machiels K, Joossens M, Arijs I, Matthys C, Vermeire S, et al. Faecal Metabolite Profiling Identifies Medium-Chain Fatty Acids as Discriminating Compounds in IBD. Gut (2015) 64:447–58. doi: 10.1136/gutjnl-2013-306423 - DOI - PubMed
    1. Clitherow KH, Binaljadm TM, Hansen J, Spain SG, Hatton PV, Murdoch C. Medium-Chain Fatty Acids Released From Polymeric Electrospun Patches Inhibit Candida Albicans Growth and Reduce the Biofilm Viability. Acs Biomater Sci Eng (2020) 6:4087–95. doi: 10.1021/acsbiomaterials.0c00614 - DOI - PMC - PubMed
    1. Baltić B, Starčević M, Đorđević J, Mrdović B, Marković R. Importance of Medium Chain Fatty Acids in Animal Nutrition. IOP Conf Ser Earth Environ Sci (2017) 85:012048. doi: 10.1088/1755-1315/85/1/012048 - DOI

Publication types