. 2021 Oct 14:12:741641.
doi: 10.3389/fpls.2021.741641. eCollection 2021.

AhABI4s Negatively Regulate Salt-Stress Response in Peanut

Affiliations

AhABI4s Negatively Regulate Salt-Stress Response in Peanut

Lu Luo et al. Front Plant Sci. .

Abstract

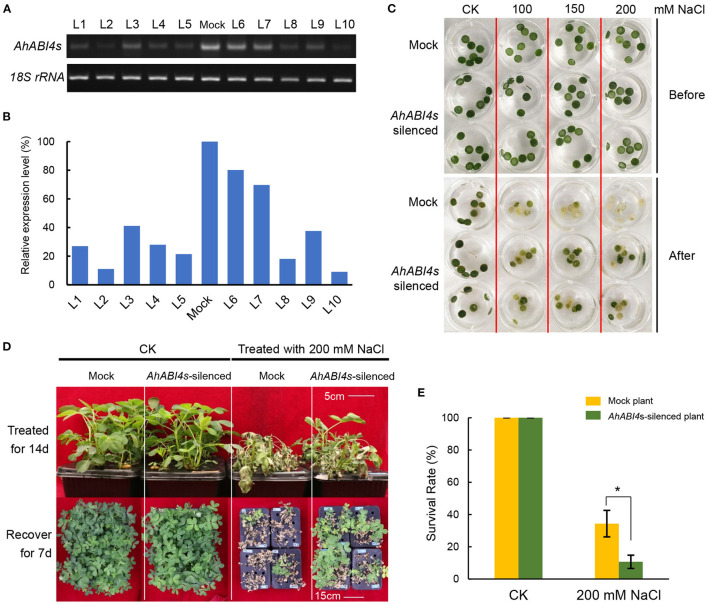
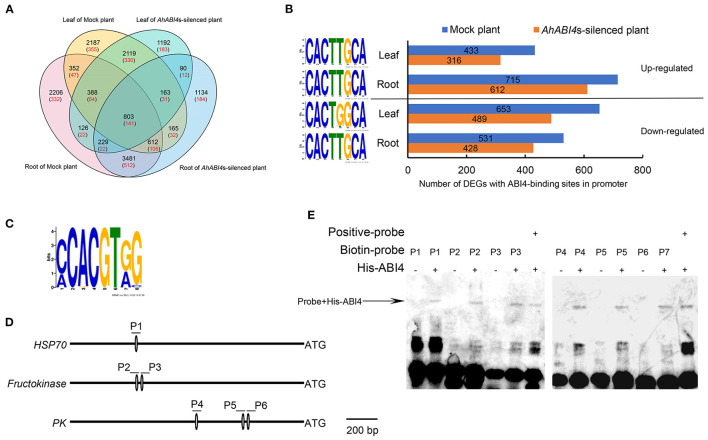
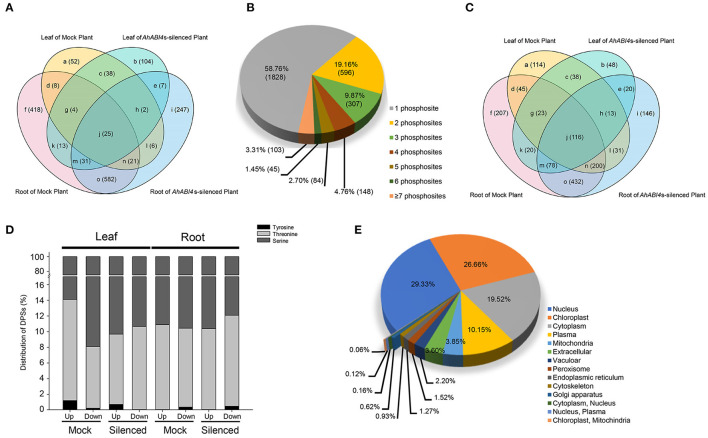
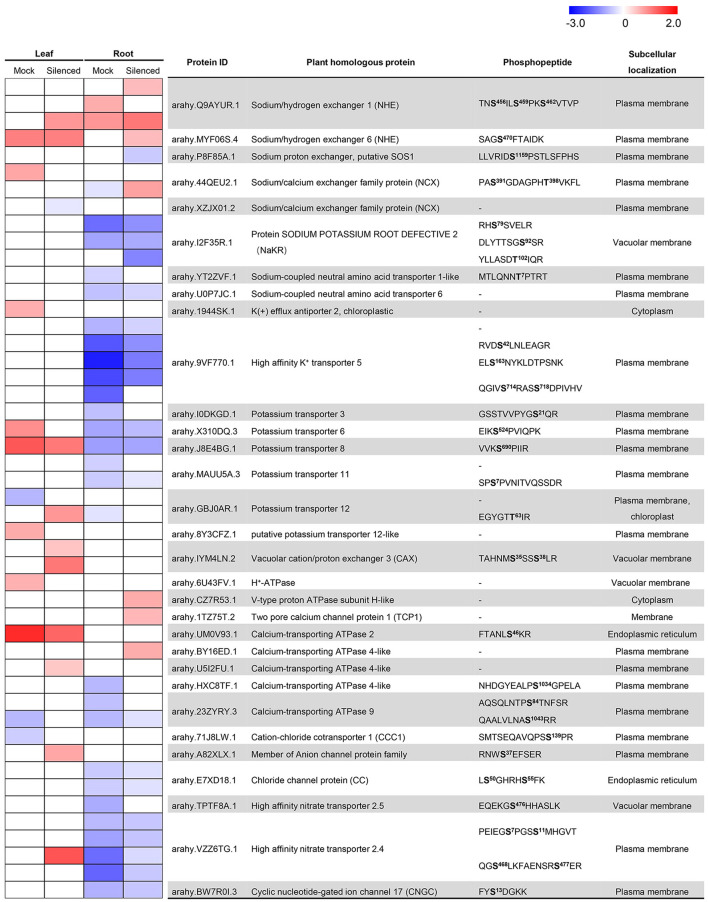
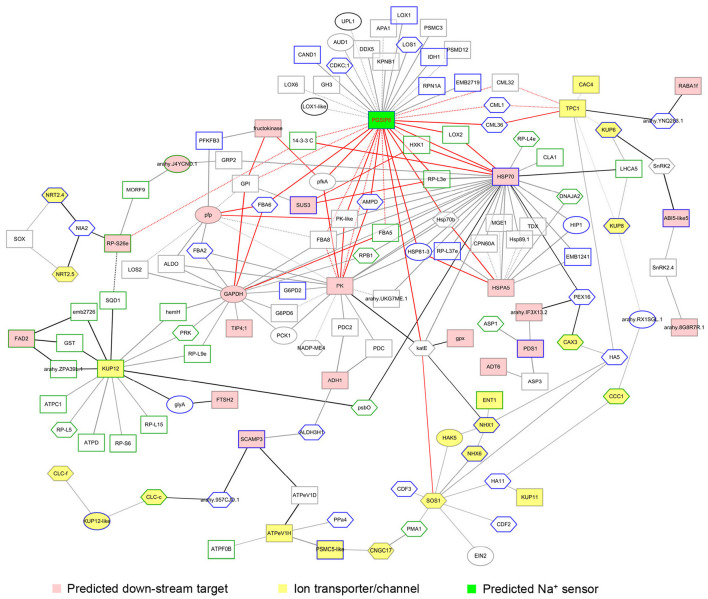
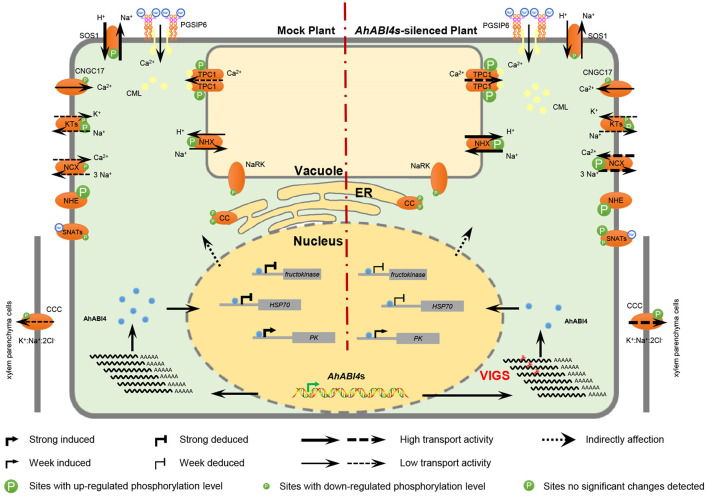
Soil salinity is one of the major factors that limit the area of cultivable land and yield potential of crops. The ability of salt tolerance varies with plant species. Peanut (Arachis hypogaea L.) is a moderately salt-sensitive and economically important crop, however, their biological processes involved in salt-stress response remain unclear. In this study, we investigated the role of A. hypogaea L. ABSCISIC ACID INSENSITIVE 4s (AhABI4s) in salt tolerance and elucidated its mode of action in peanuts. The results showed that the downregulation of AhABI4s via whole plant virus-induced gene silencing has enhanced the survival rate, biomass accumulation, and root/shoot ratio of peanut seedlings in response to salt-stress. Transcriptomics, quantitative proteomics, and phosphoproteomic analyses were performed using AhABI4s-silenced and Mock plants. The expression pattern of 15,247 genes, 1,900 proteins, and 2,620 phosphorylation sites were affected by silencing of AhABI4s in peanut leaf and root after sodium chloride (NaCl) treatment. Among them, 63 potential downstream target genes of ABI4 changed consistently at both transcription and translation levels, and the protein/phosphorylation levels of 31 ion transporters/channels were also affected. Electrophoretic mobility shift assays (EMSA) showed that ABI4 was able to bind to the promoters of HSP70, fructokinase (FRK), and pyruvate kinase (PK) coding genes in vitro. In addition, we also detected a binding preference of AhABI4 for CACT(G/T)GCA motif in the promoters of down-regulated genes in peanut leaf. Collectively, the potential downstream targets which were regulated at the levels of transcription and translation, binding preference, and in vivo phosphorylation sites that had been revealed in this study will provide new insight into the AhABI4s-mediated salt tolerance regulation mechanism in peanuts.

Keywords: downstream target; ion transporter/channel; peanut ABI4s; quantitative proteome and phosphoproteome; salt stress; transcriptome.


Conflict of interest statement

The authors declare that the research was conducted in the absence of any commercial or financial relationships that could be construed as a potential conflict of interest.

Figures

Figure 1
Figure 1
Phenotype analysis of AhABI4s-silenced lines under salt-stress. (A,B) Detection of AhABI4 mRNA level at 7 d after inoculation. Target product quantity was calculated by gray scanning in ImageJ (NIH, Bethesda, MD, USA). The relative AhABI4s expression level in AhABI4s-silenced plants was compared against that in Mock plants. (C) Leaf disc assay under salt-stress. Two or three discs were punched from each seedling depending on leaf size and quantity. More than 20 seedlings were tested in each replicate. (D) Phenotypes of Mock and AhABI4s-silenced seedlings after the 14-day salt-stress treatment and 7-day recovery. (E) Survival rates of Mock and AhABI4s-silenced seedlings after the 7-day recovery with or without salt-stress treatment. At least 100 seedlings were tested per treatment and three independent experiments were performed. The student's t-test was performed to detect significant differences in survival rate between Mock and AhABI4s-silenced plants. *P < 0.05.
Figure 2
Figure 2
Analysis of potential downstream targets of ABI4 protein. (A) Venn analysis of all differentially expressed genes (DEGs; black) and differentially expressed putative downstream target of ABI4 (red) among samples. (B) Regulation type of DEGs with ABI4-binding S-box in their promoter region (right). The sequence of S-box in corresponding DEGs and tissues (left). (C) ABI4-binding motif in 63 putative downstream ABI4 targets under salt-stress. (D) Schematic diagrams showing ABI4-binding motif in promoter regions of HSP70, fructokinase, and pyruvate kinase genes. P1–P6 represent six pairs of probes containing ABI4-binding motifs. (E) EMSA showing ABI4 protein binding to promoters of HSP70, fructokinase, and pyruvate kinase genes.
Figure 3
Figure 3
Characteristics of the proteomic and phosphoproteomic data in Mock and AhABI4s-silenced peanut leaf and root. (A) Overlap of the DEPs identified in different samples in proteomic data. (B) Proportions of single and multiple phosphorylation sites per DEP in phosphoproteome. (C) Overlap of the DEPs identified in different samples of phosphoproteomic data. (D) Proportions of different phosphorylated amino acid residues in each sample. (E) Predicted subcellular localization of DEPs in proteome and phosphoproteome.
Figure 4
Figure 4
Detection and change ratios of ion transporters and exchangers identified in proteomic and phosphoproteomic data. The color display changing ratio (log2 transformed) per protein/site after salt-stress treatment according to the indicated gradient. In the heatmap, the row corresponding to “-” indicated change ratios of the gene at the translational level. Predicted phosphorylation sites marked in bold; superscript indicates the position of modified amino acid in the peptide chain.
Figure 5
Figure 5
Visualization of the salt-stress response network regulated by AhABI4s. FASTA format of amino acid sequences of identified differentially expressed proteins (DEPs) was submitted to STRING. Interaction databases of Arabidopsis thaliana, Glycine max, and Medicago truncatula served as references. The minimum required interaction score was >0.7. Certain ion transporters/channels with interaction scores between 0.5 and 0.7 were reserved. Pink and yellow nodes represent predicted downstream targets of AhABI4s and the ion transporters/channels affected by silencing of AhABI4s. Board paint of each node indicated the expressed tissue of each protein. Green and gray boards mark proteins expressed in leaves and roots, respectively. Blue boards mark proteins expressed in both leaves and roots. Protein changes at translation, phosphorylation, or both levels represented by rectangle, hexagon, and ellipse, respectively. Widths of edges between nodes represent combined scores.
Figure 6
Figure 6
Hypothetical model of ion homeostasis regulated by AhABI4s under salt-stress. Virus-induced gene silencing downregulated AhABI4s and influenced the expression of downstream targets (nucleus). Changes in protein levels of the downstream targets altered protein-protein interactions, which further lead to phosphorylation level and phosphorylation sites alteration in ion transporter/channel. Predicted peanut Na+ sensor PGSIP6 detected extracellular Na+ and gated Ca2+ influx channel on the plasma membrane to increase cytoplasmic Ca2+ content. On the other hand, PGSIP6 may also induce the transporting of vacuole Ca2+ into the cytoplasm via interaction with CMLs. Silencing of AhABI4s facilitated this process by promoting CML accumulation and TPC1 phosphorylation. Elevated Ca2+ content triggered a cellular defensive response to salt-stress. Na+ in the cytoplasm was transported into vacuoles and out of cells by NHX and NCX, respectively. In AhABI4s-silenced plants, NHX and NCX phosphorylation levels were higher than those in Mock plants and corresponded to relatively higher ion transport activity. Excess Na+ transported out of cytoplasm was transported into xylem parenchyma cells by CCC protein. Comparatively reduced cytoplasmic Na+ content in AhABI4s-silenced plants explained their salt tolerance phenotype. Solid and broken arrows represent proven and predicted functions, respectively.

References

    1. Ayub M. A., Ahmad H. R., Ali M., Rizwan M., Ali S., Zia ur Rehman M., et al. . (2020). Salinity and its tolerance strategies in plants, in Plant Life Under Changing Environment, eds Tripathi D. K., Pratap Singh V., Chauhan D. K., Sharma S., Prasad S. M., Dubey N. K., Ramawat N. (Cambridge, MA: Academic Press; ), 47–76. 10.1016/B978-0-12-818204-8.00003-5 - DOI
    1. Bao W. Q., Wang X. W., Chen M., Chai T. Y., Wang H. (2018). A WRKY transcription factor, PcWRKY33, from Polygonum cuspidatum reduces salt tolerance in transgenic Arabidopsis thaliana. Plant Cell Rep. 37, 1033–1048. 10.1007/s00299-018-2289-2 - DOI - PubMed
    1. Bertioli D. J., Cannon S. B., Froenicke L., Huang G., Farmer A. D., Cannon E. K., et al. . (2016). The genome sequences of Arachis duranensis and Arachis ipaensis, the diploid ancestors of cultivated peanut. Nat. Genet. 48, 438–446. 10.1038/ng.3517 - DOI - PubMed
    1. Bertioli D. J., Jenkins J., Clevenger J., Dudchenko O., Gao D., Seijo G., et al. . (2019). The genome sequence of segmental allotetraploid peanut Arachis hypogaea. Nat. Genet. 51, 877–884. 10.1038/s41588-019-0405-z - DOI - PubMed
    1. Bo C., Chen H. W., Luo G. W., Li W., Zhang X. G., Ma Q., et al. . (2020). Maize WRKY114 gene negatively regulates salt-stress tolerance in transgenic rice. Plant Cell Rep. 39, 135–148. 10.1007/s00299-019-02481-3 - DOI - PubMed