. 2021 Oct 14:12:764537.
doi: 10.3389/fpls.2021.764537. eCollection 2021.

Footprints of Selection Derived From Temporal Heterozygosity Patterns in a Barley Nested Association Mapping Population

Affiliations

Footprints of Selection Derived From Temporal Heterozygosity Patterns in a Barley Nested Association Mapping Population

Andreas Maurer et al. Front Plant Sci. .

Abstract

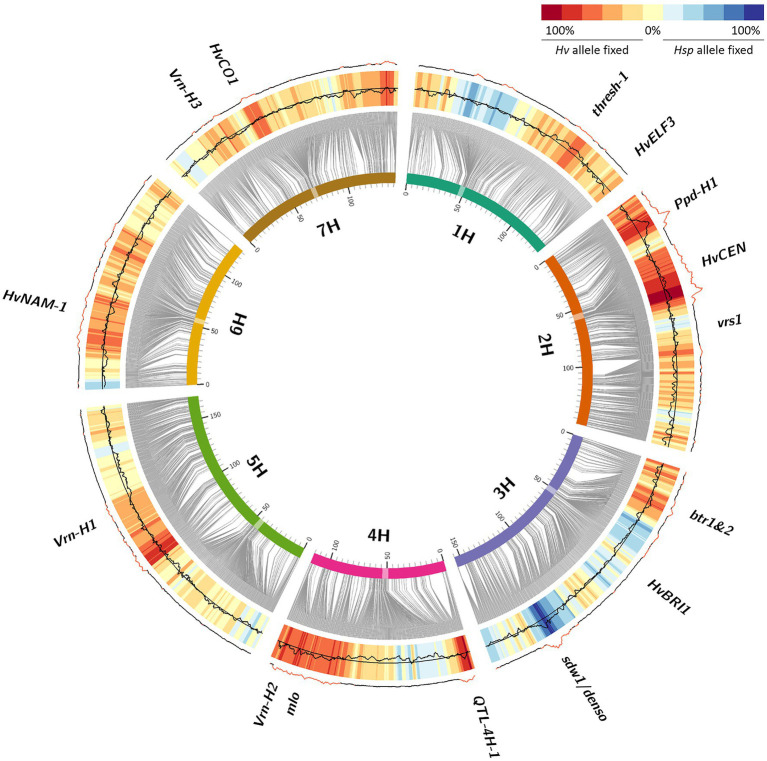
Nowadays, genetic diversity more than ever represents a key driver of adaptation to climate challenges like drought, heat, and salinity. Therefore, there is a need to replenish the limited elite gene pools with favorable exotic alleles from the wild progenitors of our crops. Nested association mapping (NAM) populations represent one step toward exotic allele evaluation and enrichment of the elite gene pool. We investigated an adaptive selection strategy in the wild barley NAM population HEB-25 based on temporal genomic data by studying the fate of 214,979 SNP loci initially heterozygous in individual BC1S3 lines after five cycles of selfing and field propagation. We identified several loci exposed to adaptive selection in HEB-25. In total, 48.7% (104,725 SNPs) of initially heterozygous SNP calls in HEB-25 were fixed in BC1S3:8 generation, either toward the wild allele (19.9%) or the cultivated allele (28.8%). Most fixed SNP loci turned out to represent gene loci involved in domestication and flowering time as well as plant height, for example, btr1/btr2, thresh-1, Ppd-H1, and sdw1. Interestingly, also unknown loci were found where the exotic allele was fixed, hinting at potentially useful exotic alleles for plant breeding.

Keywords: adaptive evolution; artificial selection; barley; heterozygosity; natural selection; selection; temporal genomic data; unconscious selection.


Conflict of interest statement

The authors declare that the research was conducted in the absence of any commercial or financial relationships that could be construed as a potential conflict of interest.The handling editor declared a shared consortium with one of the authors KP at time of review.

Figures

Figure 1
Figure 1
Population conservation and sampling strategy from generation BC1S3 to BC1S3:8. Exemplified for one heterozygous SNP in BC1S3, which is traced through four seasons of field propagation (2011–2014) followed by pooled DNA sampling of 12 seedlings in BC1S3:8. Heterogeneity within these 12 seedlings leads to heterozygous allele calls in Illumina 50k genotyping and is termed “reconstructed heterozygosity”. The expected segregation of a single SNP in HEB-25 generation BC1S3 is equal to 71.875% homozygous Barke, 6.25% heterozygous, and 21.875% homozygous wild barley. Without selection, the expected SNP segregation of the offspring of a heterozygous HEB-25 plant in generation BC1S3:8 is equal to 48.4375% homozygous Barke, 3.125% heterozygous, and 48.4375% homozygous wild barley, giving rise to a reconstructed heterozygous genotype B, resulting in a score of 0 in the reconstructed genotype matrix; Supplementary Table S1). A and C indicate different possible scenarios of allele distribution in case of selection for Hsp allele A, resulting in a score of 1 in the reconstructed genotype matrix) or Hv allele (C, resulting in a score of −1 in the reconstructed genotype matrix) in previous generations (here exemplified for BC1S3:7). Note that a homozygously fixed allele call in Illumina genotyping can be obtained despite the presence of small amounts of opposite alleles in the pooled sample C.
Figure 2
Figure 2
Allele fixation from BC1S3 to BC1S3:8 generations in HEB-25. Barley chromosomes are indicated as inner circle of colored bars; centromeres are highlighted as transparent boxes. Grey connector lines represent the genetic position (in cM) of SNPs on chromosomes based on Maurer et al. (2015). The black line indicates the allele fixation rate (AFR) of SNPs in BC1S3:8 calculated from originally heterozygous HEB-25 lines, summarized over 10 consecutive SNPs. The central reference line indicates the average AFR of 0.486, while the limits of the heat map represent AFRs of 0 (inner) and 1 (outer). AFRs higher than 0.5 represent locus-specific above-average fixation throughout the whole HEB-25 population in BC1S3:8. The heat map represents the relative fixation direction (RFD), indicating the tendency which allele was fixed in originally heterozygous HEB-25 lines, summarized over 10 consecutive SNPs. Red regions in the outer line indicate significant deviations of RFD from an equal segregation at P(Bonferroni)<0.01. Candidate genes of barley domestication and flowering time as well as further striking genomic regions are indicated outside.
Figure 3
Figure 3
Relative fixation direction (RFD) compared to Hsp allele effects of different agronomic traits. Barley chromosomes are indicated as inner circle of colored bars; centromeres are highlighted as transparent boxes. Grey connector lines represent the genetic position (in cM) of SNPs on chromosomes based on Maurer et al. (2015). The inner heat map (I) represents the RFD, indicating the tendency which allele was fixed in originally heterozygous HEB-25 lines, summarized over 10 consecutive SNPs. The other heat maps (A-H) indicate Hsp allele effect size and direction as compared to the Hv allele, based on linear regression. The extreme values of the heat maps were standardized to the most extreme observed absolute Hsp allele effect for each trait. Candidate genes of barley domestication and flowering time as well as further striking genomic regions are indicated outside.
Figure 4
Figure 4
Regression of estimated Hsp allele SNP effect for plant height on RFD. The Pearson correlation coefficient (r) is 0.48. The blue dashed line indicates the linear regression line.

References

    1. Andrés F., Coupland G. (2012). The genetic basis of flowering responses to seasonal cues. Nat. Rev. Genet. 13, 627–639. doi: 10.1038/nrg3291, PMID: - DOI - PubMed
    1. Bayer M. M., Rapazote-Flores P., Ganal M., Hedley P. E., Macaulay M., Plieske J., et al. . (2017). Development and evaluation of a barley 50k iSelect SNP Array. Front. Plant Sci. 8:1792. doi: 10.3389/fpls.2017.01792, PMID: - DOI - PMC - PubMed
    1. Blijenburg J. G., Sneep J. (1975). Natural selection in a mixture of eight barley varieties, grown in six successive years. 1. Competition between the varieties. Euphytica 24, 305–315. doi: 10.1007/BF00028195 - DOI
    1. Boyd W., Gordon A., LaCroix L. (1971). Seed size, germination resistance and seedling vigor in barley. Can. J. Plant Sci. 51, 93–99. doi: 10.4141/cjps71-021 - DOI
    1. Büttner B., Draba V., Pillen K., Schweizer G., Maurer A. (2020). Identification of QTLs conferring resistance to scald (Rhynchosporium commune) in the barley nested association mapping population HEB-25. BMC Genomics 21:837. doi: 10.1186/s12864-020-07258-7, PMID: - DOI - PMC - PubMed

LinkOut - more resources