

Peripheral Blood-Based Gene Expression Studies in Schizophrenia: A Systematic Review
- PMID: 34721526
- PMCID: PMC8548640
- DOI: 10.3389/fgene.2021.736483
Peripheral Blood-Based Gene Expression Studies in Schizophrenia: A Systematic Review
Abstract
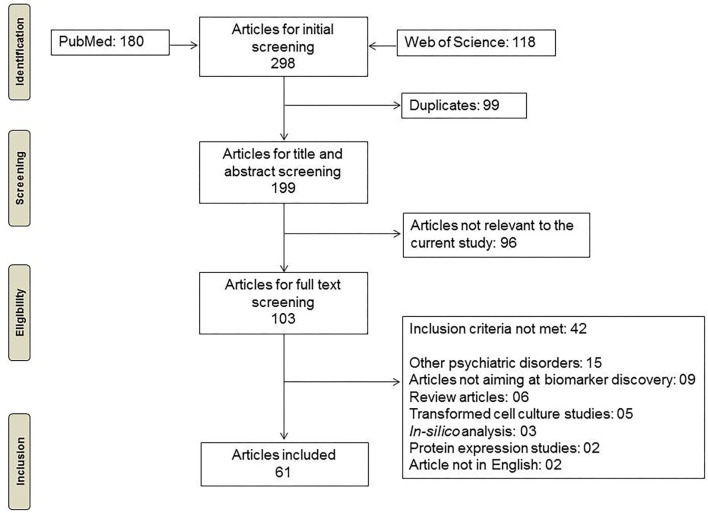
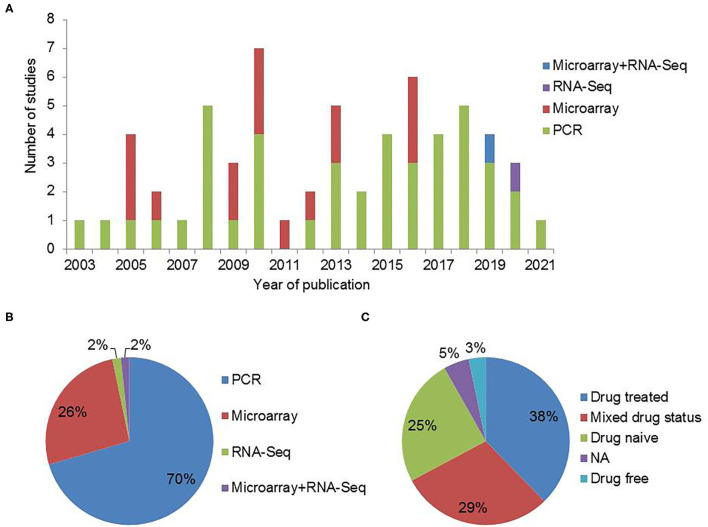
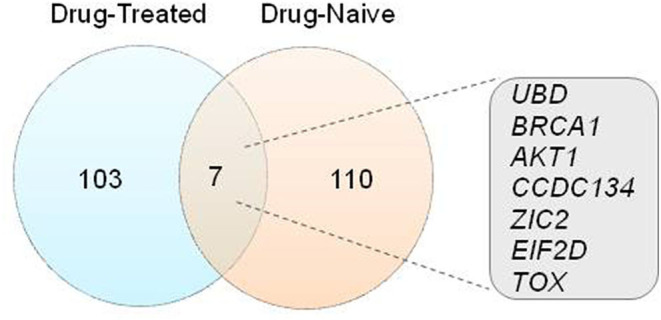
Schizophrenia is a disorder that is characterized by delusions, hallucinations, disorganized speech or behavior, and socio-occupational impairment. The duration of observation and variability in symptoms can make the accurate diagnosis difficult. Identification of biomarkers for schizophrenia (SCZ) can help in early diagnosis, ascertaining the diagnosis, and development of effective treatment strategies. Here we review peripheral blood-based gene expression studies for identification of gene expression biomarkers for SCZ. A literature search was carried out in PubMed and Web of Science databases for blood-based gene expression studies in SCZ. A list of differentially expressed genes (DEGs) was compiled and analyzed for overlap with genetic markers, differences based on drug status of the participants, functional enrichment, and for effect of antipsychotics. This literature survey identified 61 gene expression studies. Seventeen out of these studies were based on expression microarrays. A comparative analysis of the DEGs (n = 227) from microarray studies revealed differences between drug-naive and drug-treated SCZ participants. We found that of the 227 DEGs, 11 genes (ACOT7, AGO2, DISC1, LDB1, RUNX3, SIGIRR, SLC18A1, NRG1, CHRNB2, PRKAB2, and ZNF74) also showed genetic and epigenetic changes associated with SCZ. Functional enrichment analysis of the DEGs revealed dysregulation of proline and 4-hydroxyproline metabolism. Also, arginine and proline metabolism was the most functionally enriched pathway for SCZ in our analysis. Follow-up studies identified effect of antipsychotic treatment on peripheral blood gene expression. Of the 27 genes compiled from the follow-up studies AKT1, DISC1, HP, and EIF2D had no effect on their expression status as a result of antipsychotic treatment. Despite the differences in the nature of the study, ethnicity of the population, and the gene expression analysis method used, we identified several coherent observations. An overlap, though limited, of genetic, epigenetic and gene expression changes supports interplay of genetic and environmental factors in SCZ. The studies validate the use of blood as a surrogate tissue for biomarker analysis. We conclude that well-designed cohort studies across diverse populations, use of high-throughput sequencing technology, and use of artificial intelligence (AI) based computational analysis will significantly improve our understanding and diagnostic capabilities for this complex disorder.
Keywords: biomarkers; gene expression; genomics; peripheral blood; schizophrenia.
Copyright © 2021 Wagh, Vyas, Agrawal, Pachpor, Paralikar and Khare.
Conflict of interest statement
The authors declare that the research was conducted in the absence of any commercial or financial relationships that could be construed as a potential conflict of interest.
Figures
References
-
- American Psychiatric Association (2013). Diagnostic and Statistical Manual of Mental Disorders. (5th ed.). Philadelpia: American Psychiatric Publishing. 10.1176/appi.books.9780890425596 - DOI
-
- Andreasen N. C., Ehrhardt J. C., Swayze V. W., Alliger R. J., Yuh W. T. C., Cohen G., et al. . (1990). Magnetic resonance imaging of the brain in schizophrenia: the pathophysiologic significance of structural abnormalities. Arch. Gen. Psychiatry 47, 35–44. 10.1001/archpsyc.1990.01810130037006 - DOI - PubMed
Publication types
LinkOut - more resources
Full Text Sources
Research Materials
Miscellaneous