Review
. 2021 Oct 15:12:751033.
doi: 10.3389/fgene.2021.751033. eCollection 2021.

A Systematic Review of Transcriptional Dysregulation in Huntington's Disease Studied by RNA Sequencing

Affiliations
Review

A Systematic Review of Transcriptional Dysregulation in Huntington's Disease Studied by RNA Sequencing

Bimala Malla et al. Front Genet. .

Abstract

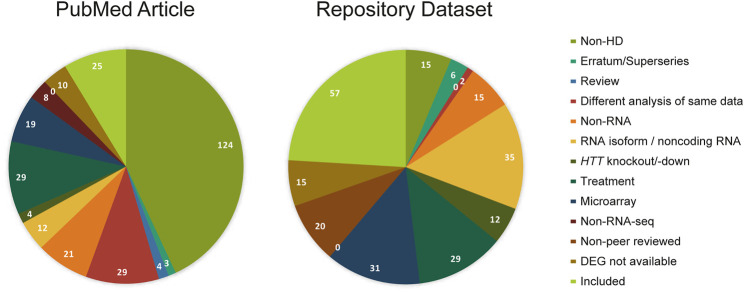
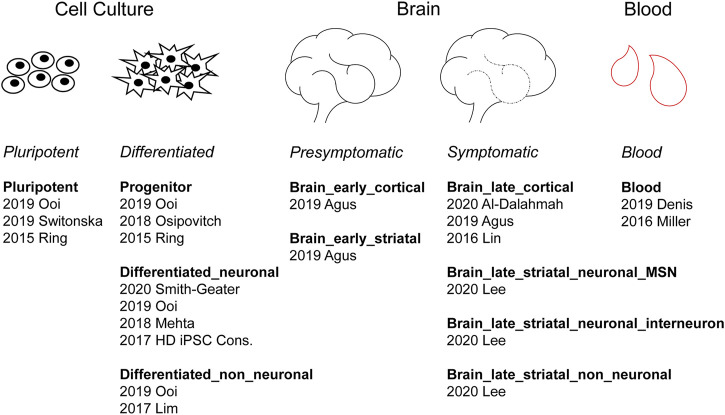
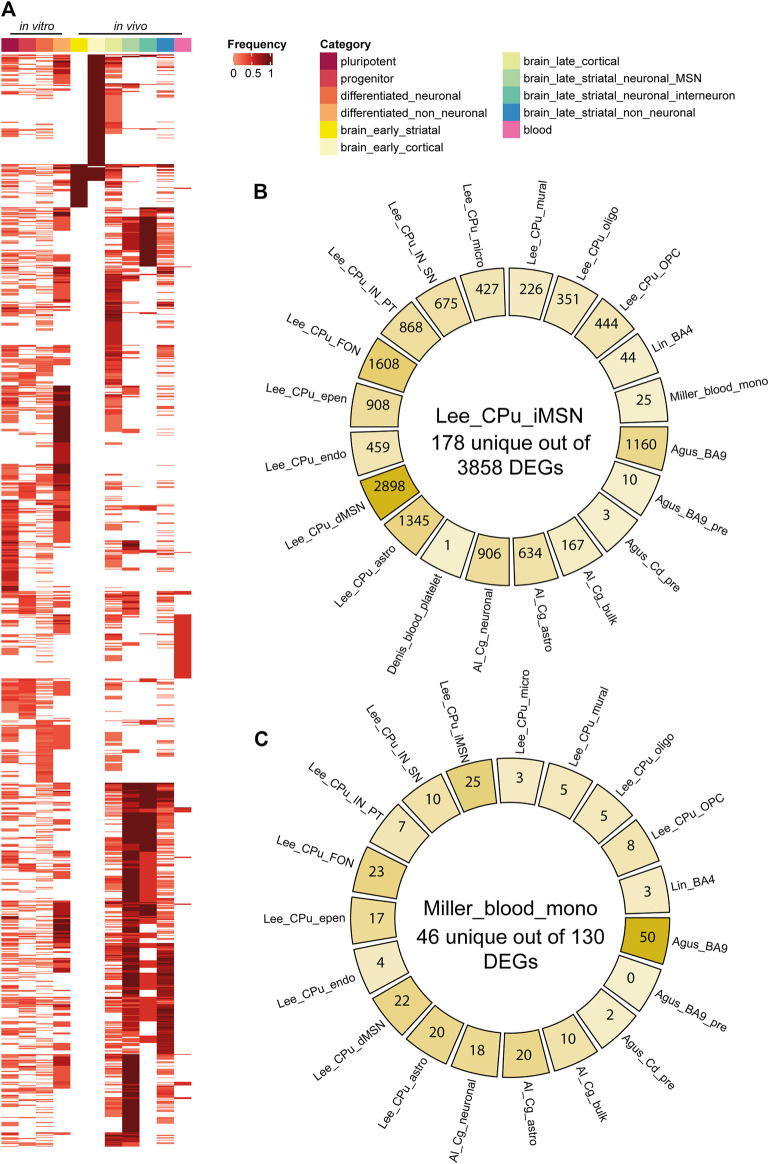
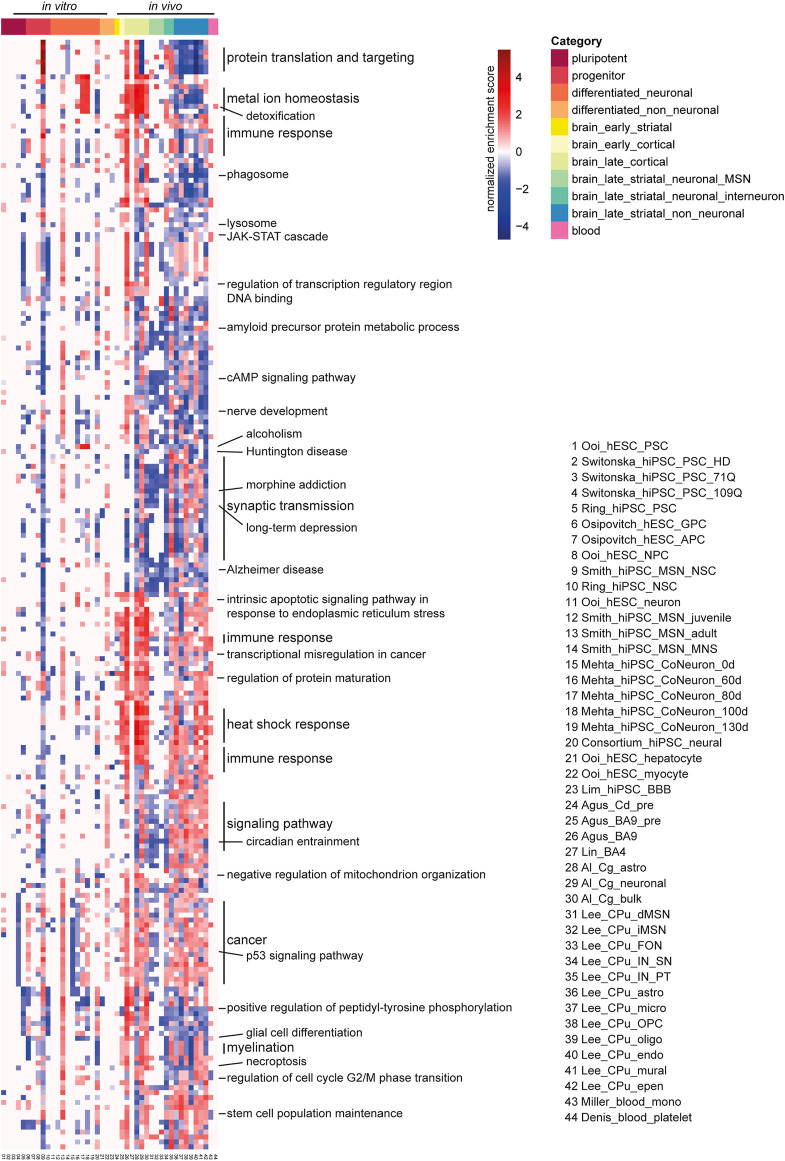
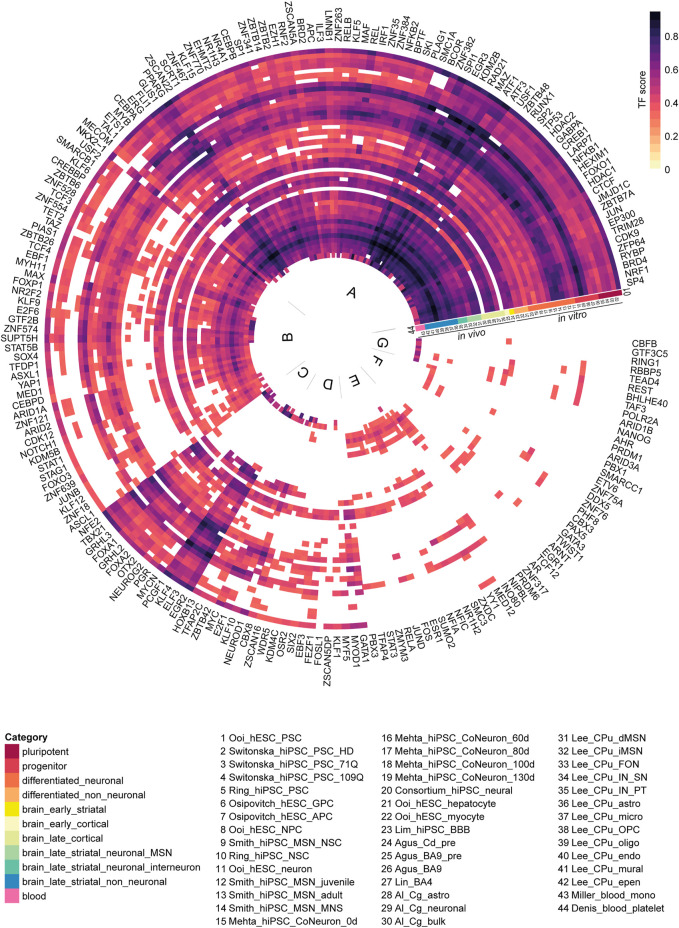
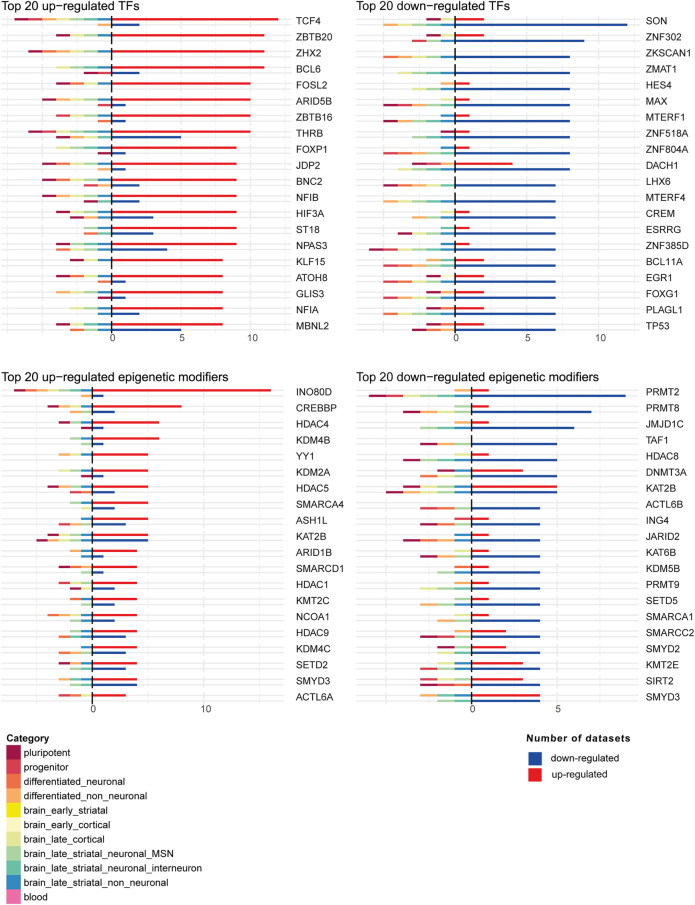
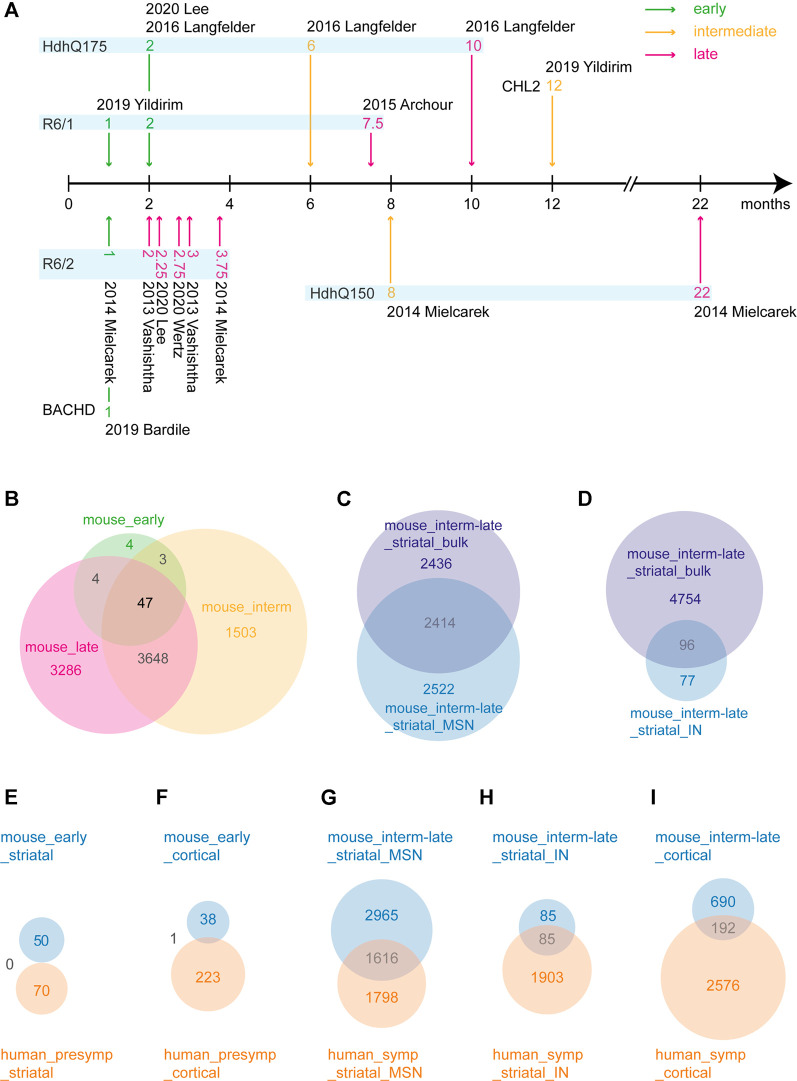
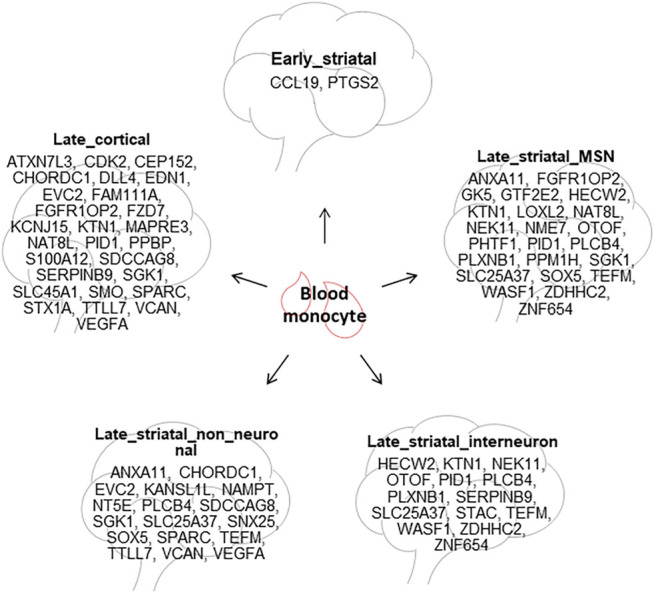
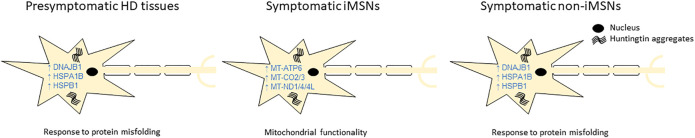
Huntington's disease (HD) is a chronic neurodegenerative disorder caused by an expansion of polyglutamine repeats in exon 1 of the Huntingtin gene. Transcriptional dysregulation accompanied by epigenetic alterations is an early and central disease mechanism in HD yet, the exact mechanisms and regulators, and their associated gene expression programs remain incompletely understood. This systematic review investigates genome-wide transcriptional studies that were conducted using RNA sequencing (RNA-seq) technology in HD patients and models. The review protocol was registered at the Open Science Framework (OSF). The biomedical literature and gene expression databases, PubMed and NCBI BioProject, Array Express, European Nucleotide Archive (ENA), European Genome-Phenome Archive (EGA), respectively, were searched using the defined terms specified in the protocol following the PRISMA guidelines. We conducted a complete literature and database search to retrieve all RNA-seq-based gene expression studies in HD published until August 2020, retrieving 288 articles and 237 datasets from PubMed and the databases, respectively. A total of 27 studies meeting the eligibility criteria were included in this review. Collectively, comparative analysis of the datasets revealed frequent genes that are consistently dysregulated in HD. In postmortem brains from HD patients, DNAJB1, HSPA1B and HSPB1 genes were commonly upregulated across all brain regions and cell types except for medium spiny neurons (MSNs) at symptomatic disease stage, and HSPH1 and SAT1 genes were altered in expression in all symptomatic brain datasets, indicating early and sustained changes in the expression of genes related to heat shock response as well as response to misfolded proteins. Specifically in indirect pathway medium spiny neurons (iMSNs), mitochondria related genes were among the top uniquely dysregulated genes. Interestingly, blood from HD patients showed commonly differentially expressed genes with a number of brain regions and cells, with the highest number of overlapping genes with MSNs and BA9 region at symptomatic stage. We also found the differential expression and predicted altered activity of a set of transcription factors and epigenetic regulators, including BCL6, EGR1, FOSL2 and CREBBP, HDAC1, KDM4C, respectively, which may underlie the observed transcriptional changes in HD. Altogether, our work provides a complete overview of the transcriptional studies in HD, and by data synthesis, reveals a number of common and unique gene expression and regulatory changes across different cell and tissue types in HD. These changes could elucidate new insights into molecular mechanisms of differential vulnerability in HD. Systematic Review Registration: https://osf.io/pm3wq.

Keywords: RNA sequencing; epigenetic regulators; huntington’s disease; transcription factors; transcriptional dysregulation.


Conflict of interest statement

The authors declare that the research was conducted in the absence of any commercial or financial relationships that could be construed as a potential conflict of interest.

Figures

FIGURE 1
FIGURE 1
Studies screened from PubMed and dataset repositories. PubMed articles and repository datasets are screened with the same exclusion criteria in decreasing order of priority: non-HD, erratum (Pubmed)/superserie entries (repository dataset), review, different analysis of same data, non-RNA, RNA isoform/noncoding RNA, HTT knockout/down, treatment, microarray, non-RNA-seq, and no DEG analysis. The numbers of PubMed articles or repository datasets in each category are indicated.
FIGURE 2
FIGURE 2
Categorization of human HD differentially expressed gene (DEG) datasets. According to the sample source, human HD studies can be divided into three groups: cell culture, brain and blood. Cell culture studies can be further divided into pluripotent and differentiated subgroups. Brain studies can be divided into presymptomatic and symptomatic subgroups. Under each subheading are listed the respective studies identified by their publication year and the last name of the first author.
FIGURE 3
FIGURE 3
HD differentially expressed gene (DEG) comparisons between categories and datasets. (A) DEG Frequency heatmap across all subcategories. Each column is a subcategory, each row is a DEG. DEG frequency is calculated as the number of datasets that DEG appears in divided by the total number of datasets in that subcategory. (B,C) Diagrams for pairwise comparisons of indirect pathway medium spiny neuron (iMSN) or blood monocyte DEG list vs all other data from primary tissues/cells. At the center is the number of unique DEGs in iMSN or blood monocyte, and on the side is the number of DEGs in common with other datasets. Abbreviations: CPu, caudate putamen; astro, astrocyte; epen, ependymal; endo, endothelial; IN, interneuron; PT, Pvalb/Th-expressing; MSN, medium spiny neuron; MNS, MAP2+ and NES/SOX2-; OPC, oligodendrocyte progenitor cell; oligo, oligodendrocyte; micro, microglia; NSC, neural stem cell; Cg, cingulate cortex; FON, Foxp2/Olfm3-expressing neuron; SN, Sst/Npy-expressing; dSPN/iSPN, direct/indirect pathway spiny projection neuron; mono, monocyte; NPC, neural progenitor cell; CoNeuron, cortical neuron; Cd, caudate nucleus; pre, presymptomatic; GPC, glial progenitor cell; APC, astrocyte precursor cell; BBB, blood brain barrier.
FIGURE 4
FIGURE 4
Gene set enrichment analysis (GSEA) enrichment heatmap of 44 human HD RNA-seq datasets. Top 20 enriched gene sets for the GO biological process and KEGG pathway were combined and shown here. Each column is a human HD RNA-seq DEG dataset, each row is a gene set of the GO biological process or KEGG pathway. Adjacent gene sets with a common biological function are grouped and labeled as such. Red indicates positive enrichment, blue negative. Abbreviations: CPu, caudate putamen; astro, astrocyte; epen, ependymal; endo, endothelial; IN, interneuron; PT, Pvalb/Th-expressing; MSN, medium spiny neuron; MNS, MAP2+ and NES/SOX2-; OPC, oligodendrocyte progenitor cell; oligo, oligodendrocyte; micro, microglia; NSC, neural stem cell; Cg, cingulate cortex; FON, Foxp2/Olfm3-expressing neuron; SN, Sst/Npy-expressing; dSPN/iSPN, direct/indirect pathway spiny projection neuron; mono, monocyte; NPC, neural progenitor cell; CoNeuron, cortical neuron; Cd, caudate nucleus; pre, presymptomatic; GPC, glial progenitor cell; APC, astrocyte precursor cell; BBB, blood brain barrier.
FIGURE 5
FIGURE 5
Potential enriched regulators for all 44 human differentially expressed gene (DEG) datasets. Each ring is a human DEG dataset, each spoke is a regulator. The regulator activity score was defined as the ratio of DEGs controlled by a regulator to the total number of DEGs in a dataset. For each dataset, regulators with an activity score higher than 0.3 were shown (n = 205). The regulators were clustered using the Ward D2 method. Based on commonality in the 44 human DEG datasets, regulators can be divided into 7 groups (A to G). Abbreviations: CPu, caudate putamen; astro, astrocyte; epen, ependymal; endo, endothelial; IN, interneuron; PT, Pvalb/Th-expressing; MSN, medium spiny neuron; MNS, MAP2+ and NES/SOX2-; OPC, oligodendrocyte progenitor cell; oligo, oligodendrocyte; micro, microglia; NSC, neural stem cell; Cg, cingulate cortex; FON, Foxp2/Olfm3-expressing neuron; SN, Sst/Npy-expressing; dSPN/iSPN, direct/indirect pathway spiny projection neuron; mono, monocyte; NPC, neural progenitor cell; CoNeuron, cortical neuron; Cd, caudate nucleus; pre, presymptomatic; GPC, glial progenitor cell; APC, astrocyte precursor cell; BBB, blood brain barrier.
FIGURE 6
FIGURE 6
Top 20 up-regulated and down-regulated transcription factors (TFs) and epigenetic modifiers in the 44 human DEG datasets. For each TF or epigenetic modifier, shown were the numbers of datasets where the TF or epigenetic modifier was up-regulated or down-regulated. On the positive axis, the number of datasets in which the TF or epigenetic modifier is up-regulated or down-regulated are shown. On the negative axis, the category membership of the datasets where the TF or epigenetic modifier is up-regulated or down-regulated is indicated.
FIGURE 7
FIGURE 7
Differentially expressed gene (DEG) analysis and overlap between mouse and human datasets. (A) HD mouse model disease progression timeline. Based on existing literature, timepoints from HD models are categorized as early, intermediate and late disease stage. (B) Venn diagram of DEG overlap between mouse early, intermediate and late categories. (C) Venn diagram of DEG overlap between mouse intermediate/late bulk striata and mouse intermediate/late striatal medium spiny neurons. (D) Venn diagram of DEG overlap between mouse intermediate/late bulk striata and mouse intermediate/late striatal interneurons. (E–I) Corresponding cell types and disease stages between human and mouse categories were compared. Blue denotes mouse categories; orange denotes human categories.
FIGURE 8
FIGURE 8
Potential blood biomarkers for HD. The common DEGs between HD blood monocytes and different HD brain tissues are summarized.
FIGURE 9
FIGURE 9
Key differentially expressed genes (DEGs) and pathways potentially responsible for HD pathology. The diagram summarizes the key DEGs and pathways generated from data synthesis, which may explain the differential vulnerability of indirect pathway medium spiny neurons (iMSNs) compared to other cell types in brain.

References

    1. Achour M., Le Gras S., Keime C., Parmentier F., Lejeune F.-X., Boutillier A.-L., et al. (2015). Neuronal Identity Genes Regulated by Super-enhancers Are Preferentially Down-Regulated in the Striatum of Huntington's Disease Mice. Hum. Mol. Genet. 24, 3481–3496. 10.1093/hmg/ddv099 - DOI - PubMed
    1. Agus F., Crespo D., Myers R. H., Labadorf A. (2019). The Caudate Nucleus Undergoes Dramatic and Unique Transcriptional Changes in Human Prodromal Huntington's Disease Brain. BMC Med. Genom. 12, 137. 10.1186/s12920-019-0581-9 - DOI - PMC - PubMed
    1. Al-Dalahmah O., Sosunov A. A., Shaik A., Ofori K., Liu Y., Vonsattel J. P., et al. (2020). Single-nucleus RNA-Seq Identifies Huntington Disease Astrocyte States. Acta Neuropathol. Commun. 8, 19. 10.1186/s40478-020-0880-6 - DOI - PMC - PubMed
    1. Anderson K. E., van Duijn E., Craufurd D., Drazinic C., Edmondson M., Goodman N., et al. (2018). Clinical Management of Neuropsychiatric Symptoms of Huntington Disease: Expert-Based Consensus Guidelines on Agitation, Anxiety, Apathy, Psychosis and Sleep Disorders. J. Huntingtons Dis. 7, 355–366. 10.3233/jhd-180293 - DOI - PMC - PubMed
    1. Borovecki F., Lovrecic L., Zhou J., Jeong H., Then F., Rosas H. D., et al. (2005). Genome-wide Expression Profiling of Human Blood Reveals Biomarkers for Huntington's Disease. Proc. Natl. Acad. Sci. 102, 11023–11028. 10.1073/pnas.0504921102 - DOI - PMC - PubMed