. 2021 Oct 14:12:753953.
doi: 10.3389/fgene.2021.753953. eCollection 2021.

Pumpkin (Cucurbita moschata) HSP20 Gene Family Identification and Expression Under Heat Stress

Affiliations

Pumpkin (Cucurbita moschata) HSP20 Gene Family Identification and Expression Under Heat Stress

Yanping Hu et al. Front Genet. .

Abstract

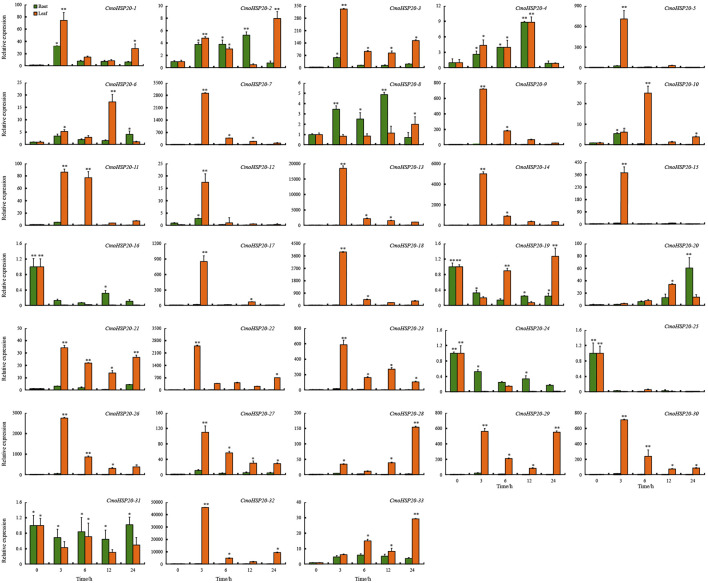
Pumpkin (Cucurbita moschata) is an important cucurbit vegetable crop that has strong resistance to abiotic stress. While heat shock protein 20 (HSP20) has been implicated in vegetable response to heat stress, little is known regarding activity of HSP20 family proteins in C. moschata. Here, we performed a comprehensive genome-wide analysis to identify and characterize the functional dynamics of the Cucurbita moschata HSP20 (CmoHSP20) gene family. A total of 33 HSP20 genes distributed across 13 chromosomes were identified from the pumpkin genome. Our phylogenetic analysis determined that the CmoHSP20 proteins fell into nine distinct subfamilies, a division supported by the conserved motif composition and gene structure analyses. Segmental duplication events were shown to play a key role in expansion of the CmoHSP20 gene family. Synteny analysis revealed that 19 and 18 CmoHSP20 genes were collinear with those in the cucumber and melon genomes, respectively. Furthermore, the expression levels of pumpkin HSP20 genes were differentially induced by heat stress. The transcript level of CmoHSP20-16, 24 and 25 were down-regulated by heat stress, while CmoHSP20-7, 13, 18, 22, 26 and 32 were up-regulated by heat stress, which could be used as heat tolerance candidate genes. Overall, these findings contribute to our understanding of vegetable HSP20 family genes and provide valuable information that can be used to breed heat stress resistance in cucurbit vegetable crops.

Keywords: Cucurbita moschata; gene expression; gene family; heat shock protein 20; heat stress.


Conflict of interest statement

The authors declare that the research was conducted in the absence of any commercial or financial relationships that could be construed as a potential conflict of interest.

Figures

FIGURE 1
FIGURE 1
Phylogenetic analyses of HSP20s proteins from Cucurbita moschata, Arabidopsis and Oryza sativa. A phylogenetic tree of HSP2 proteins was constructed using MEGA-X software. The 10 subgroups are indicated with different colors. The red triangles represent Cucurbita moschata HSP20s (CmoHSP20s), the green stars represent Arabidopsis thaliana HSP20s (AtHSP20s), and the black circles represent Oryza sativa HSP20s (OsHSP20s).
FIGURE 2
FIGURE 2
Phylogenetic relationships, structures, and motifs of CmoHSP20 family members. (A) A phylogenetic tree of 33 CmoHSP20 proteins constructed using Maximum Likelihood methods. The different subgroups are indicated with different background colors and letters. (B) Conserved motifs of CmoHSP20 proteins. Different motifs are represented by colored boxes and different numbers. (C) Exon/intron structures of CmoHSP20 genes. Exons, introns, and UTRs are represented by green boxes, black lines, and yellow boxes, respectively. The phylogenetic tree, conserved motifs, and gene structures were predicted with TBtools.
FIGURE 3
FIGURE 3
Alignments the ACDs of CmoHSP20s. (A) Alignment of the ACD from the MEME results for the CmoHSP20. The motif 2, 3, 1, and 5 formed the putative CmoHSP20 ACD, and the HMM logo from Pfam representing the HSP20 domain (PF00011). The red amino acids represent matches between the MEME motifs and HMM sequences. (B) Alignment of the ACDs of CmoHSP20s from Cucurbita moschata. Names of all gene members are shown on the left side of the figure. The primary structure of the ACD, including the conserved regions I (CRI), II (CRII), and β6-loop, is shown at the bottom of the figure.
FIGURE 4
FIGURE 4
The cartoon representation of the predicted 3-dimensional structural models of CmoHSP20 proteins. The capital letter (A to H) represents the different types.
FIGURE 5
FIGURE 5
Chromosomal location and gene duplication events in CmoHSP20s. The chromosome number is listed at the top of each chromosome while the number to the left of each chromosome represents the location of the CmoHSP20 gene on the right. Only the chromosomes where CmoHSP20 genes were mapped are shown. The tandem duplicated genes are marked by grey rectangles and the segmental duplicated genes are linked by colored dotted lines.
FIGURE 6
FIGURE 6
Synteny analyses of HSP20 genes between Cucurbita moschata and four other representative plant species (Arabidopsis thaliana, Oryza sativa, Cucumis sativu and Cucumis melo). (A) C. moschata and A. thaliana. (B) C. moschata and O. sativa. (C) C. moschata and Cucumis sativu. (D) C. moschata and Cucumis melo. Gray lines indicate significantly collinear blocks within and among plant genomes, while red lines highlight syntenic HSP20 gene pairs. The chromosome number is indicated at the top of each chromosome.
FIGURE 7
FIGURE 7
Cis-elements analysis of the CmoHSP20 genes promoter regions. (A) The different colors and numbers indicated the numbers of different promoter elements in the CmoHSP20 genes. (B) Colored blocks represent the different types of cis-elements and their locations in each CmoHSP20 gene. The types, numbers, and locations of potential elements in the promoter regions 1.5-kb upstream of the CmoHSP20 genes were determined using PlantCARE software.
FIGURE 8
FIGURE 8
Expression analyses of the Cucurbita moschata CmoHSP20 genes in response to heat stress using qRT-PCR. The mean expression value was calculated from three replicates. Vertical bars indicate the standard deviation. Values of 0, 3, 6, 12, and 24 indicate hours after treatment. Mean values and standard deviations are calculated according the data. Asterisk (∗ or ∗∗) indicate a significant difference at p < 0.05 or 0.01, respectively.

References

    1. Aghdam M. S., Sevillano L., Flores F. B., Bodbodak S. (2013). Heat Shock Proteins as Biochemical Markers for Postharvest Chilling Stress in Fruits and Vegetables. Scientia Horticult. 160, 54–64. 10.1016/j.scienta.2013.05.020 - DOI
    1. Basha E., Friedrich K. L., Vierling E. (2006). The N-Terminal Arm of Small Heat Shock Proteins Is Important for Both Chaperone Activity and Substrate Specificity. J. Biol. Chem. 281 (52), 39943–39952. 10.1074/jbc.M607677200 - DOI - PubMed
    1. Basha E., O’Neill H., Vierling E. (2012). Small Heat Shock Proteins and α-crystallins: Dynamic Proteins with Flexible Functions. Trends Biochem. Sci. 37, 106–117. 10.1016/j.tibs.2011.11.005 - DOI - PMC - PubMed
    1. Bondino H. G., Valle E. M., ten Have A. (2012). Evolution and Functional Diversification of the Small Heat Shock Protein/α-Crystallin Family in Higher Plants. Planta 235 (6), 1299–1313. 10.1007/s00425-011-1575-9 - DOI - PubMed
    1. Cannon S. B., Mitra A., Baumgarten A., Young N. D., May G. (2004). The Roles of Segmental and Tandem Gene Duplication in the Evolution of Large Gene Families in Arabidopsis thaliana . BMC Plant Biol. 4, 10. 10.1186/1471-2229-4-10 - DOI - PMC - PubMed

LinkOut - more resources