

Testis development in the Japanese eel is affected by photic signals through melatonin secretion
- PMID: 34721978
- PMCID: PMC8522646
- DOI: 10.7717/peerj.12289
Testis development in the Japanese eel is affected by photic signals through melatonin secretion
Abstract
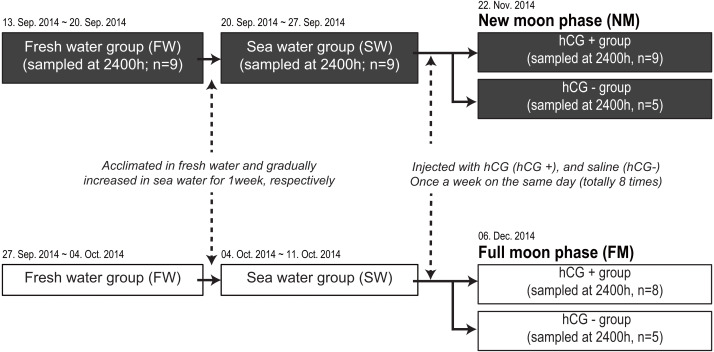
Objective: According to reported spawning characteristics of Japanese eel, Anguilla japonica, which exhibit spawning and migration patterns that are synchronized with lunar cycles and photoperiod, we hypothesized that a close association exists between specific photic signals (daylight, daylength, and moonlight) and endocrinological regulation. Given the photic control in melatonin secretion, this hypothesis was tested by investigating whether melatonin signals act as mediators relaying photic signals during testis development in the eel.
Methods: We examined changes in melatonin-secretion patterns using time-resolved fluorescence immunoassays in sexually immature and mature male Japanese eels under the condition of a new moon (NM) and a full moon (FM).
Results: The eye and plasma melatonin levels exhibited a nocturnal pattern under a 12-h light: dark cycle (12L12D) or under constant darkness (DD), but not with constant light (LL). Eye melatonin levels were similar under the 12L12D and short-day (9L15D) conditions. In the long-day condition (15L9D), secreted plasma melatonin levels were stable, whereas short-day melatonin secretion began when darkness commenced. Sexual maturation began at 8 weeks following intraperitoneal injection of human chorionic gonadotropin (hCG), and NM exposure led to significantly higher eye and plasma melatonin levels compared with those detected under FM exposure.
Keywords: Eel migration; Japanese eel; Melatonin; Moonlight; Photic signal; Photoperiod.
©2021 Hyeon et al.
Conflict of interest statement
The authors declare there are no competing interests.
Figures


Similar articles
-
Clock Gene Expression in Eel Retina and Hypothalamus: Response to Photoperiod and Moonlight.J Exp Zool A Ecol Integr Physiol. 2025 Jan;343(1):81-94. doi: 10.1002/jez.2870. Epub 2024 Oct 7. J Exp Zool A Ecol Integr Physiol. 2025. PMID: 39375903 Free PMC article.
-
Effects of moonlight exposure on plasma melatonin rhythms in the seagrass rabbitfish, Siganus canaliculatus.J Biol Rhythms. 2004 Aug;19(4):325-34. doi: 10.1177/0748730404266712. J Biol Rhythms. 2004. PMID: 15245651
-
Perception and possible utilization of moonlight intensity for reproductive activities in a lunar-synchronized spawner, the golden rabbitfish.J Exp Zool A Comp Exp Biol. 2004 Oct 1;301(10):844-51. doi: 10.1002/jez.a.105. J Exp Zool A Comp Exp Biol. 2004. PMID: 15449345
-
Impacts of moonlight on fish reproduction.Mar Genomics. 2014 Apr;14:59-66. doi: 10.1016/j.margen.2013.11.007. Epub 2014 Jan 4. Mar Genomics. 2014. PMID: 24393605 Review.
-
Clock genes and the long-term regulation of prolactin secretion: evidence for a photoperiod/circannual timer in the pars tuberalis.J Neuroendocrinol. 2003 Apr;15(4):390-7. doi: 10.1046/j.1365-2826.2003.00990.x. J Neuroendocrinol. 2003. PMID: 12622839 Review.
Cited by
-
Clock Gene Expression in Eel Retina and Hypothalamus: Response to Photoperiod and Moonlight.J Exp Zool A Ecol Integr Physiol. 2025 Jan;343(1):81-94. doi: 10.1002/jez.2870. Epub 2024 Oct 7. J Exp Zool A Ecol Integr Physiol. 2025. PMID: 39375903 Free PMC article.
References
-
- Aoyama J, Sasai S, Miller MJ, Shinoda A, Nakamura A, Kawazu K, Tsukamoto K. A preliminary study of the movements of yellow and silver eels, Anguilla japonica, in the estuary of the Fukui River, Japan, as revealed by acoustic tracking. Hydrobiologia. 2002;470:31–36. doi: 10.1023/A:1015604906154. - DOI
-
- Baras E, Jeandrain D, Serouge B, Philippart JC. Seasonal variations in time and space utilization by radio-tagged yellow eels Anguilla anguilla (L.) in a small stream. Hydrobiologia. 1998;371:187–198.
-
- Bromage NR, Porter M, Randall C. The environmental regulation of maturation in farmed finfish with special reference to the role of photoperiod and melatonin. Aquaculture. 2001;197:63–98. doi: 10.1016/S0044-8486(01)00583-X. - DOI
LinkOut - more resources
Full Text Sources
