. 2021 Oct 14:9:755729.
doi: 10.3389/fcell.2021.755729. eCollection 2021.

Wnt1 Role in the Development of the Habenula and the Fasciculus Retroflexus

Affiliations

Wnt1 Role in the Development of the Habenula and the Fasciculus Retroflexus

Verónica Company et al. Front Cell Dev Biol. .

Abstract

Wnt1 is one of the morphogenes that controls the specification and differentiation of neuronal populations in the developing central nervous system. The habenula is a diencephalic neuronal complex located in the most dorsal aspect of the thalamic prosomere. This diencephalic neuronal population is involved in the limbic system and its malfunction is related with several psychiatric disorders. Our aim is to elucidate the Wnt1 role in the habenula and its main efferent tract, the fasciculus retroflexus, development. In order to achieve these objectives, we analyzed these structures development in a Wnt1 lack of function mouse model. The habenula was generated in our model, but it presented an enlarged volume. This alteration was due to an increment in habenular neuroblasts proliferation rate. The fasciculus retroflexus also presented a wider and disorganized distribution and a disturbed final trajectory toward its target. The mid-hindbrain territories that the tract must cross were miss-differentiated in our model. The specification of the habenula is Wnt1 independent. Nevertheless, it controls its precursors proliferation rate. Wnt1 expressed in the isthmic organizer is vital to induce the midbrain and rostral hindbrain territories. The alteration of these areas is responsible for the fasciculus retroflexus axons misroute.

Keywords: Wnt1; differentiation; fasciculus retroflexus; habenula; proliferation.


Conflict of interest statement

The authors declare that the research was conducted in the absence of any commercial or financial relationships that could be construed as a potential conflict of interest.

Figures

FIGURE 1
FIGURE 1
Wnt1–/– habenular general phenotype. E18.5 wt (A–C) and E18.5 Wnt1–/– brain sagittal sections (D–F). (A,D) Are stained with cresyl violet, (B,E) are labeled for CNTN2 (as mHb marker), and (C,F) for NFEM (as lHb marker). The tract was thicker (arrows in E,F), and the Hb was larger in the mutant embryo. Five samples of each genotype have been analyzed. fr, fasciculus retroflexus; Hb, habenula; mtg, mamillotegmental tract; mth, mamillothalamic tract; Th, thalamus; ac, anterior commissure; Ip, interpeduncular nucleus; pc, posterior commissure; CV, cresyl violet. Scale bar: 200 μm.
FIGURE 2
FIGURE 2
Medial habenular volumes analysis in Wnt1–/–. Lateral views of E18.5 wt (A) and Wnt1–/– (B) brains analyzing ROBO3 distribution by iDISCO. We can observe the mHB and the initial fr portion. (C) Significance among wt (n = 6) and Wnt1–/– mHb volumes (n = 4) was analyzed by an unpaired t-test. Significant differences were found (*⁣*⁣**< 0.0001), being the mutant mHb volume larger than the wt. fr, fasciculus retroflexus; mHb, medial habenula. Scale bar: 200 μm.
FIGURE 3
FIGURE 3
Analysis of the habenular subnuclei organization. E18.5 wt (A,C,E,G,I) and E18.5 Wnt1–/– (B,D,F,H,J) brain coronal sections. (A,B) labeled by immunohistochemistry against NFEM as lHb marker. (C,D) labeled against CALB, (E,F) DCC, (G,H) CNTN2 and (I,J) SOX1 as mHb markers. Four samples of each genotype have been analyzed. Th, thalamus; sm, stria medullaris; mHbm, medial division of the medial habenula; mHbl, lateral division of the medial habenula; lHbm, medial division of the lateral habenula; lHbl, lateral division of the lateral habenula. Scale bar: 200 μm.
FIGURE 4
FIGURE 4
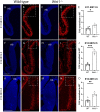
Proliferation analysis. Brain coronal sections at embryonic stages E11.5 (A–D), E12.5 (F–I), and E13.5 (K–N). Pregnant mice were injected with BrdU on the designated day. The embryos were collected 2 h later. Immunofluorescence against BrdU (B,D,G,I,L,N) showed more proliferation in the Wnt1–/– brains than in the wt brains (E,J,O). Significance among wt and Wnt1–/– proliferation was analyzed by an unpaired t-test. Significant differences were found (E < 0.05; J ∗∗∗< 0.001; O ∗∗< 0.01), being proliferation in the mutant higher than in the wt. Four samples of each genotype have been analyzed. Hb, habenula. Scale bar: 200 μm.
FIGURE 5
FIGURE 5
Study of the fr phenotype in Wnt1–/– mutant. E15.5 wt (A) and Wnt1–/– brain sagittal sections (B) stained against CNTN2 (mHb marker; white) and TH (green). DiI (right fr; red) and DiD (left fr; white) labeling and TH immunofluorescence (green) in coronal sections of an E15.5 wt (C,E) and Wnt1–/– mutant brain (D,F) at two different levels. Coronal sections of an E15.5 wt (G) and Wnt1–/– mutant brain (H), stained with NFEM (as lHb marker; red) and CNTN2 (as mHb marker; green). The arrow in (B) indicates the aberrant axonal navigation. The arrow in (D) indicates the abnormal fr shape. The arrow in (F) indicates the abnormal cross of the floor plate. The dashed line labels the mid-hindbrain boundary. Four samples of each genotype have been analyzed. fr, fasciculus retroflexus; lHb lateral habenula; lHb fr, lateral habenular axons of the fasciculus retroflexus; Mes, mesencephalon; mHb, medial habenula; mHb fr, medial habenular axons of the fasciculus retroflexus; Rhomb, rhombencephalon; SNc, substantia nigra pars compacta Th, thalamus; VTA, Ventral tegmental area. Scale bar: 200 μm.
FIGURE 6
FIGURE 6
3D study of the fr and SNc phenotype in Wnt1–/–. Lateral (A,B,E,F) and frontal (C,G,D,H) view of E18.5 wt (A–D) and Wnt1–/– (E–H) brains labeled against TH (white) as SNc marker and ROBO3 (magenta) as mHb marker with iDISCO protocol. These 3D views allowed us to follow the trajectory of the mHb fr tract and its relation with the dopaminergic populations by TH. In the mutant (G,H), we clearly observed the tract trajectory altered (arrows) and a drastic reduction of dopaminergic populations in the mid-diencephalic territory (E,G). Six samples of each genotype have been analyzed. fr, fasciculus retroflexus; mHb, medial habenula; SNc, substantia nigra pars compacta; VTA, ventral tegmental area. Scale bar: 400 μm
FIGURE 7
FIGURE 7
Study of the altered territories in the Wnt1–/– fr pathway. (A,B) Fgf8 in situ hybridization. Arrow in (B) shows a reduction of Fgf8 expression in the mutant. (C,D) Immunofluorescence against TH and NTN1 in coronal sections of E15.5 brains. Arrows in (C,D) indicates the alterations observed in the mutant (NTN1 and TH+ cells reduction). (E–H) Sagittal sections of E15.5 brains, (E,G) Cresyl Violet staining, and (F,H) immunohistochemistry against CNTN2 (arrows in F,H indicate the interpeduncular nucleus). Three samples of each genotype have been analyzed. ANR, anterior neural ridge; Mb, midbrain; IsO, isthmic organizer; Rhomb, rhombencephalon; VTA, ventral tegmental area; SNc, substantia nigra pars compacta; Ip, interpeduncular nucleus; CV, Cresyl Violet. Scale bar: 200 μm.

Similar articles

Cited by

References

    1. Agetsuma M., Aizawa H., Aoki T., Nakayama R., Takahoko M., Goto M., et al. (2010). The habenula is crucial for experience-dependent modification of fear responses in zebrafish. Nat. Neurosci. 13 1354–1356. 10.1038/nn.2654 - DOI - PubMed
    1. Aizawa H., Amo R., Okamoto H. (2011). Phylogeny and ontogeny of the habenular structure. Front. Neurosci. 5:138. 10.3389/fnins.2011.00138 - DOI - PMC - PubMed
    1. Amo R., Fredes F., Kinoshita M., Aoki R., Aizawa H., Agetsuma M., et al. (2014). The habenulo-raphe serotonergic circuit encodes an aversive expectation value essential for adaptive active avoidance of danger. Neuron 84 1034–1048. 10.1016/J.NEURON.2014.10.035 - DOI - PubMed
    1. Andres K., Von Düring M., Veh R. (1999). Subnuclear organization of the rathabenular complexes. J. Comp. Neurol. 407 130–150. 10.1002/(sici)1096-9861(19990428)407:1<130::aid-cne10<3.0.co;2-8 - DOI - PubMed
    1. Barth K. A., Kishimoto Y., Rohr K. B., Seydler C., Schulte-Merker S., Wilson S. W. (1999). Bmp activity establishes a gradient of positional information throughout the entire neural plate. Development 126 4977–4987. - PubMed