. 2021 Oct 13:8:708096.
doi: 10.3389/fnut.2021.708096. eCollection 2021.

Lactobacillus plantarum TWK10 Attenuates Aging-Associated Muscle Weakness, Bone Loss, and Cognitive Impairment by Modulating the Gut Microbiome in Mice

Affiliations

Lactobacillus plantarum TWK10 Attenuates Aging-Associated Muscle Weakness, Bone Loss, and Cognitive Impairment by Modulating the Gut Microbiome in Mice

Chia-Chia Lee et al. Front Nutr. .

Abstract

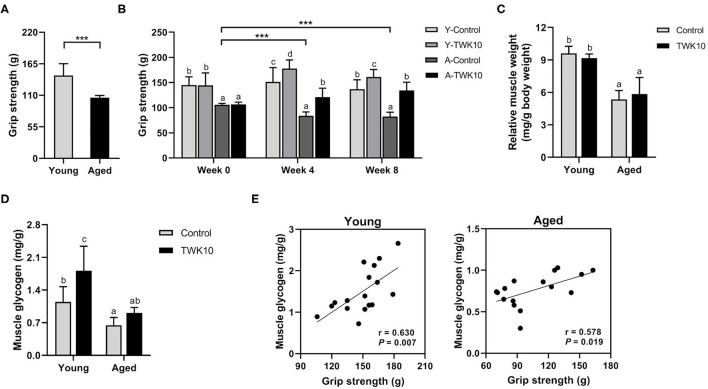
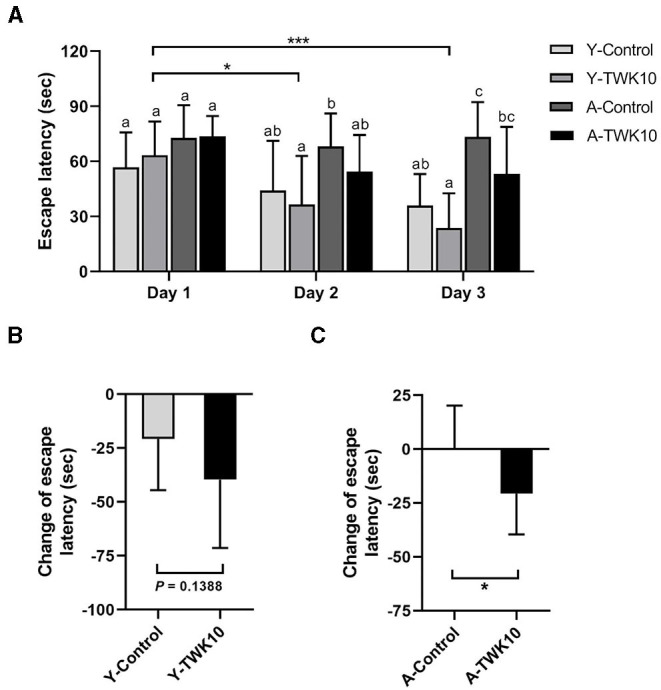
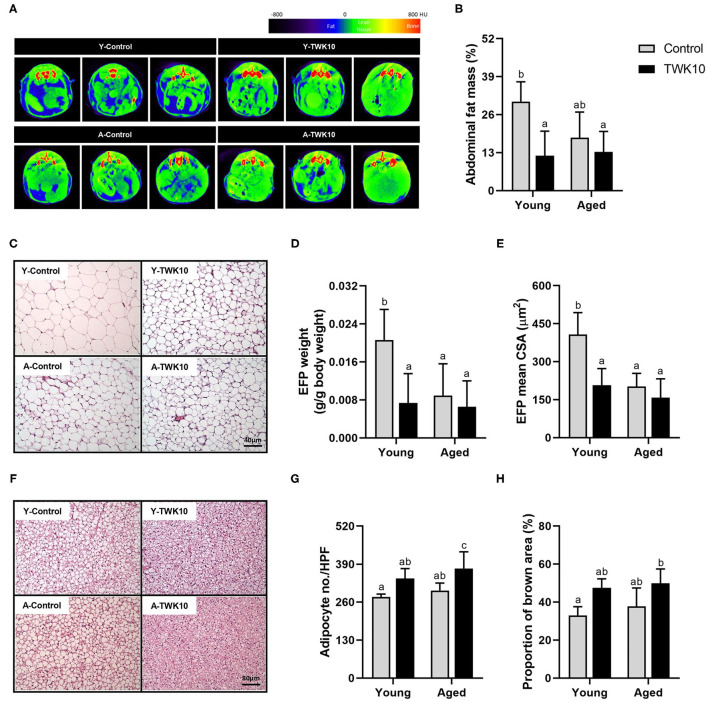
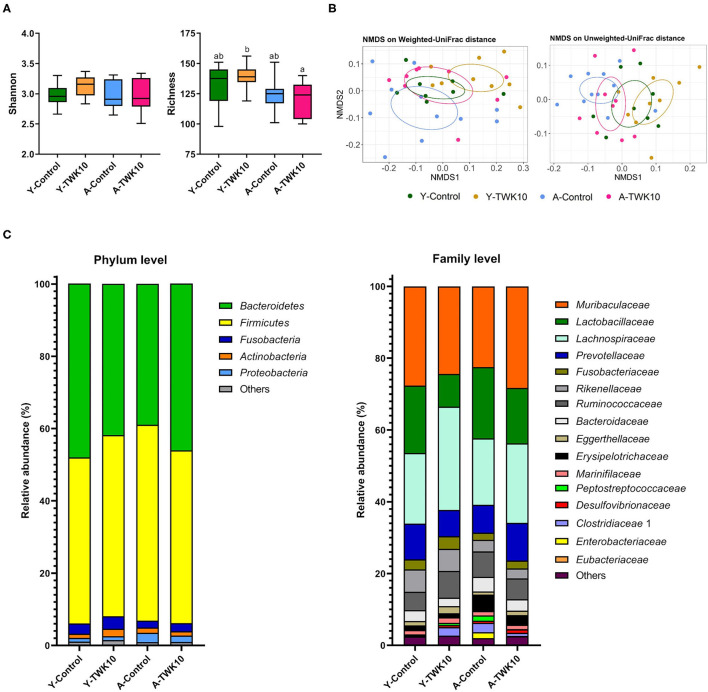
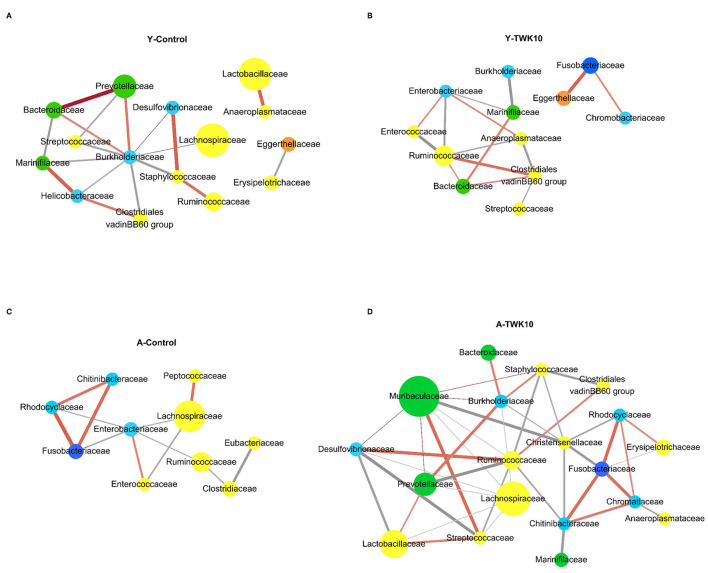
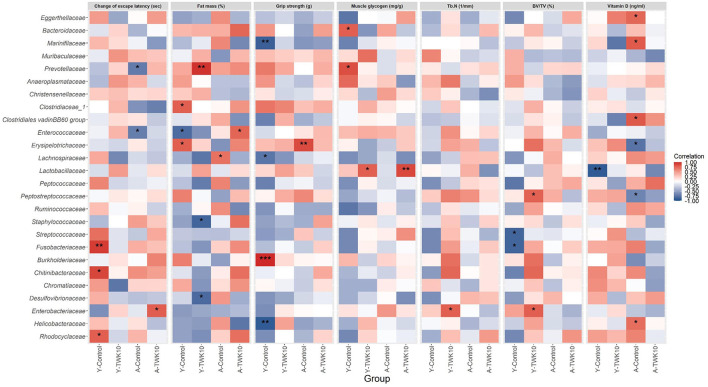
In humans, aging is characterized by the progressive decline in biological, physiological, and psychological functions, and is a major risk factor in the development of chronic diseases. Therefore, the development of strategies aimed at attenuating aging-related disorders and promoting healthy aging is critical. In a previous study, we have demonstrated that Lactobacillus plantarum TWK10 (TWK10), a probiotic strain isolated from Taiwanese pickled cabbage, improved muscle strength, exercise endurance, and overall body composition in healthy humans. In this study, the effect of TWK10 on the progression of age-related impairments was investigated in mice. We found that TWK10 not only enhanced muscle strength in young mice, but also prevented the aging-related loss of muscle strength in aged mice, which was accompanied by elevated muscle glycogen levels. Furthermore, TWK10 attenuated the aging-associated decline in learning and memory abilities, as well as bone mass. Further analyses of gut microbiota using next-generation sequencing (NGS) of the 16S rRNA gene showed that the pattern of gut microbial composition was clearly altered following 8 weeks of TWK10 administration. TWK10-treated mice also experienced an increase in short-chain fatty acid (SCFA)-producing bacteria and higher overall levels of gut SCFA. Furthermore, TWK10 administration to some extent reversed the aging-associated accumulation of pathogenic bacterial taxa. In conclusion, TWK10 could be viewed as a potential therapeutic agent that attenuates aging-related disorders and provides health benefits by modulating the imbalance of gut microbiota.

Keywords: Lactobacillus plantarum TWK10; aging; gut microbiota; memory; muscle; osteoporosis; sarcopenia.


Conflict of interest statement

C-CL, Y-CL, H-YH, S-YC, S-LY, J-SL, and KW are employed by SYNBIO TECH INC. The remaining authors declare that the research was conducted in the absence of any commercial or financial relationships that could be construed as a potential conflict of interest.

Figures

Figure 1
Figure 1
Lactobacillus plantarum TWK10 attenuated the age-related decline in skeletal muscle strength by improving muscle quality. (A) Forelimb grip strength of young (n = 17) and aged mice (n = 16) was measured before administration. (B) Mice were treated with Lactobacillus plantarum TWK10 or PBS for 8 weeks, and forelimb grip strength was measured at week 0, week 4, and week 8. (C,D) Gastrocnemius muscles were harvested and subjected to measurements of muscle wet weight and glycogen levels. Data are represented as mean ± SD. Statistical differences among groups were analyzed by two-way ANOVA with the post-hoc Tukey-Kramer test. Different letters (a, b, c) indicate significant differences among groups, P < 0.05. Two group comparison was analyzed using the unpaired Student t-test. ***P < 0.001. (E) Pearson's correlation, after 8 weeks of TWK10/PBS administration, between grip strength and muscle glycogen levels in the young and aged mice.
Figure 2
Figure 2
The decline in spatial learning and memory was attenuated by Lactobacillus plantarum TWK10. Spatial learning and memory ability were evaluated using the Morris Water Maze after 8 weeks of TWK10 or PBS administration. (A) Mean escape latency to the platform were recorded during trial days 1, 2, and 3. (B,C) The differences in escape latency between day 1 and day 3 were examined in young and aged mice. Data are represented as mean ± SD. Statistical differences among groups in mean escape latency during the trial days were statistically analyzed by two-way ANOVA with the post-hoc Tukey-Kramer test. Different letters (a, b, c) indicate significant differences among the groups, P < 0.05. Two group comparison was analyzed using the unpaired Student t-test. ***P < 0.001. The differences in delta time of escape latency between the Control and TWK10-administered groups were analyzed using the Mann-Whitney U-test. *P < 0.05.
Figure 3
Figure 3
The impact of Lactobacillus plantarum TWK10 on body fat regulation. (A) Representative micro-CT images showing abdominal region composition. (B) Quantification of fat mass at abdominal regions L1 to L5 after 8 weeks of PBS or TWK10 treatment. Epididymal fat pad (EFP) and interscapular brown adipose tissue (BAT) were harvested after 8 weeks of TWK10/PBS administration, and subjected to histological analysis. (C) Representative images of EFP obtained by hematoxylin and eosin (H&E) staining. (D,E) Measurements of EFP wet weight, and the mean cross-section area of EFP adipocytes. (F) Representative images of BAT obtained by H&E staining. (G) Quantification of BAT adipocyte number per high-power-field (HPF). (H) Quantification of BAT brown area after H&E staining. Data are represented as mean ± SD. Statistical differences among groups were analyzed by two-way ANOVA with the post-hoc Tukey-Kramer test and different letters (a, b, c) indicate significant differences, P < 0.05. Non-parametric data were statistically analyzed by Kruskal-Wallis test with Dunn's test.
Figure 4
Figure 4
Modulation of gut microbial composition by Lactobacillus plantarum TWK10. Gut microbiota signatures were expressed in terms of (A) Alpha-diversity (Shannon and Richness indices). The box plots show the smallest and largest values, 25 and 75% quartiles and the median, (B) Beta-diversity represented by non-metric multidimensional scaling (NMDS) plots based on weighted and unweighted UniFrac distances, and (C) Cumulative bar chart of average relative abundance of bacterial taxa at phylum and family levels. Statistical differences among groups were analyzed by two-way ANOVA with post-hoc Tukey-Kramer test, and different letters (a, b, c) indicate significant differences between the groups, P < 0.05. Non-parametric data were statistically analyzed by Kruskal-Wallis test with Dunn's test.
Figure 5
Figure 5
Co-occurrence network analysis of the gut microbiota. Co-occurrence networks were performed at the family level on the basis of relative abundances in the (A) young control mice (Y-Control), (B) young TWK10-treated mice (Y-TWK10), (C) aged control mice (A-Control), and (D) aged TWK10-treated mice (A-TWK10). A connection indicated a strong (SParCC's rho cut-off = 0.6) and significant (P < 0.01) correlation. Each node represents a family and is colored according to its phylum; yellow: Firmicutes, green: Bacteroidetes, light blue: Proteobacteria, dark blue: Fusobacteria, orange: Actinobacteria. The node size represents the relative abundance of each family (if >1%) in each group. Each edge represents a positive correlation (orange red line) or a negative correlation (gray line) between the two families with a SparCC's correlation coefficient of ±0.6, and edge shading indicating correlation magnitude.
Figure 6
Figure 6
Heatmap of Spearman's correlation analysis between the gut microbiota and the altered age-related host phenotypic features. Spearman's correlation analysis was performed to investigate the correlations between the relative abundances of 26 major families and the values of seven altered aged-related host phenotypic features selected from the differential analysis between Y-Control and Y-TWK10 or A-Control and A-TWK10 groups. Red squares indicate positive correlations and blue squares indicate negative correlations. *P < 0.05, **P < 0.01, ***P < 0.001.

References

    1. Kennedy BK, Berger SL, Brunet A, Campisi J, Cuervo AM, Epel ES, et al. . Aging: a common driver of chronic diseases and a target for novel interventions. Cell. (2014) 159:709–13. 10.1016/j.cell.2014.10.039 - DOI - PMC - PubMed
    1. Marzetti E, Leeuwenburgh C. Skeletal muscle apoptosis, sarcopenia and frailty at old age. Exp Gerontol. (2006) 41:1234–8. 10.1016/j.exger.2006.08.011 - DOI - PubMed
    1. Siparsky PN, Kirkendall DT, Garrett WE. Muscle changes in aging: understanding sarcopenia. Sports Health. (2014) 6:36–40. 10.1177/1941738113502296 - DOI - PMC - PubMed
    1. Melton LJ, Khosla S, Crowson CS, O'Connor MK, O'Fallon WM, Riggs BL. Epidemiology of sarcopenia. J Am Geriatr Soc. (2000) 48:625–30. 10.1111/j.1532-5415.2000.tb04719.x - DOI - PubMed
    1. Després JP. Body fat distribution and risk of cardiovascular disease: an update. Circulation. (2012) 126:1301–13. 10.1161/CIRCULATIONAHA.111.067264 - DOI - PubMed

LinkOut - more resources