. 2021 Oct 14:8:764135.
doi: 10.3389/fvets.2021.764135. eCollection 2021.

Multi-Omics Analysis of Mammary Metabolic Changes in Dairy Cows Exposed to Hypoxia

Affiliations

Multi-Omics Analysis of Mammary Metabolic Changes in Dairy Cows Exposed to Hypoxia

Zhiwei Kong et al. Front Vet Sci. .

Abstract

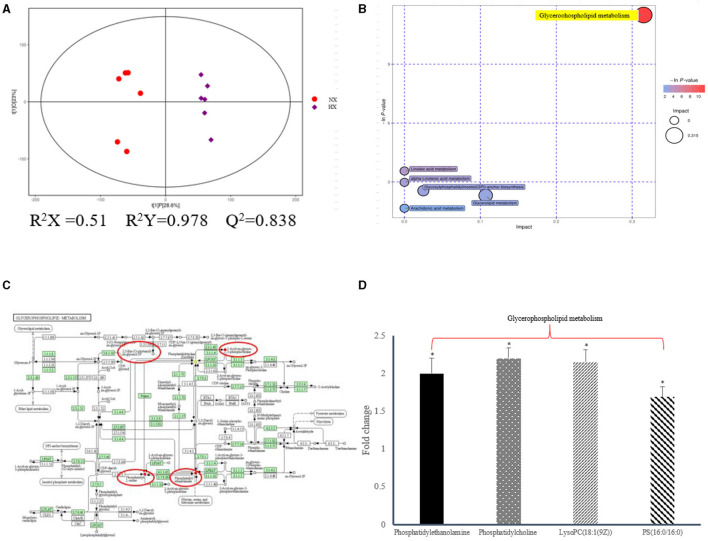
Hypoxia exposure can cause a series of physiological and biochemical reactions in the organism and cells. Our previous studies found the milk fat rate increased significantly in hypoxic dairy cows, however, its specific metabolic mechanism is unclear. In this experiment, we explored and verified the mechanism of hypoxia adaptation based on the apparent and omics results of animal experiments and in vitro cell model. The results revealed that hypoxia exposure was associated with the elevation of AGPAT2-mediated glycerophospholipid metabolism. These intracellular metabolic disorders consequently led to the lipid disorders associated with apoptosis. Our findings update the existing understanding of increased adaptability of dairy cows exposure to hypoxia at the metabolic level.

Keywords: dairy cow; hypoxia; lipid metabolism; lipidomics; metabonomics.


Conflict of interest statement

The authors declare that the research was conducted in the absence of any commercial or financial relationships that could be construed as a potential conflict of interest.

Figures

Figure 1
Figure 1
Lipid metabolic changes of altered by hypoxia exposure in milk and blood of dairy cows. (A) Changes of milk fat and protein. “GH and CH” represent control, hypoxia group, respectively; (B) Changes of serum biochemical indexes. CHO, Cholesterol; TAG, triglycerides; HDL, high-density lipoprotein. n = 6, *p < 0.05.
Figure 2
Figure 2
Metabolic changes altered by hypoxia exposure in plasma of dairy cows. (A) PLS-DA score plot of the two groups in plasma of dairy cows using the identified metabolites in positive ionization mode. “GH and CH” represent control, hypoxia group, respectively; (B) Volcanic plots of the two groups in plasma of dairy cows using the identified metabolites in positive ionization mode; (C) Pathway analysis of the identified metabolites in plasma; (D) The fold changes of the significantly changed metabolites of plasma in metabolic pathways in hypoxia exposure group relative to the control group. Arg, Arginine; Pro, proline; Gly, Glycine; Ser, serine; Thr, threonine; Val, Valine; Leu, leucine; Ile, isoleucine; FFA, Free Fatty acid. n = 6, *p < 0.05, **p < 0.01.
Figure 3
Figure 3
Lipid synthesis by hypoxia exposure in BMECs. (A) ORO staining of BMECs under hypoxia. NX, normoxia; HX, hyoxia; (B) BODIPY staining of BMECs under hypoxia; (C) Level of TAG in BMECs under hypoxia; (D) Expression of genes and proteins related to lipid synthesis under hypoxia. n = 3, *p < 0.05, **p < 0.01. FASN, fatty acid synthase; ACACA, acetyl-CoA carboxylases alpha; SCD1, stearoyl coenzyme A1; CD36, Fatty acid synthase subunit beta; FABP3, fatty acid binding protein 3; LPL, lipoproteinlipase; SREBP1, sterol regulatory element binding protein1; PPARG, peroxisome proliferator-activated receptor gamma.
Figure 4
Figure 4
Metabolic changes altered by hypoxia exposure in BMECs of dairy cows. (A) Two groups of PLS-DA scores were performed on BMECs using the identified metabolites under positive ionization mode. “NX” and “HX” represent normoxia and hypoxia groups, respectively; (B) Volcanic plots of the two groups in BMECs using identified metabolites under positive ionization modes; (C) Pathway analysis of identified metabolites in BMECs; (D) Fold changes in metabolites significantly altered in the metabolic pathway of BMECs in the HX group compared to the NX group. Arg, Arginine; Pro, proline; Gly, Glycine; Ser, serine; Thr, threonine; Val, Valine; Leu, leucine; Ile, isoleucine; FFA, Fatty acid. n = 6, *p < 0.05, **p < 0.01.
Figure 5
Figure 5
Lipidomic changes altered by hypoixa exposure in BMECs. (A) PLS-DA score plot of the two groups of BMECs using the differential metabolites under positive ionization mode. “NX and HX” represent normoxia and hypoxia group, respectively; (B) Pathway analysis of the differential metabolites; (C) KEGG enrichment analysis of diffential metabolites; (D) Fold changes of the significantly changed metabolites in glycerophospholipid metabolic pathways in HX group relative to NX group. n = 6, *p < 0.05.
Figure 6
Figure 6
Changes of cell apoptosis after hypoxia exposure (n = 3). Apoptosis rate under hypoxia detected by flow cytometry, “HX and NX” represent hypoxia, normoxia group; The data are expressed as mean ± SD. Compared with the control, *p < 0.05 show that the difference is statistically significant.
Figure 7
Figure 7
Effect of silencing of AGPAT2 gene on lipid synthesis in BMECs. (A) ORO staining of BMECs under silencing of AGPAT2 gene. NX, normoxia; HX, hypoxia; (B) BODIPY staining of BMECs under silencing of AGPAT2 gene; (C) Level of TAG in BMECs under silencing of AGPAT2 gene; n = 3, **p < 0.01.

References

    1. Li YW, Cao Y, Wang JX, Fu SP, Cheng J, Ma LJ, et al. . Kp-10 promotes bovine mammary epithelial cell proliferation by activating GPR54 and its downstream signaling pathways. J Cell Physiol. (2020) 235:4481–93. 10.1002/jcp.29325 - DOI - PubMed
    1. Berryhill GE, Brust-Mascher I, Huynh JH, Famula TR, Reardon C, Hovey RC. A convenient method for evaluating epithelial cell proliferation in the whole mammary glands of female mice. Endocrinology. (2016) 157:3742–8. 10.1210/en.2016-1480 - DOI - PMC - PubMed
    1. Zheng XR, Ning C, Dong YC, Zhao PJ, Li JH, Fan ZY, et al. . Quantitative proteome analysis of bovine mammary gland reveals protein dynamic changes involved in peak and late lactation stages. Biochem Bioph Res Co. (2017) 494:292–7. 10.1016/j.bbrc.2017.10.038 - DOI - PubMed
    1. Mattmiller SA, Corl CM, Gandy JC, Loor JJ, Sordillo LM. Glucose transporter and hypoxia-associated gene expression in the mammary gland of transition dairy cattle. J Dairy Sci. (2011) 94:2912–22. 10.3168/jds.2010-3936 - DOI - PubMed
    1. Terova G, Rimoldi S, Corà S, Bernardini G, Gornati R, Saroglia M. Acute and chronic hypoxia affects HIF-1a mRNA levels in sea bass (Dicentrarchus labrax). Aquaculture. (2008) 279:150–9. 10.1016/j.aquaculture.2008.03.041 - DOI

LinkOut - more resources